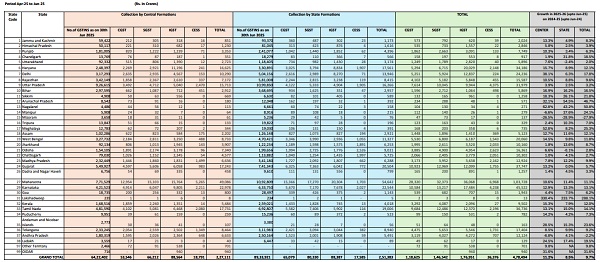
The gross Goods and Services Tax (GST) revenue for June 2025 stood at ₹1,84,597 crore, reflecting a 6.2% year-on-year increase from ₹1,73,813 crore in June 2024. Net GST revenue for the month (after refunds) rose by 3.3% to ₹1,59,106 crore. For the April–June 2025 quarter, gross GST collections reached ₹6,22,363 crore, up 11.8% from ₹5,56,818 crore in the same period last year. Net GST revenue for the quarter increased by 10.7% to ₹5,42,533 crore. Domestic revenues rose by 4.6% in June and 9.7% quarterly, while import revenues saw higher growth—11.4% for June and 19.1% for the quarter. Refunds increased significantly by 28.4% for June and 19.8% quarterly. At the state level, Nagaland saw the highest year-on-year growth at 71%, followed by Tripura (18%) and Lakshadweep (37%). However, some states such as Manipur (-36%), Mizoram (-29%), and Uttar Pradesh (-4%) recorded declines. Maharashtra led all states with ₹30,553 crore in June 2025 collections, followed by Gujarat and Karnataka. The figures are provisional and subject to finalisation.
Goods and Services Tax
Government of India, States and Union Territories
Gross and Net GST revenue collections for the month of June, 2025
Jul 1st, 2025
| GST Gross and Net Collections as on 30/06/2025 (Amount in crores) | ||||||
| Monthly | Yearly | |||||
| GST Collections | June 24 | Jun-25 | % Growth | June 24 | Jun-25 | % Growth |
| A | B | C | D = C/B-1 | E | F | G = F/E-1 |
| A.1. Domestic | ||||||
| CGST | 32,627 | 34,558 | 1,08,882 | 1,18,625 | ||
| SGST | 40,715 | 43,268 | 1,34,518 | 1,46,542 | ||
| IGST | 47,270 | 48,680 | 1,56,968 | 1,76,951 | ||
| CESS | 12,188 | 12,400 | 35,648 | 36,376 | ||
| Gross Domestic Revenue | 1,32,800 | 1,38,906 | 4.6% | 4,36,016 | 4,78,494 | 9.7% |
| A.2. Imports | ||||||
| IGST | 40,040 | 44,600 | 1,17,746 | 1,40,424 | ||
| CESS | 972 | 1,091 | 3,056 | 3,446 | ||
| Gross Import Revenue | 41,012 | 45,690 | 11.4% | 1,20,802 | 1,43,869 | 19.1% |
| A.3. Gross GST Revenue(A.1+A.2) | ||||||
| CGST | 32,627 | 34,558 | 1,08,882 | 1,18,625 | ||
| SGST | 40,715 | 43,268 | 1,34,518 | 1,46,542 | ||
| IGST | 87,310 | 93,280 | 2,74,714 | 3,17,375 | ||
| CESS | 13,160 | 13,491 | 38,704 | 39,821 | ||
| Total Gross GST Revenue | 1,73,813 | 1,84,597 | 6.2% | 5,56,818 | 6,22,363 | 11.8% |
| B.1. Domestic Refunds | ||||||
| CGST | 2,809 | 3,194 | 8,699 | 10,648 | ||
| SGST | 3,693 | 3,873 | 11,034 | 13,090 | ||
| IGST | 4,335 | 5,372 | 13,420 | 19,425 | ||
| CESS | 243 | 204 | 775 | 969 | ||
| Refund – Domestic | 11,080 | 12,643 | 14.1% | 33,929 | 44,132 | 30.1% |
| B.2. Export GST Refunds through ICEGATE | ||||||
| IGST | 8,604 | 12,688 | 32,248 | 35,198 | ||
| CESS | 169 | 159 | 467 | 500 | ||
| Refund – Imports | 8,773 | 12,848 | 46.4% | 32,716 | 35,699 | 9.1% |
| B.3. Total Refund (B.1+B.2) | ||||||
| CGST | 2,809 | 3,194 | 8,699 | 10,648 | ||
| SGST | 3,693 | 3,873 | 11,034 | 13,090 | ||
| IGST | 12,938 | 18,061 | 45,669 | 54,623 | ||
| CESS | 413 | 363 | 1,243 | 1,469 | ||
| Total Refund | 19,853 | 25,491 | 28.4% | 66,645 | 79,831 | 19.8% |
| C.1 Net Revenue Domestic (A.1 – B.1) | ||||||
| CGST | 29,818 | 31,364 | 1,00,182 | 1,07,977 | ||
| SGST | 37,022 | 39,395 | 1,23,484 | 1,33,452 | ||
| IGST | 42,935 | 43,308 | 1,43,548 | 1,57,527 | ||
| CESS | 11,945 | 12,197 | 34,872 | 35,407 | ||
| Net Domestic Revenue | 1,21,720 | 1,26,263 | 3.7% | 4,02,087 | 4,34,362 | 8.0% |
| C.2 Net Revenue Customs (GST) (A.2 – B.2) | ||||||
| IGST | 31,437 | 31,911 | 85,498 | 1,05,225 | ||
| CESS | 803 | 932 | 2,589 | 2,945 | ||
| Net Customs Revenue | 32,239 | 32,843 | 1.9% | 88,087 | 1,08,171 | 22.8% |
| C.3 Net Revenue (C.1+C.2)) | ||||||
| CGST | 29,818 | 31,364 | 1,00,182 | 1,07,977 | ||
| SGST | 37,022 | 39,395 | 1,23,484 | 1,33,452 | ||
| IGST | 74,372 | 75,219 | 2,29,046 | 2,62,752 | ||
| CESS | 12,747 | 13,128 | 37,461 | 38,352 | ||
| Total Net GST Revenue | 1,53,959 | 1,59,106 | 3.3% | 4,90,174 | 5,42,533 | 10.7% |
Note :
The above numbers are provisional and the actuals number may have slightly vary on finalisation
Table 1: State-wise growth of GST Revenues during June, 20251
| State/UT | June-24 | June-25 | Growth (%) |
| Jammu and Kashmir | 555 | 566 | 2% |
| Himachal Pradesh | 886 | 902 | 2% |
| Punjab | 2,306 | 2,232 | -3% |
| Chandigarh | 224 | 220 | -2% |
| Uttarakhand | 1,705 | 1,699 | 0% |
| Haryana | 9,038 | 9,959 | 10% |
| Delhi | 5,289 | 5,610 | 6% |
| Rajasthan | 4,254 | 4,522 | 6% |
| Uttar Pradesh | 9,601 | 9,248 | -4% |
| Bihar | 1,525 | 1,709 | 12% |
| Sikkim | 318 | 364 | 15% |
| Arunachal Pradesh | 91 | 88 | -3% |
| Nagaland | 49 | 84 | 71% |
| Manipur | 62 | 40 | -36% |
| Mizoram | 42 | 30 | -29% |
| Tripura | 74 | 87 | 18% |
| Meghalaya | 180 | 172 | -4% |
| Assam | 1,448 | 1,405 | -3% |
| West Bengal | 5,273 | 5,551 | 5% |
| Jharkhand | 2,814 | 3,086 | 10% |
| Odisha | 4,987 | 5,079 | 2% |
| Chhattisgarh | 3,178 | 3,276 | 3% |
| Madhya Pradesh | 3,631 | 3,889 | 7% |
| Gujarat | 11,102 | 11,040 | -1% |
| Dadra and Nagar Haveli and Daman & Diu | 394 | 410 | 4% |
| Maharashtra | 28,881 | 30,553 | 6% |
| Karnataka | 12,389 | 13,409 | 8% |
| Goa | 546 | 551 | 1% |
| Lakshadweep | 1 | 1 | 37% |
| Kerala | 2,618 | 2,856 | 9% |
| Tamil Nadu | 10,218 | 10,676 | 4% |
| Puducherry | 243 | 241 | -1% |
| Andaman and Nicobar Islands | 31 | 32 | 3% |
| Telangana | 4,716 | 5,111 | 8% |
| Andhra Pradesh | 3,651 | 3,634 | 0% |
| Ladakh | 23 | 28 | 22% |
| Other Territory | 207 | 228 | 10% |
| Center Jurisdiction | 249 | 317 | 27% |
| Grand Total | 1,32,800 | 1,38,906 | 4.60% |
2 Post-Settlement GST is cumulative of the GST revenues of the States/UTs and the SGST portion of the IGST settled to the States/UTs
Table 3 : State Wise/ Approving Authority wise Domestic Colle
Period Apr-25 to Jun-25 (Rs. In Crores)
Thanks,
Team GSTN
Notes:
1Does not include GST on import of goods


