Securities and Exchange Board of India
Household Savings through Indian Securities Market
Dr Prabhas Kumar Rath, Shyni Sunil and Kalyani H 1
Abstract
This article examines the macro-economic effects of methodological shift in the computation of household savings via the Indian securities market undertaken by SEBI in consultation with RBI and MoSPI. The national savings data published by RBI and MoSPI relied broadly on estimations for savings via securities market. 35% of the public and rights issuances in equity, 40% of the public issuances in corporate debt, and mutual fund investments at actuals by households were considered as the savings of households in securities market. Share of households in the preferential issuances of equity, private placement of debt and new age instruments like REITs and InvITs were not included. Further, investment via secondary markets were also not considered.
The revised methodology adopts a granular and comprehensive data approach, additionally incorporating – secondary market in various segments; new-age assets like REITs, InvITs, and AIFs in products; and NPISHs (Non-Profit Institutions Serving Households) in investor category.
Usage of actual granular data from primary sources provides a realistic and accurate picture of how Indian households channel savings into the economy and ensure better data quality for public policy and economic planning. The change in methodology has resulted in 47 basis points increase in the rate of gross savings to GDP in 2024-25.
1. Introduction
The term “savings” has been defined in various ways by different economists. John Maynard Keynes has defined it as an excess of income over consumption expenditure. Milton Friedman viewed savings as the amount leftover when the individual’s consumption is deducted from his disposable income.
One of the major objectives of public policy is the promotion of savings and capital formation in the country as the primary instruments of economic growth. Savings plays a crucial role in the economic development of a nation. National savings represent the total savings generated within a country over a specified period of time, and is the base for capital formation. These savings come from three broad sectors, namely, household sector, private corporate sector and public sector.
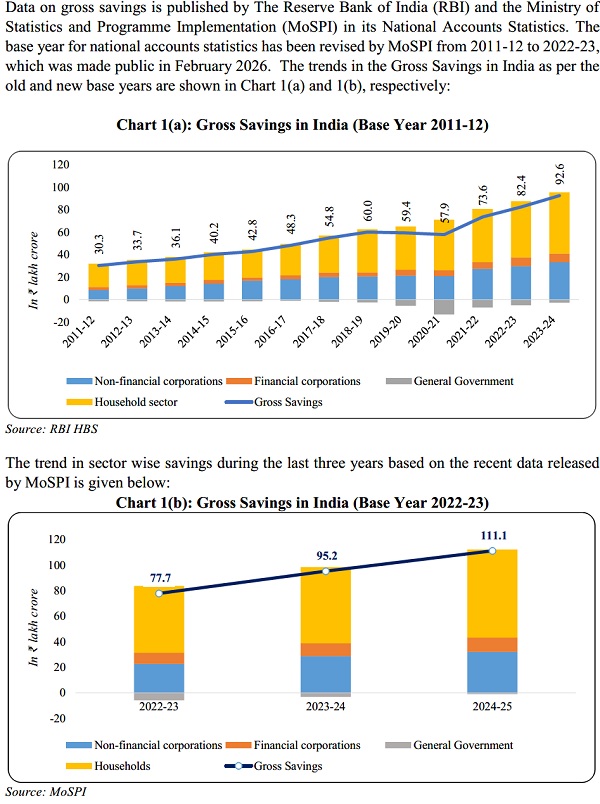
From the Chart, it is evident that the household sector is consistently driving the country’s gross domestic savings. These savings are influenced by factors such as income, inflation, interest rates, risk appetite, and government policies.
Household savings broadly comprises:
- Physical Savings: Tangible assets like real estate, precious metals; and
- Financial Savings: Savings in the form of Currency, Deposits, Shares and Debentures, Claims on government (investments in government securities and small savings), Insurance funds, Provident and Pension Funds
As illustrated in the following charts, physical assets account for the majority of the household savings:
Chart 2(a): Composition of Household Savings (in per cent) (Base Year 2011-12)
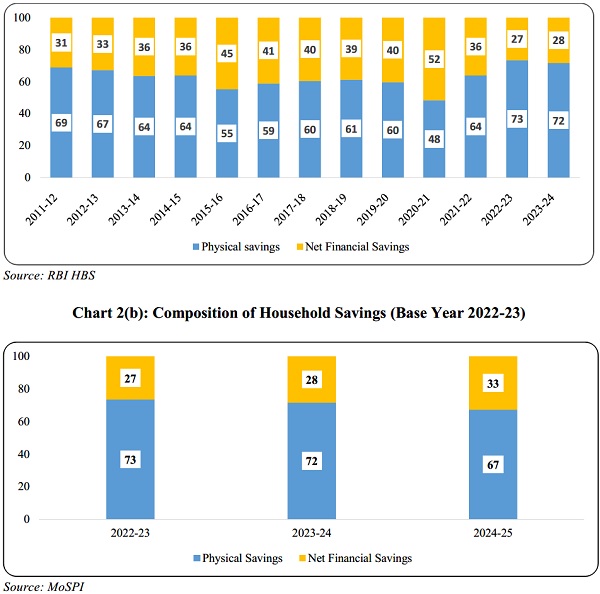
While physical assets like gold and real estate have conventionally been preferred, financial assets are gaining popularity due to their potential for higher returns and liquidity. Government initiatives such as tax benefits on investments, financial inclusion programs, and digital banking have also nudged Indian households towards financial assets.
Household savings channeled through the securities market is a crucial component of the financial savings. The data on household savings reported by RBI relied partly on estimations. While data on mutual fund investments were sourced from SEBI, 35% of the equity via public and rights issuances and 40% of the public issuances of corporate debt were considered for equity and debt, respectively. The household shares in equity, debt and mutual funds, thus computed were in turn used by MoSPI in the computation of Gross Savings in the economy.
The above methodology focused solely on primary market issuances, sans certain channels of primary issuances like private placements. Further, the secondary market transactions, and investments in REITs and InvITs were not part of the computation. Consequently, the reported figures did not fully reflect the total household savings flowing into the securities market.
Over time, the securities market has undergone various structural changes and more so in the last decade. Considering the spectacular increase in individual participation (particularly post Covid) and access to granular data, the following changes were made in the computation methodology, to include:
- Non Profit Institutions Serving Households (NPISHs)
- Equity issuance through preferential route and offer for sale through stock exchanges and private placement of debt
- Muni Bonds, Securitized Debt Instruments and listed Security Receipts as part of Debt, and new age instruments such as Real Estate Investment Trusts (REITs), Infrastructure Investment Trusts (InvITs)
- Secondary market net investment in all segments.
II. Detailed Methodology
A. Investor Categories
i. Individuals: All domestic individual investors irrespective of income/extent of investment and Hindu Undivided Families (HUFs). They are identified from category wise tagging in the depository system and trading member categorization in the Exchange system.
ii. Non-Profit Institutions Serving Households (NPISHs): Includes Association of Persons, Trust, Body of Individuals, Non-Government Organizations, Society, Charities, etc.
B. Instruments
| Instrument | Primary market | Secondary market |
| Equity | Resource mobilization in the form of:
|
Net investment |
| Debt | Resource mobilization in the form of:
|
Net investment in Debt segment (i) Capital market and (ii) RFQ & OTC |
| REITs & InvITs | Resource mobilisation via REITs and InvITs | Net investment |
| Mutual Funds | Resource mobilisation via Mutual Funds | Net investment in closed ended mutual fund schemes and ETFs (including Gold ETFs). |
Data sources
| Instrument | Primary market | Secondary market |
| Equity | Depositories for flows via Public, Rights and Preferential issues & Exchanges (NSE and BSE) for OFS | Stock Exchanges |
| Debt | Depositories | |
| REITs & InvITs | Depositories | |
| Mutual Funds | AMFI |
The category wise resource mobilization via primary market for various instruments (except Mutual Funds) is calculated as per the actual date of credit of securities into the Beneficial Owner (BO) Accounts in the depository system. Data on Resource mobilization via Mutual funds is sourced from Association of Mutual Funds in India (AMFI), which collates the data across the RTAs.
Data on category-wise net investments in secondary market for Equity, Debt, REITs, InvITs and Mutual Funds2 (including Exchange Traded Funds) are collected from stock exchanges.
III. Household Savings through Indian Securities market – Data Summary
The summary of Savings by Households including NPISHs, flowing via Indian Securities market is given in the following table:
(in ₹ crore)
| Particulars 2022-23 | 2023-24 | 2024-25 | |
| Flows via Primary market | |||
| (a) Mutual Funds | 1,66,515 | 2,85,052 | 5,12,765 |
| (b) Equity | 32,486 | 46,879 | 95,139 |
| (c) Debt | 22,090 | 24,882 | 22,400 |
| (d) REITs | – | 248 | 425 |
| (e) InvITs | 152 | 479 | 783 |
| Total Primary market Flows (A) | 2,21,243 | 3,57,539 | 6,31,510 |
| Flows via Secondary market | |||
| (f) Mutual Funds (including ETFs) | 9,448 | 9,783 | 30,885 |
| (g) Equity | -27,684 | -69,329 | -54,786 |
| (h) Debt | 56,452 | 56,744 | 81,887 |
| (i)REITs | -448 | 56 | 437 |
| (j)InvITs | 778 | 3,564 | 1,029 |
| Total Secondary market Flows (B) | 38,546 | 818 | 59,452 |
| Household Savings through Securities market (A+B) | 2,59,789 | 3,58,357 | 6,90,963 |
Source: AMFI, Depositories, Stock Exchanges
IV. Implications of the integration of revised figures in the National Accounts Statistics
The changes in household savings via securities market will impact the gross savings and savings rate in the economy. The effective changes arising from methodology changes are given in the table below:
(in ₹ crore)
| Savings Statistics vis-à-vis GDP with Base Year 2022-23 and corresponding changes – based on revised and earlier methodology for Household Savings through Securities Market | |||
| Particulars 2022-23 2023-24 2024-25 | |||
| a) Revised methodology with SEBI computed data (Base Year 2022-23): | |||
| Gross Savings in the economy, of which | 77,72,917 | 95,17,450 | 1,11,13,324 |
|
52,25,437 | 59,63,550 | 69,00,602 |
| – Household Savings via securities market (revised methodology) | 2,59,789 | 3,58,357 | 6,90,963 |
| Gross Domestic Product (GDP) | 2,61,17,627 | 2,89,83,909 | 3,18,07,309 |
| Gross Savings to GDP | 29.76% | 32.84% | 34.94% |
| Household Savings to GDP | 20.01% | 20.58% | 21.70% |
| Household Savings via securities market to GDP | 0.99% | 1.24% | 2.17% |
–
| Particulars | 2022-23 | 2023-24 | 2024-25 |
| b) If the earlier methodology continued, the figures would have been: | |||
| Gross Savings in the economy, of which | 77,18,943 | 94,34,802 | 1,09,65,118 |
|
51,71,463 | 58,80,902 | 67,52,395 |
| – Household Savings via securities market (earlier methodology)* | 2,05,814 | 2,75,709 | 5,42,756 |
| Gross Savings to GDP | 29.55% | 32.55% | 34.47% |
| Household Savings to GDP | 19.80% | 20.29% | 21.23% |
| Household Savings via securities market to GDP | 0.79% | 0.95% | 1.71% |
| Effective Change in Gross Savings to GDP Ratio, due to the change in methodology in Household Savings through Securities Market computation | 0.21% | 0.29% | 0.47% |
Note: * This comprises Equity and Mutual Fund flows reported by RBI and 40% of the public issuances of debt. The methodology changes in Base Year Revision (2011-12 to 2022-23) has resulted in revision of national accounts data. In order to understand the effect brought in solely by the revisions by SEBI, the recomputed figures were replaced with the earlier estimations.
The actual household savings through securities market is significantly higher than the earlier reported data on account of the comprehensive coverage considered in the computation. For FY 2024-25, the rate of gross savings to GDP has increased to 34.94%, which would have been 34.47% if the old methodology for computation of securities market investments continued. So, with the change in methodology, the under reporting of savings has been taken care of.
Under the revised methodology, the household savings to GDP ratio for FY 2024-25 is 21.7%, compared to 21.23% under the previous methodology. Similarly, net household financial savings improved to 7.10% of GDP, up from the former estimate of 6.63%.
V. Assets accumulated by Households in Indian Securities market – Stock dimension
While the RBI provides data on the stock of household financial assets in addition to household savings, the current coverage is limited to Mutual Fund AUM belonging to individual investors. It does not cover the significant volume of Assets Under Custody held by individuals across equities, debt, REITs, InvITs and AIFs.
The stock of household savings in Indian Securities market is computed using the data from depositories and AMFI and includes the assets held by Households and NPISHs. The same as at the end of Financial Years is given in the following table:
(in ₹ crore)
| Particulars | 2022-23 | 2023-24 | 2024-25 |
| (A) Revised Methodology | |||
| (a) Mutual Funds | 24,45,223 | 36,28,236 | 44,39,413 |
| (b) Equity | 53,66,910 | 84,06,843 | 88,91,532 |
| (c) Debt (Public, Private & Govt) | 5,53,227 | 5,92,385 | 6,23,389 |
| (i) State/Central Debt | 45,823 | 67,443 | 63,577 |
| (ii) Rest of the Debt (public, private, municipal) | 5,07,404 | 5,24,942 | 5,59,812 |
| (d) REITs | 9,194 | 10,655 | 11,441 |
| (e) InvITs | 8,394 | 10,947 | 12,643 |
| (f) AIFs | 63 | 1,33,569 | 1,55,496 |
| Total Assets | 83,83,011 | 1,27,82,635 | 1,41,33,915 |
| (B) Earlier Methodology | |||
| (a) Mutual Funds | 23,67,793 | 33,87,208 | 41,28,925 |
| Change in the assets due to revision in methodology | 60,15,218 | 93,95,427 | 1,00,04,990 |
Source: AMFI, Depositories
VI. Conclusion
In the absence of actual data, estimates do their best to compensate for a constituent in a computation. However, actual data provides superior value and factual picture. Thus, the computation using the actual granular data from primary sources gives a realistic picture about the household savings channelized through the securities market. This ensures enhanced data quality and accuracy. Moreover, the inclusion of new instruments and segments has provided a comprehensive coverage and better captures the shift in household savings from traditional physical assets (gold, real estate) toward financial instruments.
Acknowledgement: The authors sincerely acknowledge the guidance and support received from Shri V Anantha Nageswaran, Chief Economic Advisor, GoI, Officials from RBI and MoSPI, Shri Sunil Kadam, Executive Director SEBI, Shri Pramod Rao, Former Executive Director, SEBI, Shri Ananth Narayan G, Former Whole Time Member, SEBI and Market Data Advisory Committee of SEBI, then led by Dr M.S. Sahoo.
Notes:
1 The authors (in order) are officers of Securities and Exchange Board of India in the capacity of Chief General Manager, Deputy General Manager and Manager in the Department of Economic and Policy Analysis.
The findings and views in this paper are those of the authors and do not necessarily reflect the views of SEBI.
2 Regulation 29(2) of SEBI Mutual Fund Regulations, 2026 stipulates that “Every scheme wherein daily investment and redemptions from the scheme is not available, and such other schemes as specified by the Board, shall be listed on a recognised stock exchange in the manner as may be specified by the Board from time to time.”


