Securities and Exchange Board of India
CIRCULAR
SEBI/HO/IMD/DF3/CIR/P/2020/197
October 05, 2020
All Mutual Funds/
Asset Management Companies (AMCs)/
Trustee Companies/Boards of Trustees of Mutual Funds/
Association of Mutual Funds in India (AMFI)
Sir/ Madam,
Subject: Product Labeling in Mutual Fund schemes – Risk-o-meter
1. Please refer to SEBI circular no. CIR/IMD/DF/5/2013 dated March 18, 2013 and CIR/IMD/DF/4/2015 dated April 30, 2015 captioned as ‘Product Labeling in Mutual Funds’.
2. SEBI, based on the recommendation of Mutual Fund Advisory Committee (MFAC), has reviewed the guidelines for product labeling in mutual funds and the following has been decided:
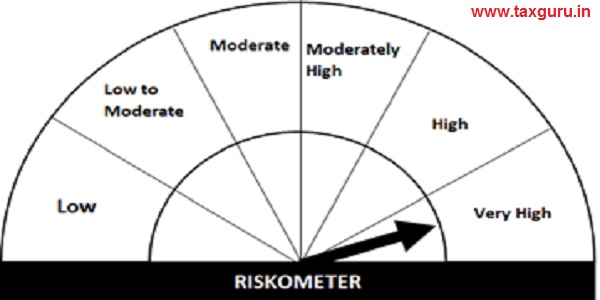
a. Risk Level of a scheme will be depicted by “Risk-o-meter”, as shown below:

b. For example, the risk depicted in the above risk-o-meter is Moderately High
c. Risk-o-meter shall have following six levels of risk for mutual fund schemes:
i. Low Risk
ii. Low to Moderate Risk
iii. Moderate Risk
iv. Moderately High Risk
v. High Risk and
vi. Very High Risk
d. The detailed guidelines for evaluation of risk levels of a scheme along with few examples are provided at Annexure A. Pursuant to calculation of risk value of the scheme portfolio based on the methodology specified in Annexure A, risk level of a scheme as mentioned at Table 11 of Annexure A shall be depicted by risk-o-meter shown above at para 2(a).
e. Based on the scheme characteristics, Mutual Funds shall assign risk level for schemes at the time of launch of scheme/New Fund Offer.
f. Any change in risk-o-meter shall be communicated by way of Notice cum Addendum and by way of an e-mail or SMS to unitholders of that particular scheme.
g. Risk-o-meter shall be evaluated on a monthly basis and Mutual Funds/AMCs shall disclose the Risk-o-meter along with portfolio disclosure for all their schemes on their respective website and on AMFI website within 10 days from the close of each month.
h. Mutual Funds shall disclose the risk level of schemes as on March 31 of every year, along with number of times the risk level has changed over the year, on their website and AMFI website.
i. Mutual Funds shall publish the following table of scheme wise changes in Risk-o-meter in scheme wise Annual Reports and Abridged summary:
| Scheme name | Risk-o-meter level at start of the financial year | Risk-o-meter level at end of the financial year | Number of changes in Risk o-meter during the financial year |
3. Product label shall be disclosed on:
a. Front page of initial offering application form, Scheme Information Documents (SID) and Key Information Memorandum (KIM).
b. Common application form – along with the information about the scheme.
c. The product label with respect to (a) & (b) above shall be placed in proximity to the caption of the scheme and shall be prominently visible.
d. Scheme advertisements – placed in manner so as to be prominently visible to investors.
4. Change in risk-o-meter will not be considered as a Fundamental Attribute Change of the scheme in terms of regulation 18(15A) of SEBI (Mutual Fund) Regulations, 1996.
5. This circular shall be in force with effect from January 1, 2021, to all the existing schemes and all schemes to be launched on or thereafter. However, mutual funds may choose to adopt the provisions of this circular before the effective date.
6. This circular is issued in exercise of the powers conferred under Section 11 (1) of the Securities and Exchange Board of India Act 1992, read with the provision of Regulation 77 of SEBI (Mutual Funds) Regulation, 1996 to protect the interests of investors in securities and to promote the development of, and to regulate the securities market.
Yours faithfully,
Deena Venu Sarangadharan
Deputy General Manager
Tel no.: 022-26449266
Email: deenar@sebi.gov.in
Annexure A
Risk level of a scheme shall be evaluated using the following methodology:
1. The underlying securities of a scheme shall be assigned a value for each of the parameters based on which the risk-o-meter value will be
2. For the purpose of evaluation of risk level, Assets under management (AUM) of the security forming part of the scheme portfolio shall be as on last day of the given
3. The evaluation of risk parameters are as detailed below:
i. Debt securities
a) Credit Risk
- Debt securities of schemes shall be valued for credit risk as follows:
|
TABLE 1 |
|
| Credit rating of the Instrument | CREDIT RISK VALUE |
| G-Sec/AAA/SDL/ TREPS | 1 |
| AA+ | 2 |
| AA | 3 |
| AA- | 4 |
| A+ | 5 |
| A | 6 |
| A- | 7 |
| BBB+ | 8 |
| BBB | 9 |
| BBB- | 10 |
| Unrated | 11 |
| Below investment grade | 12 |
- Based on the weighted average value of each instrument (weights based on the AUM), credit risk value of the portfolio shall be assigned.
- The price of debt instrument to be considered for calculating AUM shall include the accrued interest i.e. dirty price.
- For the above purpose, credit rating of the instrument as on last day of the month shall be considered.
b) Interest Rate Risk
- Interest rate risk shall be valued using Macaulay Duration of the Portfolio:
|
TABLE 2 |
|
| Macaulay Duration of the portfolio (years) | INTEREST RATE RISK VALUE |
| ≤ 0.5 | 1 |
| > 0.5 to ≤ 1 | 2 |
| > 1 to ≤ 2 | 3 |
| > 2 to ≤ 3 | 4 |
| > 3 to ≤ 4 | 5 |
| > 4 | 6 |
- For the above purpose, Macaulay Duration of an instrument as on last day of the month shall be considered.
c) Liquidity Risk
- For measuring liquidity risk of the schemes, listing status, credit rating, structure of debt instruments is considered.
- Liquidity risk of the debt securities shall be valued as follows:
| TABLE 3 | |
| Instrument | LIQUIDITY RISK VALUE |
| embedded options* | |
| Listed BBB+ rated debt securities without bespoke structures/ structured obligations, credit enhancements or embedded options* | 9 |
| Listed BBB rated debt securities without bespoke structures/ structured obligations, credit enhancements or embedded options* | 10 |
| Listed BBB- rated debt securities without bespoke structures/ structured obligations, credit enhancements or embedded options* | 11 |
AAA rated debt securities with any one of the following features*-
|
3 |
AA + rated debt securities with any one of the following features*-
|
4 |
AA rated debt securities with any one of the following features*-
|
5 |
AA- rated debt securities with any one of the following features*-
|
6 |
A+ rated debt securities with any one of the following features*-
|
7 |
A rated debt securities with any one of the following features*-
|
8 |
A- rated debt securities with any one of the following features*-
|
9 |
BBB+ rated debt securities within investment grade with any one of the following features*-
|
10 |
BBB rated debt securities within investment grade with any one of the following features*-
|
11 |
BBB- rated debt securities within investment grade with any one of the following features*-
|
12 |
AAA rated debt securities with more than one of the following features*-
|
4 |
AA + rated debt securities with more than one of the following features*-
|
5 |
AA rated debt securities with more than one of the following features*-
|
6 |
AA- rated debt securities with more than one of the following features*-
|
7 |
A+ rated debt securities with more than one of the following features*-
|
8 |
A rated debt securities with more than one of the following features*-
|
9 |
A- rated debt securities with more than one of the following features*-
|
10 |
BBB+ rated debt securities with more than one of the following features*-
|
11 |
BBB rated debt securities with more than one of the following features*-
|
12 |
BBB- rated debt securities with more than one of the following features*-
|
13 |
| Below investment grade and unrated debt securities | 14 |
| *Or any other structure / feature which increase the liquidity risk of the instrument. | |
- Liquidity Risk Value of a portfolio shall be assigned based on the weighted average of such values (weights based on the AUM) of each instrument.
- For the above purpose, instruments held by the scheme as on last day of the month shall be considered.
d) Risk value for the debt portfolio shall be simple average of credit risk value, interest rate risk value and liquidity risk value. However, if the liquidity risk value is higher than the average of credit risk value, liquidity risk value and interest rate risk value then the value of liquidity risk shall be considered as risk value of the debt portfolio.
e) For investment by mutual funds in instruments having short term ratings, the liquidity risk value and the credit risk value shall be based on the lowest long term rating of the instrument of the same issuer as shown above (in order to follow conservative approach) across credit rating agencies. However, if there is no long term rating of the same issuer, then based on credit rating mapping most conservative long term rating shall be taken for a given short term rating.
ii. Equity
a) Market Capitalization
- Following values shall be assigned to the security for market capitalization parameter:
|
TABLE 4 |
|
| Market Cap of the underlying security | MARKET CAPITALISATION VALUE |
| Large cap | 5 |
| Mid cap | 7 |
| Small cap | 9 |
- The market capitalisation data as published by AMFI on six- monthly basis shall be considered.
- Based on the weighted average of the above Market Capitalisation values of each security (weights being AUM of the security), Market Capitalisation Value of a portfolio shall be assigned.
b) Volatility
- Following values shall be assigned to the security based on its volatility:
|
TABLE 5 |
|
| Daily Volatility of the Security price (based on the past two years price of the security) | VOLATILITY VALUE |
| ≤ 1% | 5 |
| > 1% | 6 |
- Based on the weighted average of above volatility values of each security (weights being AUM of the security), Volatility Value of a portfolio shall be assigned.
If an instrument is traded on multiple stock exchanges, then the most conservative volatility value across stock exchanges for a given month shall be considered.
c) Impact Cost (Liquidity Measure)
- Impact cost shall be considered as a measure for liquidity. Based on the average impact cost of the security for previous three months including the month under consideration following values shall be assigned:
|
TABLE 6 |
|
| Average Impact Cost of the Security for the month | IMPACT COST VALUE |
| ≤ 1% | 5 |
| >1 % to ≤ 2% | 7 |
| > 2% | 9 |
- Based on the weighted average of impact cost values of each security (weights being AUM of the security), impact cost value of a portfolio shall be assigned.
- If an instrument is traded on multiple stock exchanges, then the impact cost shall be based on average value of impact costs across stock exchanges for a given month.
d) For investment in IPOs or recently listed securities, the following process shall be adopted for arriving at weighted average value for Risk-o-meter:
- Market Capitalisation value: Market capitalisation of a security as on the last trading day of the month shall be compared with that of the market capitalisation of the threshold for large cap, mid cap and small cap as published by AMFI and then market capitalisation parameter of risk shall be valued based on the Table 4 mentioned above.
- Volatility value: For the first three months of trading of a security, the value for volatility shall be assigned as 6. From the subsequent months, volatility shall be calculated based on the available security prices as mentioned at Table 5 above.
- Impact cost value: For the first three months of trading of a security, the impact cost value shall be assigned as 5. From the subsequent month, impact cost value shall be as mentioned in Table 6 above.
e) Risk value for equity portfolio shall be simple average of market capitalisation value, volatility value and impact cost value.
iii. Equity Derivatives
- For hedging positions, the underlying security held and its corresponding derivative instrument shall not be included for arriving at risk value. For instance, if XYZ security in cash market is being hedged by its futures instrument, then the XYZ cash market security and short futures position in XYZ security both shall not be considered for arriving at risk value.
- If the quantity of derivative positions taken for hedging purposes are in excess of the underlying position against which the hedging position has been taken, the excess position shall be included while calculating the risk value.
iv. Index Futures and Stock Futures
- For index and stock futures, following values are to be assigned:
| TABLE 7 | |
| Value for Index / Stock futures | INDEX / STOCK FUTURES VOLATILITY VALUE |
| ≤ NIFTY near month futures annualized volatility |
5 |
| > NIFTY near month futures annualized volatility |
6 |
- Based on the weighted average of above values of each security (weights being AUM of the security), the risk value shall be assigned to the portfolio.
v. Index Options and Stock Options
- For index and stock options, following values are to be assigned:
| TABLE 8 | |
| Value for Index / Stock options | INDEX / STOCK OPTIONS’ IMPLIED VOLATILITY VALUE |
| ≤ India VIX | 5 |
| > India VIX | 6 |
- Based on the weighted average of above values of each security (weights being AUM of the security), the risk value shall be assigned to the portfolio.
vi. Other derivative instruments
- If the derivative instrument is used for hedging, then the hedging instrument shall not be included for calculating the risk value only if the quantity of derivative instrument is less than or equal to the quantity of underlying/instrument being hedged. If the derivative instrument position is in excess of the underlying then the excess position shall be considered while calculating the risk value.
- If Interest rate swaps (IRS) are being used for hedging purpose, then IRS shall not be considered for arriving at the risk value.
- For investment in other derivative instruments, such instruments shall be valued as under:
| TABLE 9 | |
| Daily Volatility of the instrument | VOLATILITY VALUE |
| ≤ 1% | 5 |
| >1% | 6 |
- Volatility calculated above is based on daily close prices of past three months of the instrument.
- Based on the weighted average of above values of each security (weights being AUM of the security), the risk value shall be assigned to the portfolio.
vii. REITs & InvITs
- Investment by schemes in REITs and InvITs shall be valued as 7 from risk perspective.
- Based on the weighted average of each security (weights being AUM of the security), the risk value shall be assigned to the portfolio.
viii. Gold and Gold related instruments:
- Investment in Gold and gold related instruments by schemes shall be valued as 4 from risk perspective.
- Based on the weighted average of each security (weights being AUM of the security), the risk value shall be assigned to the portfolio.
ix. Foreign Securities
- Investment by schemes in foreign securities shall be valued as 7 from risk perspective.
- Based on the weighted average of each security (weights being AUM of the security), the risk value shall be assigned to the portfolio.
x. Mutual Fund Schemes:
- For schemes holding units of other mutual fund schemes, the following values shall be assigned basis the risk-o-meter of underlying schemes:
| TABLE 10 | |
| Risk as per risk-o-meter | Value |
| Low | 1 |
| Low to Moderate | 2 |
| Moderate | 3 |
| Moderately High | 4 |
| High | 5 |
| Very High | 6 |
- The risk value for investment in overseas mutual fund units or ETFs shall be 7.
- Based on the weighted average of each mutual fund scheme held (weights being AUM of the scheme), the risk value shall be assigned to the portfolio.
xi. Cash and Net Current Assets:
- Cash and Net Current Assets, shall be valued as 1 from risk perspective.
4. Risk-o-meter value
- Based on the above calculations, the risk value arrived upon shall be mapped to the risk level mentioned in the table below and the same may be depicted in the risk-o-meter:
| TABLE 11 | ||
| Risk Value | RISK LEVEL AS PER RISK-O-METER | |
| ≤ 1 | Low | |
| >1 to ≤ | 2 | Low to Moderate |
| >2 to ≤ | 3 | Moderate |
| >3 to ≤ | 4 | Moderately High |
| >4 to ≤ | 5 | High |
| >5 | Very High | |
5. Illustrations:
In order to illustrate the above process, following are a few illustrations:
A. Debt scheme
- Consider a bond scheme category having 10 debt securities with following attributes:
- At the portfolio level, the average Macaulay Duration is 1.41
| TABLE 12 | |||
| Securities held by the scheme |
Weight as % of AUM |
Credit rating |
Structure |
| A | 10% | AAA – PSU |
No additional feature/structure |
| B | 10% | AA- | Unlisted and has structured obligation |
| C | 10% | A | No additional feature/structure |
| D | 10% | BBB+ | No additional feature/structure |
| E | 10% | AA | Has credit enhancement |
| F | 10% | AA+ | Is bespoke and unlisted |
| G | 10% | A | No additional feature/structure |
| H | 10% | AA | No additional feature/structure |
| I | 10% | AAA | No additional feature/structure |
| J | 10% | TREPS | – |
DEBT- Security A to J
- Based on the above portfolio, following shall be parameter based valuing of securities held by the scheme:
| TABLE 13 | ||||
| Securities held by the scheme |
Weight as % of AUM |
Credit Risk value |
Interest Rate Risk Value |
Liquidity risk value |
| A | 10% | 1 | 1 | |
| B | 10% | 4 | 7 | |
| C | 10% | 6 | 7 | |
| D | 10% | 8 | 9 | |
| E | 10% | 3 | 5 | |
| F | 10% | 2 | 5 | |
| G | 10% | 6 | 7 | |
| H | 10% | 3 | 4 | |
| I | 10% | 1 | 2 | |
| J | 10% | 1 | 1 | |
| TOTAL* | 3.5 | 3 | 4.8 | |
*Total is calculated as weighted average with weights based on AUM of the instrument in the scheme as under:
| TABLE 14 | ||
| Parameter | Average | Value |
| Credit risk | 0.1 X 1 + 0.1 X 4 + 0.1 X 6 + 0.1 X 8 + 0.1 X 3 + 0.1 X 2 + 0.1 X 6 + 0.1 X 3 + 0.1 X 1 + 0.1 X 1 | 3.5 |
| IR Risk | 1 x 3 | 3 |
| LR value | 0.1 X 1 + 0.1 X 7 + 0.1 X 7 + 0.1 X 9 + 0.1 X 5 + 0.1 X 5 + 0.1 X 7 + 0.1 X 4+ 0.1 X 2+ 0.1 x1 | 4.8 |
| Simple Average | 3.8 | |
PORTFOLIO RISK-O-METER VALUE:
- Simple average of the above three parameters comes out to 3.8 ([3.5+3+4.8]/3)
- Since the liquidity risk value of 4.8 is higher than the average value of above three parameters i.e. 3.8, the risk value assigned to the scheme will be 4.8. Hence, the risk level as per Risk-o-meter is High.
- Therefore, risk-o-meter for the abovementioned debt scheme would be High, and shall be as depicted below:
 B. Equity scheme
- Consider an Equity scheme having 10 equity securities with following attributes:
| TABLE 15 | ||||
| Securities held by the scheme |
Weight as % of AUM |
Market Cap |
Volatility | Impact cost |
| A | 10% | Large Cap | 0.01% | 0.2% |
| B | 10% | Large Cap | 1.5% | 0.3% |
| C | 10% | Mid cap | 2.5% | 1.5% |
| D | 10% | Mid cap | 1.5% | 1.2% |
| E | 10% | Mid cap | 2% | 1.9% |
| F | 10% | Mid cap | 1.5% | 1.2% |
| G | 10% | Large Cap | 0.005% | 0.7% |
| H | 10% | IPO | – | – |
| I | 10% | Small Cap | 1.7% | 2.5% |
| J | 10% | Cash | – | – |
- Based on the above portfolio, following shall be the scoring of the securities held by the scheme across parameters:
EQUITY – Security A to I
| TABLE 16 | ||||
| Securities held by the scheme |
Weight as % of AUM |
Market Cap Value |
Volatility Value |
Impact cost Value |
| A | 10% | 5 | 5 | 5 |
| B | 10% | 5 | 6 | 5 |
| C | 10% | 7 | 6 | 7 |
| D | 10% | 7 | 6 | 7 |
| E | 10% | 7 | 6 | 7 |
| F | 10% | 7 | 6 | 7 |
| G | 10% | 5 | 5 | 5 |
| H* | 10% | 7 | 6 | 5 |
| I | 10% | 9 | 6 | 9 |
| TOTAL | 90% | 6.6 | 5.8 | 6.3 |
* Assuming the market cap of the security at the time of listing is falling under Mid cap as per the market cap data published by AMFI, a value of 7 is considered. Volatility value and Impact cost value are considered as 6 and 5 respectively.
- The TOTAL mentioned above is calculated as under:
| TABLE 17 | |||
| Parameter | Average | Value | |
| Market Cap |
0.1 X 5 + 0.1 X 5 + 0.1 X 7 + 0.1 X 7 + 0.1 X 7 X 7 + 0.1 X 5 + 0.1 X 7 + 0.1 X 9 | + 0.1 | 6.6 |
| Volatility Value |
0.1 X 5 + 0.1 X 6 + 0.1 X 6 + 0.1 X 6 + 0.1 X 6
X 6 + 0.1 X 5 + 0.1 X 6 + 0.1 X 6 |
+ 0.1 | 5.8 |
| Impact cost value |
0.1 X 5 + 0.1 X 5 + 0.1 X 7 + 0.1 X 7 + 0.1 X 7
X 7 + 0.1 X 5 + 0.1 X 5 + 0.1 X 9 |
+ 0.1 | 6.3 |
| Simple Average |
6.2 | ||
- Simple average of the above three parameters comes out to 6.2 [(6.6+5.8+6.3)/3]
CASH – Component J
- Further, cash component is valued as 1.
PORTFOLIO RISK-O-METER VALUE:
- Hence, the average for the total portfolio is 0.9 x 6.2 + 0.1 x 1 = 5.7
- Since the value of risk is higher than 5, it shall fall into range of Very High Risk.
- Therefore, risk-o-meter for the abovementioned equity scheme would be Very High, and shall be as depicted below:
 C. Multi asset scheme:
- Consider a Multi Asset category scheme having 10 securities with following attributes:
|
TABLE 18 |
|||||
| Type of security |
Securities held by the scheme |
Weight as % of AUM |
Market Cap | Volatility | Impact cost |
| Equity | A | 20% | Large Cap | 0.01% | 0.2% |
| Equity | B | 10% | Large Cap | 1.5% | 0.3% |
| Equity | C | 10% | Mid cap | 2.5% | 1.5% |
| Type of security |
Securities held by the scheme |
Weight as a % of AUM |
Credit rating |
Macaulay Duration | Structure |
| Debt | D | 10% | A | 2.6 | No additional feature/stru cture |
| Debt | E | 10% | AA | 2.1 | No additional feature/stru cture |
| Debt | F | 10% | AAA | 2.8 | No additional feature/stru cture |
| TREPS | G | 10% | – | – | – |
| Gold ETF | H | 10% | – | – | – |
| REITS | I | 10% | – | – | – |
| Interest rate swap (IRS) | J | -20% | |||
- As interest rate swap instrument was used for hedging, it is not included while calculating the risk value.
- Macaulay Duration of debt scheme portfolio (D, E & F) is 2.5 years
- Based on the above portfolio, following shall be the valuing of the securities held by the scheme across parameters:
| TABLE 19 | ||||
| Securities held by the scheme |
Weight as % of AUM |
Market Cap Value |
Volatility Value |
Impact cost Value |
| A | 20% | 5 | 5 | 5 |
| B | 10% | 5 | 6 | 5 |
| C | 10% | 7 | 6 | 7 |
| Securities held by the scheme | Weight as a % of AUM | Credit Risk value |
Interest rate risk value |
Liquidity risk value |
| D | 10% | 6 | 7 | |
| E | 10% | 3 | 4 | |
| F | 10% | 1 | 2 | |
| G | 10% | 1 | 1 | |
EQUITY- Security A, B and C
| TABLE 20 | ||||
| Securities held by the scheme |
Weight as % of AUM |
Market Cap Value |
Volatility Value |
Impact cost Value |
| A | 20% | 5 | 5 | 5 |
| B | 10% | 5 | 6 | 5 |
| C | 10% | 7 | 6 | 7 |
–
| TABLE 21 | ||
| Parameter | Average | Value |
| Market Cap | 0.2 X 5 + 0.1 X 5 + 0.1 X 7 | 2.2 |
| Volatility Value | 0.2 X 5 + 0.1 X 6 + 0.1 X 6 | 2.2 |
| Impact cost value | 0.2 X 5 + 0.1 X 5 + 0.1 X 7 | 2.2 |
| Simple Average | 2.2 | |
DEBT- Security D, E, F and G
| TABLE 22 | ||||
| Securities held by the scheme |
Weight as a % of AUM |
Credit Risk value |
Interest rate risk value |
Liquidity risk value |
| D | 10% | 6 | 7 | |
| E | 10% | 3 | 4 | |
| F | 10% | 1 | 2 | |
| G | 10% | 1 | 1 | |
–
| TABLE 23 | |||
| Parameter | Average | Value | |
| Credit risk | 0.1 X 6 + 0.1 X 3 + 0.1 X 1 | + 0.1 X 1 | 1.1 |
| IR Risk | 0.4 x 4 | 1.6 | |
| LR value | 0.1 X 7 + 0.1 X 4 + 0.1 X 2 | + 0.1 X 1 | 1.4 |
| Simple Average | 1.37 | ||
- For debt component, Simple average of the three parameters comes out to 1.37.
- Since the liquidity risk value of 1.4 is higher than the average value of above three parameters i.e. 1.37, the risk value assigned to the scheme will be 1.4.
GOLD and REITS – H and I
| TABLE 24 | |||
| Securities held by the scheme |
Weight as a % of AUM |
Risk Value | Value |
| H | 10% | 4 | 0.4 |
| I | 10% | 7 | 0.7 |
PORTFOLIO RISK-O-METER VALUE:
- The final weighted average risk value for the portfolio is as under: 2.2 + 1.4 + 0.4 + 0.7 = 4.7
- Since the value of risk is higher than 4, it shall fall into range of High Risk.
- Therefore, risk-o-meter for the abovementioned scheme would be High, and shall be as depicted below.


