The Union Budget for FY23 was presented in an uncertain macroeconomic environment. Soon after its presentation, the geopolitical conflict aggravated global supply disruptions and adversely impacted the prices of fuel, food, and other essential commodities. The Government of India’s fiscal policy response to the crisis comprised of a judicious mix of increasing food and fertiliser subsidies on the one hand and a reduction in taxes on fuel and certain imported products on the other. Despite these additional fiscal pressures during the year, the Union Government is on track to achieve the budget estimate for the fiscal deficit in FY23. The resilience in the fiscal performance of the Union Government has been facilitated by the recovery in economic activity, buoyancy in revenues from direct taxes and GST, and realistic assumptions in the Budget. The Gross Tax Revenue registered a YoY growth of 15.5 per cent from April to November 2022, driven by robust growth in the direct taxes and Goods and Services Tax (GST). The growth in direct taxes during the first eight months of the year was much higher than their corresponding longer-term averages. The GST has stabilised as a vital revenue source for central and state governments, with the gross GST collections increasing at 24.8 per cent on YoY basis during April – December 2022.
On the expenditure side, the Union Government’s emphasis on capital expenditure (Capex) has continued despite higher revenue expenditure requirements during the year. The Centre’s Capex has steadily increased from a long-term average of 1.7 per cent of GDP (FY09 to FY20) to 2.5 per cent of GDP in FY22 PA. The Centre has also incentivised the State Governments through interest-free loans and enhanced borrowing ceilings to prioritise their spending on Capex. With an emphasis on infrastructure-intensive sectors like roads and highways, railways, and housing and urban affairs, the increase in Capex has large-scale positive implications for medium-term growth. This Capex-led growth strategy will enable India to keep the growth-interest rate differential positive, leading to a sustainable government debt to GDP in the medium run.
Introduction
3.1 With the continuing global risks and uncertainties, the availability of fiscal space with governments has become paramount. It is especially true following the recent incidence of the pandemic when the fiscal policy became an effective macroeconomic stabilisation tool globally. In India, particularly when all economic activities had reached a standstill, fiscal policy was instrumental in providing a safety net to the vulnerable, reviving the economy by boosting demand, and addressing certain domestic supply-side constraints through public investments and sustained structural reforms.
3.2 The large, frontloaded packages across the countries led to over-stimulation of demand, leading to its much faster recovery. In combination with the still-existing supply disruptions and constraints, the overheating of the economy led to inflationary pressures. The conflict in Europe and the related geopolitical developments aggravated the crisis. The slowing global growth, rising interest rates, persistently high inflation rates and uncertain global environment have thus posed certain pertinent questions for fiscal-policy experts to motivate the overarching fiscal policy strategy. How to evaluate the trade-off between maintaining fiscal support to manage the continuing crisis versus withdrawing fiscal stimulus from the economy to control inflation and regain the lost fiscal space? When to do so and at what pace? While a sudden withdrawal may have costs for medium-term growth, a slow withdrawal may be inflationary and hence put upward pressure on yields, making the debt costly. Moreover, the financial markets may have less tolerance for fiscal unorthodoxy in an era of rising interest rates1.
3.3 Against this backdrop, the Government of India adopted a calibrated fiscal response to the pandemic and planned to withdraw the fiscal stimulus gradually as it moves along the glide path outlined in the Budget FY22. This chapter discusses the government’s fiscal strategy amidst uncertain geopolitical developments. The chapter starts with a discussion of the performance of the Union Government’s finances, followed by an overview of the State finances. It concludes with a commentary on India’s debt profile.
Developments in Union Government finances
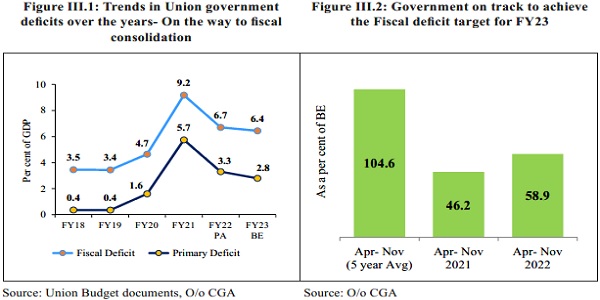
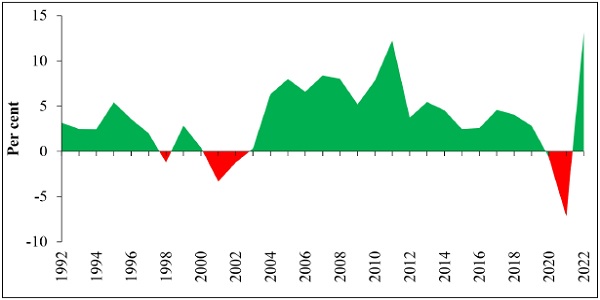
3.4 While India entered the pandemic with a stretched fiscal position, the government’s prudent and calibrated fiscal response enabled stable public finances even amidst the present uncertainties. The fiscal deficit of the Union Government, which reached 9.2 per cent of GDP during the pandemic year FY21, has moderated to 6.7 per cent of GDP in FY22 PA and is further budgeted to reach 6.4 per cent of GDP in FY23 (Figure III.1). This gradual decline in the Union government’s fiscal deficit as a per cent of GDP, in line with the fiscal glide path envisioned by the government, is a result of careful fiscal management supported by buoyant revenue collection over the last two years.
Union Government on track to achieve the Fiscal deficit target for FY23
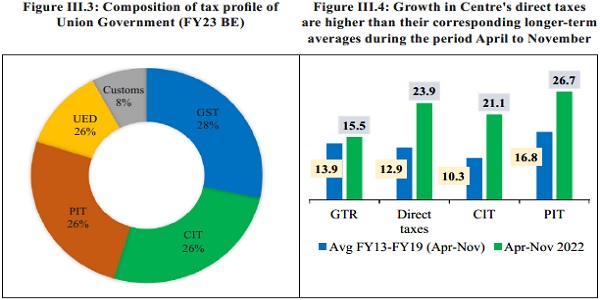
3.5 The Union Budget for FY23 was presented in a recovering yet uncertain macroeconomic environment, not anticipating the geopolitical developments that unfolded during the year. As the conflict in Europe broke out early in the year, it aggravated supply disruptions and had an adverse impact on the prices of fuel, food, and other essential commodities. The government’s fiscal policy response necessitated additional spending on food and fertiliser subsidies, accompanied by specific duty cuts to control the pass-through of the high imported prices to the consumers/ users. Despite additional fiscal resource pressures during the year, the Union Government is well on track to achieve the budget estimate for the fiscal deficit in FY23. The fiscal deficit of the Union Government at the end of November 2022 stood at 58.9 per cent of the BE, lower than the five-year moving average of 104.6 per cent of BE during the same period (Figure III.2).
Conservative budget assumptions provide a buffer during global uncertainties.
3.6 This resilience in the fiscal performance of the Centre has resulted due to a recovery in economic activity, buoyancy in revenues observed during the year, and conservative assumptions of macroeconomic variables in the Budget. The prudent assumptions in Budget FY23 provided a buffer to the government during global uncertainties. As an illustration, the Gross Tax Revenue (GTR) to the Centre was envisaged to grow at 9.6 per cent in FY23 BE relative to FY22 RE. However, given the higher ‘Provisional Actual’ figures recorded for the GTR relative to the Revised estimates in FY22, the growth in GTR of FY23 BE turns out to be a mere 1.8 per cent over FY22 PA. Against this implicit (budgeted) growth, the data of the first eight months of the year show that GTR has grown at a much higher rate (Table III.1). The annual estimate of GTR for FY23 is thus expected to overshoot the budget estimates.
Table: III.1: Stable performance of the Union Government fiscal indicators from April to November 2022
|
₹ lakh crore |
As a per cent of BE | YoY growth (per cent) | ||||||
| BE FY23 | Apr-Nov 2021 | Apr-Nov 2022 | Apr-Nov 2021 | Apr-Nov 2022 | 5 yr Avg Apr-Nov | Apr-Nov 2021 | Apr-Nov 2022 | |
| Revenue Receipts | 22.04 | 13.58 | 14.23 | 75.9 | 64.6 | 12.3 | 67.1 | 4.8 |
| Gross tax revenue | 27.58 | 15.42 | 17.81 | 69.5 | 64.6 | 13.9 | 50.3 | 15.5 |
| Assignment to States | 8.17 | 4.03 | 5.51 | 60.5 | 67.5 | 16.6 | 20.4 | 36.8 |
| Tax Revenue (net to Centre) | 19.35 | 11.35 | 12.25 | 73.5 | 63.3 | 12.9 | 64.9 | 7.9 |
| Non-Tax Revenue | 2.70 | 2.23 | 1.98 | 91.8 | 73.5 | 13.3 | 79.5 | -11.1 |
| Non-Debt Capital Receipts | 0.79 | 0.21 | 0.41 | 11.0 | 52.3 | 30.6 | 14.1 | 100.4 |
| Non-Debt receipts | 22.84 | 13.79 | 14.65 | 69.8 | 64.1 | 12.2 | 66.0 | 6.2 |
| Total Expenditure | 39.45 | 20.75 | 24.43 | 59.6 | 61.9 | 11.4 | 8.8 | 17.7 |
| Revenue Expenditure | 31.95 | 18.01 | 19.96 | 61.5 | 62.5 | 11.4 | 8.2 | 10.8 |
| Capital
Expenditure |
7.50 | 2.74 | 4.47 | 49.4 | 59.6 | 12.9 | 13.5 | 63.4 |
| Revenue Deficit | 9.90 | 4.43 | 5.73 | 38.8 | 57.8 | 11.4 | -48.1 | 29.3 |
| Fiscal Deficit | 16.61 | 6.96 | 9.78 | 46.2 | 58.9 | 11.5 | -35.3 | 40.6 |
| Primary Deficit | 7.21 | 2.34 | 4.33 | 33.5 | 60.1 | 13.1 | -66.2 | 85.1 |
Source: Union Budget documents, O/o CGA
Performance of Union Government Non-debt Receipts
3.7 The Union government’s non-debt receipts comprise revenue receipts (tax and non-tax) and non-debt capital receipts. The shortfall in the non-debt receipts to meet the expenditure requirement is met by borrowings of the government (called fiscal deficit). This section evaluates the performance of the Receipts side of the Union Government’s finances.
Sustained revenue buoyancy over the last two years
3.8 After plummeting during the pandemic-affected year FY21, revenue receipts registered robust growth in FY22 PA, both on a YoY basis and to the pre-pandemic year FY20 (Annexe 1: Table 3). This revenue revival was attributed to a rebound in the collection of all major direct and indirect taxes (except excise duties) in FY22. Last year’s revenue buoyancy momentum is continuing into the current year. The Gross Tax Revenue registered a YoY growth of 15.5 per cent from April to November 2022, and the Net Tax Revenue to the Centre after the assignment to states grew by 7.9 per cent on a YoY basis (Table III.1, III.2).
Table: III.2: Buoyant Union Government taxes from April to November 2022
| In ₹ lakh crore | As a per cent of BE | YoY growth (per cent) | |||||
| BE FY23 | Apr-Nov 2021 | Apr-Nov 2022 | Apr-Nov 2021 | Apr-Nov 2022 | Apr-Nov 2021 | Apr-Nov 2022 | |
| Gross Tax Revenue, of which | 27.58 | 15.42 | 17.81 | 69.5 | 64.6 | 50.3 | 15.5 |
| Direct taxes | 14.20 | 7.00 | 8.67 | 63.1 | 61.0 | 66.3 | 23.9 |
| a. Corporation Tax | 7.20 | 3.54 | 4.28 | 64.6 | 59.5 | 90.4 | 21.1 |
| b. Taxes on income other than Corporation tax | 7.00 | 3.46 | 4.39 | 61.7 | 62.7 | 47.2 | 26.7 |
| Indirect taxes | 13.30 | 8.21 | 8.91 | 74.5 | 67.0 | 38.6 | 8.5 |
| c. Custom | 2.13 | 1.26 | 1.41 | 92.5 | 66.4 | 99.5 | 12.4 |
| d. Union Excise Duties |
3.35 | 2.42 | 1.91 | 72.2 | 57.1 | 23.2 | -20.9 |
| e. Service Tax | 0.02 | 0.01 | 0.00 | 50.2 | 20.4 | -52.6 | -18.7 |
| f. GST | 7.80 | 4.53 | 5.57 | 71.9 | 71.5 | 36.5 | 23.1 |
Source: Union Budget documents, O/o CGA
3.9 The resilience exhibited by economic growth underpins the sustained revenue buoyancy observed over the years. However, that revenues have grown at a pace much higher than the growth in GDP is a testimony to the effectiveness of efforts taken by the government to expand the tax base and enhance tax compliance. Structural reforms like the introduction of GST and the digitalisation of economic transactions have led to the greater formalisation of the economy and hence expanded the tax net. Other tax administration/policy measures, such as the Faceless Assessment and Appeal, simplification of return filing, assistance to taxpayers in getting familiar with the systems, generation of e-way bills under the GST system, and information sharing between government departments among others, have nudged higher tax compliance through technology and artificial intelligence. Details may be seen in Annexe 2 and 3.
Direct taxes propelling the growth in Gross tax revenue
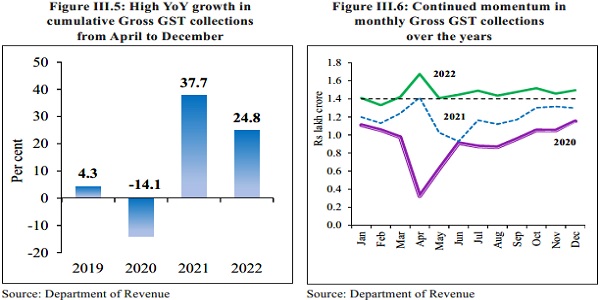
3.10 Direct taxes, which broadly constitute half of the Gross Tax Revenue (Figure III.3), have registered a YoY growth of 26 per cent from April to November 2022, enabled by corporate and personal income tax growth. The growth rates observed in the major direct taxes during the first eight months of FY23 were much higher than their corresponding longer-term averages (Figure III.4).
Source: Union Budget FY23, O/o CGA
Note: GTR – Gross Tax Revenue, GST – Goods and Services Tax, CIT – Corporation Income Tax, PIT – Taxes on
Income other than Corporation Income Tax.m UED – Union Excise Duties
Customs and Excise duties act as Flexi-fiscal policy tools
3.11 While direct taxes have safeguarded the revenue buoyancy, indirect taxes such as customs and excise duties have acted as flexible policy tools during the fiscal response to the pandemic. When the collection of direct and indirect taxes was adversely impacted during the pandemic year FY21, and low global oil prices created some elbow room for raising taxes on petroleum, the government raised the excise duty on petrol and diesel to augment the revenue pool. Subsequently, when other taxes recovered and inflationary pressures built up in the economy, the government reduced the excise duty in November 2021 and May 2022 to control the pass-through of the rising global oil prices on the consumers. The budget estimate had factored in negative growth of 15 per cent on excise collections for FY23. In line with the expectation, the excise duty collection has declined by 20.9 per cent from April to November 2022 on a YoY basis.
3.12 Given the rise in prices of essential imported products during FY23, customs duties were brought down on several items to control the inflation impact on edible oils, pulses, cotton, steel, etc. However, high imports during the current year have led to a 12.4 per cent YoY growth in the customs collection from April to November 2022 (Table III.2), which is higher than the average growth during the corresponding period from FY13 to FY19.
Stabilising Goods and Services Tax yielding returns
3.13 The Goods and Services Tax (GST) has evolved and stabilised as a vital revenue source for central and state governments (may refer Box III.1). Their gross GST collections, taken together, were ₹13.40 lakh crore from April to December 2022. Thus, implying a YoY growth of 24.8 per cent (Figure III.5). The pick-up in GST collections was consistently spread across all the months during the current fiscal year, with an average monthly collection of ₹1.5 lakh crore (Figure III.6). The improvement in GST collections has been due to the combined effect of the rapid economic recovery post-pandemic, the nationwide drive against GST evaders and fake bills along with many systemic changes introduced recently, and various rate rationalisation measures undertaken by the GST Council to correct inverted duty structure. Consistent efforts have resulted in a doubling of the GST net, with the number of GST taxpayers increasing from nearly 70 lakh in 20172 to more than 1.4 crore in 2022. Apart from directly supporting government revenues, GST has led to better reporting of income, which in turn has positive externalities for income tax collection and economic activity.
Box III.1: Maturing system of indirect tax collections
Has the shift to GST improved or worsened the buoyancy of India’s indirect tax system? This box attempts an analysis to shed light on this question.
The aggregate State and Central taxes subsumed in the GST exhibited a CAGR of 11.53 per cent in the pre-GST period (FY13 to FY17). The nominal GDP grew at a CAGR of 11.54 per cent during this period (see items 1 to 7 of Table 1A). Since the growth of the subsumed taxes was marginally less than the growth of GDP, the buoyancy was just below one and could be taken as one for practical purposes.
The post-GST period experienced many headwinds, most notably the exogenous shock of the Covid pandemic. The nominal GDP grew at a slower CAGR of 9.6 per cent in the post-GST years (FY19 to FY23). However, GST collections have grown at a CAGR of 10.9 per cent (see items 8 to 10 of Table 1B), implying aggregate GST collections buoyancy of around 1.1. This has occurred even though the effective GST rate has fallen from inception (from 14.4 per cent in 2017 to 11.6 per cent in 2019, according to RBI).
Improved tax collection efficiency was one of the main arguments in favour of GST. The evidence so far suggests that GST is indeed showing a higher buoyancy than the pre-GST system. This augurs well for future resource mobilisation in the economy.
Comparing the performance of All taxes subsumed in GST (Pre vs post-GST period)
Table 1A: Pre GST period
|
FY13 |
FY14 | FY15 | FY16 | FY17 | CAGR (FY17 over FY13) |
|
| ₹ lakh crore | ||||||
| State taxes subsumed in GST | ||||||
| 1. Subsumed total state tax collection on GST portal | 2.86 | 3.09 | 3.32 | 3.97 | 3.92 | |
| 2. Augmented total states taxes subsumed in GST(a) | 3.22 | 3.48 | 3.73 | 4.41 | 4.41 | |
|
Central taxes subsumed in GST |
||||||
| 3. Union Excise duties from non-petroleum products | 0.33 | 0.35 | 0.34 | 0.37 | 0.60 | |
| 4. Service tax | 1.33 | 1.55 | 1.68 | 2.11 | 2.54 | |
| 5. Total of Central taxes subsumed in GST ((3)+(4)) | 1.66 | 1.90 | 2.02 | 2.48 | 3.14 | |
| 6. Total taxes subsumed in GST (Centre + States) ((2)+(5)) | 4.88 | 5.37 | 5.75 | 6.90 | 7.55 | 11.53% |
| 7. Nominal GDP | 99.44 | 112.34 | 124.68 | 137.72 | 153.92 | 11.54% |
| Buoyancy of total subsumed taxes in GST | 0.9988 | |||||
Table 1B: Post GST period
|
FY19 |
FY20 | FY21 | FY22 | FY23* | CAGR (FY23 over FY19) |
|
| ₹ lakh crore | ||||||
| 1. Total GST collections (domestic supplies) | 8.77 | 9.44 | 8.66 | 10.98 | 12.94 | 10.2% |
| 2. Total GST collections (including GST on imports) | 11.77 | 12.22 | 11.37 | 14.90 | 17.80 | 10.9% |
| 3. India Nominal GDP | 189.00 | 200.75 | 198.01 | 236.65 | 273.09 | 9.6% |
| Buoyancy of GST collections (domestic supplies) | 1.0603 | |||||
| Buoyancy of GST collections (including GST on imports) | 1.1299 | |||||
Note: (a) State taxes subsumed in the GST are taken from the GST portal. Since the data presented in the portal does not include the subsumed state taxes for Gujarat, Haryana, and Arunachal Pradesh, the data is augmented to arrive at an all-inclusive collections figure (Row B).
(b) * The collection for FY23 have been extrapolated based on the average collections from May to Dec 2022.
Sources: Department of Revenue, Union budgets, MoSPI, PIB releases.
Centre on track to meet Non-Tax Revenue targets
3.14 The non-tax revenue to the Centre mainly includes interest receipts on loans to States and Union Territories, dividends and profits from Public Sector Enterprises and the Reserve Bank of India, and external grants and receipts for services the Union Government provides. Budget FY23 envisaged a lower collection of non-tax revenue receipts during the current year relative to FY22 (around 22.5 per cent lower than FY22 PA) (Table III.3). Of the budgeted amount, 73.5 per cent has been collected up to November 2022.
Table III.3: Trends in Non-tax Revenue of Union Government
|
FY18 |
FY19 | FY20 | FY21 | FY22 P | FY23 B | Apr-Nov 2022 | |
| ₹ lakh crore | |||||||
| Interest receipts | 0.14 | 0.12 | 0.12 | 0.17 | 0.22 | 0.18 | 0.17 |
| Dividends & Profits | 0.91 | 1.13 | 1.86 | 0.97 | 1.61 | 1.14 | 0.68 |
| External Grants | 0.04 | 0.01 | 0.00 | 0.02 | 0.01 | 0.01 | 0.01 |
| Others | 0.84 | 1.07 | 1.27 | 0.90 | 1.64 | 1.34 | 1.12 |
| Non-tax Revenue | 1.93 | 2.36 | 3.27 | 2.08 | 3.48 | 2.70 | 1.98 |
Source: Union Budget documents, O/o CGA
Committed towards disinvestment but dependent on external factors
3.15 Apart from the tax and non-tax revenue of the Union Government, non-debt capital receipts, which comprise recovery of loans and advances, and disinvestment receipts, have evolved as an important component of the non-debt receipts for the Union Government. During FY15 to FY23 (as of 18 January 2022), an amount of about ₹4.07 lakh crore has been realised as proceeds from disinvestment through 154 transactions using various modes/instruments. This includes ₹3.02 lakh crore realised from minority stake sale and ₹69,412 crore3 realised from strategic disinvestment transactions (in 10 CPSEs – HPCL, REC, DCIL, HSCC, NPCC. NEEPCO, THDC, Kamrajar Port, Air India and NINL).
3.16 The pandemic-induced uncertainty, the geopolitical conflict, and the associated risks have posed challenges before the plans and prospects of the government’s disinvestment transactions over the last three years. Nevertheless, the government has reaffirmed its commitment towards privatisation and strategic disinvestment of Public Sector Enterprises by implementing the New Public Sector Enterprise Policy and Asset Monetisation Strategy. Out of the budgeted amount of ₹65,000 crore for FY23, 48 per cent has been collected as of 18 January 2023.
Performance of Union Government Expenditure Pragmatic expenditure policy of re-prioritisation
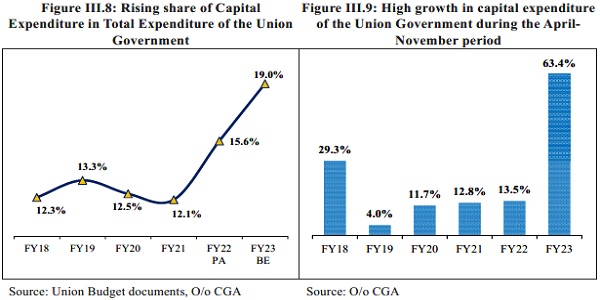
3.17 Last few years have underlined the importance of countercyclical fiscal policy measures to support the economy during a crisis. The pandemic mandated additional expenditure requirements during FY21. The total expenditure of the Union Government in FY21 rose to
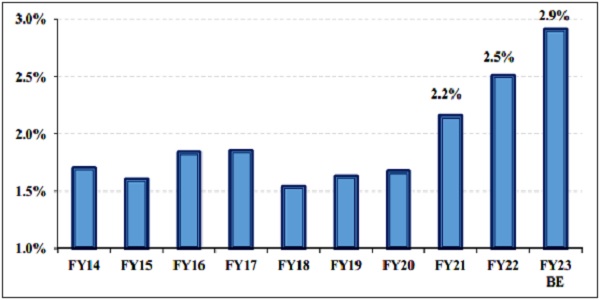
17.7 per cent of GDP, higher than the previous 5-year average of 12.8 per cent of GDP (Annexe 1: Table 2). The government adopted a pragmatic approach of increasing its expenditure in a calibrated way. Upon ensuring the basic safety nets for the vulnerable, the emphasis of the Government expenditure shifted to productive domestic capital expenditure. In the subsequent year, FY22, the total Union Government expenditure was brought down to 16 per cent of GDP (PA), and a more significant proportion of this accrued to capital expenditure (Figure III.8). The capital expenditure by the Centre has steadily increased from a long-term average of 1.7 per cent of GDP (FY09 to FY20) to 2.5 per cent of GDP in FY22 PA. It is further budgeted to increase to 2.9 per cent of GDP in FY23. (Figure III.7). This highlights an improvement in the quality of Government expenditure over the years.
Figure III.7: Increasing Union Government capital expenditure to GDP ratio
Source: Previous Economic Surveys, Union Budget documents, O/o CGA
Capex-led growth to bring back animal spirits and manage debt levels
3.18 In absolute terms, the Government of India had budgeted an unprecedented ₹7.5 lakh crore of Capital Expenditure for FY23, of which more than 59.6 per cent has been spent from April to November 2022. During this period, capital expenditure registered a YoY growth of over 60 per cent, much higher than the long-term average growth of 13.5 per cent recorded in the corresponding period from FY16 to FY20 (Figure III.9).
3.19 The Government’s thrust on Capital expenditure, particularly in the infrastructure-intensive sectors like roads and highways, railways, and housing and urban affairs, has longer-term implications for growth (Table III.4). While on the one hand, capital expenditure strengthens aggregate demand and crowds-in private spending in times of risk aversion; it also enhances the longer-term supply-side productive capacity. With early signs of a rebound in private sector investments in recent months, capital expenditure has played its role (details in chapter 1). To push for enhancing Capex from all directions, the Centre announced several incentives to boost states’ capital expenditure in the form of long-term interest-free loans and capex-linked additional borrowing provisions.
Table III.4: Centre’s Capital expenditure focussed on infra-related sectors
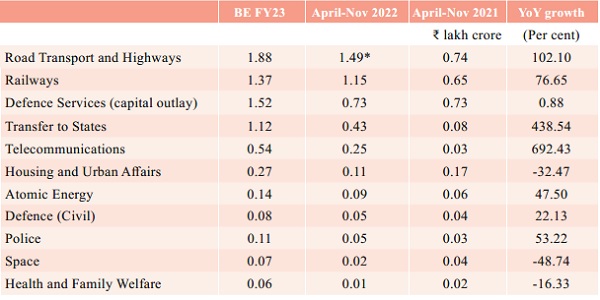
Note: * of which ₹1.44 lakh crore is on account of Inter Account Transfer to Reserve Funds from the Capital
Section.
Source: Union Budget documents, O/o CGA
Geopolitical developments stretched the Revenue Expenditure requirements
3.20 The significant components of the Centre’s revenue expenditure include Interest payments, major subsidies, salaries of Government employees, pensions, defence revenue expenditure, and transfers to States (Table III.5). A substantial portion of the Centre’s revenue expenditure is committed and allows limited flexibility in creating additional fiscal headroom if required. However, re-prioritising expenditure and rationalising subsidies are essential tools to stimulate aggregate demand and fulfil redistributive imperatives.
Table III.5: Major Items of Revenue Expenditure by Union Government
| Items | FY18 | FY19 | FY20 | FY21 | FY22 PA* | FY23 BE |
| (in ₹ Lakh crore) | ||||||
| Revenue Expenditure of which | 18.79 | 20.07 | 23.51 | 30.84 | 32.01 | 31.95 |
| a. Salaries (pay & allowances) | 1.94 | 2.11 | 2.28 | 3.34 | 3.67 | 4.10 |
| b. Pensions | 1.46 | 1.6 | 1.84 | 2.08 | 1.99 | 2.07 |
| c. Interest payment | 5.29 | 5.83 | 6.12 | 6.80 | 8.05 | 9.41 |
| d. Major subsidies | 1.91 | 1.97 | 2.28 | 7.08 | 4.46 | 3.18 |
| e. Defence Services | 1.86 | 1.96 | 2.08 | 2.06 | 2.29 | 2.33 |
Note: Salaries for FY22 are Revised estimates
Source: Union Budget documents, O/o CGA
3.21 With the winding up of the pandemic-related support, the revenue expenditure of the Union government was brought down from 15.6 per cent of GDP in the pandemic year FY21 to 13.5 per cent of GDP in FY22 PA (Annexe 1: Table 2). This contraction was led by a reduction of the subsidy expenditure as the economy recovered from the pandemic. The subsidy expenditure was brought down from 3.6 per cent of GDP in FY21 to 1.9 per cent of GDP in FY22 PA. It was further budgeted to reduce to 1.2 per cent of GDP in FY23.
3.22 Due to the sudden outbreak of geopolitical conflict resulting in higher international prices for food, fertiliser and fuel, there was a higher food and fertiliser subsidy requirement for supporting the people and ensuring macroeconomic stability. Around 94.7 per cent of the budgeted expenditure on subsidies has been utilised from April to November 2022. In the first batch of Supplementary Demands for Grants for FY23, the Union Government has sought an additional ₹80,000 crore for the expenditure towards food subsidy and additional allocation under Pradhan Mantri Garib Kalyan Anna Yojana (PMGKAY) and ₹1.09 lakh crore for fertiliser subsidy required during the year. As a result, the revenue expenditure from April to November 2022 has grown by over 10 per cent on a YoY basis, higher than the growth noted in the corresponding period last year (Table III.1).
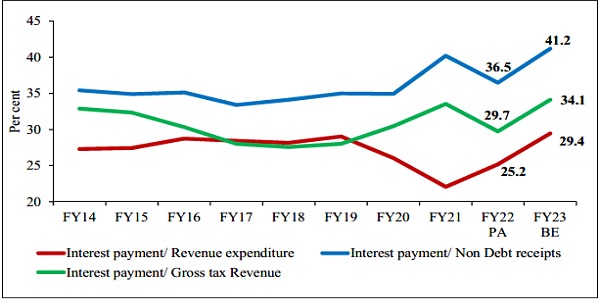
3.23 Another major component of revenue expenditure, interest payments, had maintained a stable ratio of non-debt receipts and revenue expenditure during the pre-pandemic years (Figure III.10). Higher resource requirements and lower revenue collections during the pandemic resulted in higher borrowings by the Union Government. Interest payments as a proportion of receipts went up after the pandemic outbreak. However, in the medium term, as we move along the fiscal glide path, buoyancy in revenues, aggressive asset monetisation, efficiency gains, and privatisation would help pay down the public debt, thus bringing down interest payments and releasing more monies for other priorities.
Figure III.10: High-interest payments as a per cent of receipts to be brought down through
varied initiatives for resource mobilisation
Source: Union Budget documents, O/o CGA
3.24 It is evident from this overview of the Union Government finances that the additional expenditure needs of the Centre arising during the current year are expected to be fulfilled by the more-than-anticipated revenue collections. Thus, it is expected that reaching the budget estimate for the fiscal deficit during FY23 will not be a concern for the Union Government. With resilient economic growth, continued revenue buoyancy, and careful expenditure management over the medium run, the Union Government will be on track with the fiscal path outlined by the Medium-Term Fiscal Policy Statement. Moreover, the budgetary reforms introduced by the Union Government in the last few years will support attaining the fiscal policy targets (Box III.2).
Box III.2: Major reforms in the Union budget over the last few years
|
A transparent, comprehensive and realistic budgetary process enables better fiscal management.4 This section discusses some of the major governance reforms introduced in the Union Budget over the last few years that have resulted in greater efficiency in public spending. 1. Improved fiscal transparency and realistic revenue assumptions in the Budget The Union Government has accorded the highest priority to improving transparency in its financial statements and accounts by bringing below-the-line expenditures above the line. The Extra-Budgetary borrowings of the Union Government were brought down from ₹1.48 lakh crore in FY20 and ₹1.21 lakh crore in FY21 to ₹750 crore in FY22 (RE). No Extra Budgetary Resources were estimated for FY23 in the Budget. In addition to cleaner fiscal accounting, Budget 2022 based its revenue projections on realistic assumptions, thus providing a buffer to the government in an uncertain global environment. These measures credibly demonstrate the government’s commitment to sound fiscal management and provide an adequate buffer to deal with global challenges. 2. Discontinuation of Plan-Non plan classification5 The Budget FY18 discontinued having Plan and Non-Plan classifications of Government expenditure. The reform gave a greater emphasis to the Revenue and Capital classification of Government expenditure. Over the years, a broad understanding had been that Plan expenditures were good and Non-Plan expenditures were bad, resulting in skewed allocations in the Budget. The reform enabled effective planning and allocation of resources in the Budget. 3. Merger of railway Budget with the Main Budget6 The railway budget was merged with the Union Budget from FY18. The reform gave a holistic picture of the government’s financial position. The initiative envisaged facilitating multimodal transport planning between highways, railways and inland waterways, which has been strengthened in the subsequent years through Gatishakti. The reform has helped to enhance the efficiency of resources for both Railways and the Union Government. While the merger has exempted Railways from paying dividends to the Government Revenues, it allows the Ministry of Finance to have a greater elbow room at the mid-year review for better allocation of resources. It has also enabled the Ministry of Finance to ensure a coherent emphasis on capital expenditure across sectors in recent years. 4. Shifting the date of the Budget to 1 February The date of the Budget was advanced to 1 February from the Budget FY18. The advancement of Budget presentation by a month has paved the way for early completion of the Budget cycle. It has also enabled the Ministries to ensure better planning and execution of schemes from the beginning of the financial year. |
Overview of State Government Finances
Performance of State finances
3.25 State Governments improved their finances in FY22 after being adversely impacted by the pandemic in FY21. The combined Gross Fiscal Deficit (GFD) of the States, which increased to 4.1 per cent of GDP in the pandemic-affected year, was brought down to 2.8 per cent in FY22 PA. Given the geopolitical uncertainties, the consolidated GFD-GDP ratio for States has been budgeted 3.4 per cent in FY23 (Figure III.11). However, the States’ monthly fiscal Accounts data released by O/o CAG shows that from April- November 2022, the combined borrowings of the 27 major states have just reached 33.5 per cent of their total budgeted borrowings for the year. (Figure III.12)
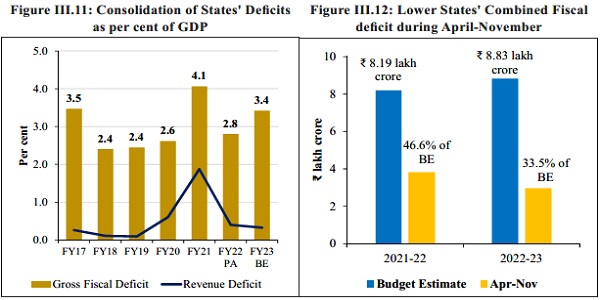
Source: RBI Study of State Budgets Jan 2023, O/o CAG
Note: Figure 12 includes data for 27 states
3.26 It is pertinent to note that states had unutilised borrowing limits during the last three years. Given the resource constraints of state governments, the Centre enhanced the net borrowing ceilings (NBC) for States to 5 per cent of GSDP in FY21, 4 per cent of GSDP in FY22, and 3.5 per cent of GSDP in FY23.
3.27 As per FY23 Budget Estimates of the State Governments, the States’ combined own Tax revenue and own Non-Tax revenue were anticipated to grow at 17.5 per cent and 25.6 per cent, respectively, over FY22 RE. This growth is a continuation of the buoyancy momentum observed in the FY22 RE. On the expenditure side, revenue and capital expenditures in FY22 BE were envisaged to grow at 10.4 per cent and 16 per cent, respectively, over FY22 RE. The RBI Study on State Finances highlights that the Capital outlay, a part of the capital expenditure, has recorded a higher growth in Provisional Actuals than that estimated in the Revised estimates. The capital outlay of States grew by 31.7 per cent in FY22 PA. This increase is attributable to strong revenue buoyancy and the support provided by the Centre in terms of advance releases of payments to the states, GST compensation payments, and interest-free loans. The Centre’s initiatives to support State finances are discussed in the forthcoming sections.
Cooperative fiscal federalism drives a well-targeted fiscal policy
Transfer from Centre to States
3.28 Transfer of funds to the States comprises the share of States in Union taxes devolved to the States, Finance Commission Grants, Centrally Sponsored Schemes (CSS), and other transfers. Total transfers to States have risen between FY19 and FY23 BE (refer to Table III.6).
Table III.6: Details of transfers from Centre to States (other than devolution to States)
|
FY19 |
FY20 | FY21 | FY22 RE | FY23 BE | |
| (in ₹ lakh crore) | |||||
| Centrally Sponsored Schemes | 3.0 | 3.1 | 3.8 | 4.2 | 4.4 |
| Finance Commission Grants | 0.9 | 1.2 | 1.8 | 2.1 | 1.9 |
| Other Grants/Loans/ Transfers | 0.9 | 2.0 | 1.9 | 2.3 | 3.0 |
Source: Union budget documents
3.29 The Finance Commission had recommended allocation of an amounting to ₹1.92 lakh crore for FY23 in respect of post-devolution revenue deficit grants, grants to local bodies, health sector grants, and disaster management grants under Article 275 of the Constitution. The details of the grants released during the current year may be seen in Table III.7 below.
Table III.7: Allocation of grants to the State Governments as recommended by the 15th FC
|
S/No. |
Components | AllocationFY23 | Amount released (as on 22 November 2022) |
| (in ₹ crore) | |||
| 1 | Post Devolution Revenue Deficit Grant | 86,201 | 57,467 |
| 2 | Disaster Management Grand (Union Share) | 23,294 | 10,976 |
| 3 | Local Bodies Grants | 69,421 | 28,609 |
| 4. | Health Sector Grants | 13,192 | 275 |
| Grand Total | 1,92,108 | 1,61,230 |
Source: Department of Expenditure
Supporting the GST compensation payments during crisis
3.30 Recognising the importance of a well-targeted fiscal policy by national and sub-national governments, the Union Government has taken consistent steps to support the state finances and incentivise States to move forward on the reforms agenda. To meet the shortfall in GST compensation for States, the Government, in addition to the release of regular GST compensation from the Fund, borrowed ₹ 2.69 lakh crore during FY21 and FY22 and passed it on to States on a back-to-back basis. Moreover, the cess payments and tax devolution instalments to the States were frontloaded to give them early access to funds. During FY23, the Government of India released ₹1.16 lakh crore towards the total GST compensation payable to States up to 30 June 2022 (as of 25 November 2022). Even though the total Cess collection until November 2022 was insufficient to make this entire payment to the States, the Centre released the balance from its resources. Box III.3 discusses the impact of GST on the flow of resources to the states.
Box III.3: GST and the flow of resources to states
The last five years of experience with GST have seen several rounds of policy debates around rate rationalisation, simplification of return filing, compensation cess levies on products, compensation payments to states etc. One pertinent question that has not been carefully studied is the impact of GST on the flow of resources to the states. While comparing the total fiscal resources accruing to States in the pre and post-GST regimes, it is essential to measure the relative performance of taxes vis-à-vis the performance of the economy. In the pre-GST regime, when the economy grew at 11.5 per cent nominally, the total fiscal resources accruing to States from the Central and state taxes subsumed in GST (including devolution) grew at 11.1 per cent. It implied a buoyancy of 0.97 (See table 3A).
Table 3A- Pre-GST period – Total fiscal resources to States from taxes subsumed in GST
(including devolution)
| FY13 | FY14 | FY15 | FY16 | FY17 | CAGR (FY17 over FY13) | |
| ₹ lakh crore | ||||||
| State taxes subsumed in GST | ||||||
| States taxes subsumed in GST | 3.22 | 3.48 | 3.73 | 4.41 | 4.41 | |
| Central taxes subsumed in GST | 1.66 | 1.90 | 2.02 | 2.48 | 3.14 | |
| Devolution factor | 0.32 | 0.32 | 0.32 | 0.42 | 0.42 | |
| Total fiscal resources to States from taxes subsumed in GST |
3.75 | 4.08 | 4.38 | 5.46 | 5.73 | 11.1% |
| Nominal GDP | 99.44 | 112.34 | 124.68 | 137.72 | 153.92 | 11.5% |
| Pre-GST buoyancy of revenue from taxes subsumed in GST accruing to states | 0.97 | |||||
In the post-GST period, total fiscal resources accruing to the states from the GST (including devolution from the Centre’s GST) exhibited a buoyancy greater than that in the pre-GST period (Table 3B). This performance is especially noteworthy, considering the reduction of the effective weighted average GST rate from 14.4 per cent at the time of inception to 11.6 per cent in 2019 (RBI).
Table 3B- Post-GST period – Total fiscal resources to states from the GST system (including devolution)
| FY19 | FY20 | FY21 | FY22 | FY23* | CAGR (FY23 over FY19) | |
| ₹ lakh crore | ||||||
| CGST collections | 2.02 | 2.27 | 2.10 | 2.69 | 3.14 | |
| SGST collections | 2.79 | 3.09 | 2.73 | 3.44 | 3.98 | |
| IGST collections | 5.99 | 5.87 | 5.66 | 7.62 | 9.40 | |
| GST compensation paid for the year | 0.85 | 1.66 | 1.68 | 0.69 | 0.35 | |
| Back-to-back loans | 1.10 | 1.59 |
–
| FY19 | FY20 | FY21 | FY22 | FY23* | CAGR (FY23 over FY19) | |
| Total fiscal resources to states from | the | GST system* | ||||
| (1) SGST + IGST for states + Devolution from Centre’s GST | 7.89 | 8.21 | 7.61 | 9.96 | 11.95 | 10.9% |
| (2) SGST + IGST for states + Devolution from Centre’s GST + Compensation | 8.74 | 9.87 | 9.29 | 10.65 | 12.30 | 8.9% |
| (3) SGST + IGST for states + Devolution from Centre’s GST + Compensation + loans | 8.74 | 9.87 | 10.39 | 12.24 | 12.30 | 8.9% |
| India Nominal GDP | 189.00 | 200.75 | 198.01 | 236.65 | 273.09 | 9.6% |
| Post-GST buoyancy of GST revenues accruing to states (excluding compensation /loans) | 1.13 |
Note: (a) The devolution factor is taken as 0.32 from FY13 to FY15; 0.42 from FY16 to FY20; and 0.41 from FY21 onwards, as per the recommendation of the respective Finance Commission.
(b) IGST for States is taken as 50% of total IGST collection. State’s share in Centre’s GST is arrived by multiplying the devolution factor with CGST and Centre’s IGST share.
(c) The collection for FY23 have been extrapolated based on the average collections from May to Dec 2022.
(d) The GST collections used are gross collections, including domestic supplies and import. However, with only the GST collections through domestic supplies, the post GST buoyancy is still greater than 1 (=1.05).
In addition to the regular stream of revenues from GST, a compensation was also provided to the states in the post-GST period. Since GST was a new tax regime, the compensation scheme was designed to safeguard the states for any difference in the new versus the old tax regime by ensuring steady revenue growth of 14 per cent per annum for five years. The compensation arrangement was also meant to help states ride out the differences in the inter-state distribution of GST. It is pertinent to note here that the compensation system was not envisaged as a buffer to the state’s revenues in the eventuality of a fall in tax revenues resulting from a collapse in economic growth.
Nevertheless, the incidence of the pandemic has highlighted the relevance of GST Compensation as a buffer to the States’ revenues. During FY21, revenues for Centre and states were adversely affected due to the economic contraction. The compensation requirement by the states increased substantially amidst a decline in the CGST and the compensation cess collections. Despite having limited fiscal resources in the middle of a crisis, the Centre borrowed funds and passed them on to States on a back-to-back loan basis, in addition to the release of regular GST compensation. These loans will be repaid from future inflows into the GST Compensation Cess Fund and hence are not a burden on the states.
Enhanced limit of borrowing for the States and incentives for reforms
3.31 Since the pandemic outbreak, the Centre has kept the Net borrowing Ceiling of the State Governments above the Fiscal Responsibility Legislation (FRL) threshold. It was fixed at 5 per cent of GSDP in FY21, 4 per cent of GSDP in FY22 and 3.5 per cent of GSDP in FY23. A part of this additional borrowing was linked to reforms encouraging the States to undertake them. For instance, in FY21, a part of the additional borrowing ceiling was conditional on implementing the ‘One Nation One Ration Card’ System, ease of doing business reform, urban Local body/ utility reforms, and power sector reforms. As a result, 17 States implemented the One Nation One Ration Card System, 20 States completed the stipulated reforms in the Ease of Doing Business, 11 States had done local body reforms and 17 States carried out fully/partly Power Sector Reforms. Similarly, a part of the additional borrowing was earmarked for incremental capital expenditure to be incurred by States during FY22. Sixteen states accessed the additional borrowings upon meeting the Capex target.
3.32 In addition to the net borrowing ceilings fixed for the States, Fifteenth Finance Commission had recommended performance-based additional borrowing space of 0.50 per cent of Gross State Domestic Product (GSDP) to the States in the power sector. This special dispensation has been recommended for each year for four years, from FY22 to 2024-25. For the financial year FY22, additional borrowing permission of ₹39,175 crore was allowed to 12 States for meeting the stipulated reform criteria.
Centre’s support towards States’ capital expenditure
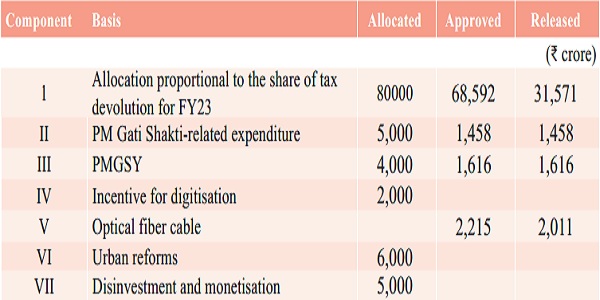
3.33 The Union government has provided 50-year interest-free loans to state governments under the ‘Scheme for Special Assistance to States for Capital Investment’ for the last three years. Amounts of ₹11,830 crore and ₹14,186 crore were provided to states in FY21 and FY22. A part of the allocation for FY22 was earmarked for providing incentives to the States for privatisation/disinvestment of the State Public Sector Enterprises (SPSEs) and monetisation/ recycling of assets. During the year FY23, the allocation under the Scheme has been raised to ₹1.05 lakh crore to give further impetus to State Capex plans. This amount includes an unconditional component and smaller components linked to specific reforms/initiatives (Table III.8). Notably, if state governments were allowed this ₹1 lakh crore as an additional borrowing limit, they would bear an interest rate higher than the rate at which the Union government borrows. Further, they may use it for revenue expenditure. This interest-free loan in the present arrangement is dedicated only to capital expenditure.
Table III.8: Details of Scheme for Special Assistance to States for Capital
Investment’ for FY23
Source: Department of Expenditure
|
Telangana and Kerala have revised the property taxes in their States during the year to support their revenues.7,8 Some states like Tamil Nadu, Andhra Pradesh, Telangana, Karnataka, Madhya Pradesh, Haryana, Kerala, Assam, and UT of Puducherry have considered revising their power tariffs during FY23. On the other hand, Uttar Pradesh has announced a new liquor policy whereby it increased the license fee, renewal fees, processing fee, and registration fee across various categories of liquor/ distilleries. In addition, many States have also made efforts towards privatising SPSEs and Monetising assets in FY21 & FY22 to receive additional incentives from the Union Government. These reforms will lead to unlocking the money trapped in unproductive assets and freeing it up for productive use. Some other revenue generating measures adopted by the States include Assam’s liquidation scheme for payment of arrears, Haryana’s one-time scheme for settlement of old VAT dues, and Assam and Kerala’s Green tax to discourage old vehicles. Sources: Newspaper reports, RBI |
Debt Profile of the Government
3.34 Given the unprecedented fiscal expansion in 2020, rising government liabilities have emerged as a significant concern across the globe. IMF projects9 the global government debt at 91 per cent of GDP in 2022, about 7.5 percentage points above the pre-pandemic levels. While countries worldwide had started winding up the fiscal support provided during the pandemic, challenging global financial conditions amidst global uncertainties tightened budget constraints.10 Some European economies are expanding their budgets to provide relief to households and small businesses from mounting energy bills (Figure III.13). All these factors, together with rising interest rates and the fear of slower growth, make the sustainability of sovereign debts a concern worldwide.
Figure III.13: Increase in primary balance as a per cent of GDP by some countries
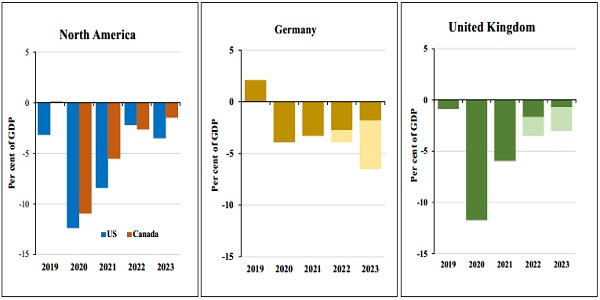
Source: IMF, Reserve bank of Australia
Note: Primary Balance as a per cent of GDP has been taken from IMF; The lighter bars denote the additional fiscal spending announced by the countries in recent months (excluding the revenue generated from windfall profit taxes). Moderating Union Government Debt after the spike during the pandemic year
3.35 It is crucial to analyse India’s government debt profile against this global backdrop. For India, the total liabilities of the Union Government, which were relatively stable as a percentage of GDP over the past decade, witnessed a sharp spike in the pandemic year FY21. This spike in debt resulted from the pandemic-induced higher Government borrowings to finance the additional expenditure needs, given the strained revenues and sharp contraction in the GDP. Total liabilities of the Union Government moderated from 59.2 per cent of GDP in FY21 to 56.7 per cent in FY22 (P) (Figure III.14). A brief description of the major components of the total liabilities of the Union Government is given in Table III.9.
Figure III.14: Moderating Union Government’s Debt-GDP ratio after the pandemic induced-spike
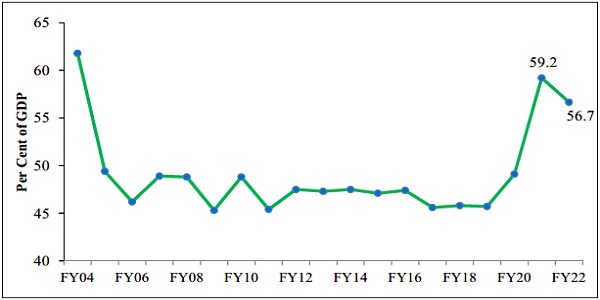
Source: Various Issues of Status Paper on Government Debt
Note: The Figures for FY22 are Provisional
Table III.9: Debt Position of Union Government (in ₹ lakh crore)
|
Components |
FY16 | FY17 | FY18 | FY19 | FY20 | FY21 | FY22 PA |
| 1 | 2 | 3 | 4 | 5 | 6 | 7 | |
| A. Public Debt (A1+A2) | 57.11 | 61.50 | 68.45 | 75.49 | 85.65 | 105.23 | 121.21 |
| A1. Internal Debt (a+b) | 53.05 | 57.42 | 64.01 | 70.75 | 80.20 | 99.08 | 114.62 |
| a. Marketable Securities | 47.28 | 50.49 | 55.10 | 59.69 | 65.60 | 78.59 | 88.17 |
| b. Non-marketable Securities | 5.77 | 6.93 | 8.91 | 11.06 | 14.60 | 20.49 | 26.45 |
| A2. External Debt | 4.07 | 4.08 | 4.45 | 4.74 | 5.44 | 6.15 | 6.59 |
| B. Public Account – Other Liabilities | 8.16 | 8.57 | 9.15 | 9.96 | 13.70 | 12.74 | 11.88 |
| C. Extra-Budgetary Resources (EBRs) | 0.09 | 0.24 | 0.99 | 1.12 | 1.39 | 1.39 | |
| D. Total Liabilities (A+B+C) | 65.27 | 70.16 | 77.85 | 86.35 | 99.91 | 116.98 | 134.08 |
Source: Union Budget and Finance Accounts (Various Issues); Provisional Accounts, CGA.
Note: Total Liabilities are net adjusted liabilities (Exclude NSSF investment in special securities of states and other public agencies, GoI Cash Balance and Pakistan pre-partition debt w.e.f. FY FY20)
Stable debt profile with relatively low currency and interest rate risk
3.36 India’s public debt profile is relatively stable and is characterised by low currency and interest rate risks. During his speech at the South Centre in Geneva (April 2018), former RBI Governor Dr YV Reddy said, ‘since most of India’s public debt is held by the residents and denominated in domestic currency. I would, therefore, be less dogmatic on the fiscal deficit and public debt numbers and more emphatic about the context.’ Of the Union Government’s total net liabilities in end-March 2021, 95.1 per cent were denominated in domestic currency, while sovereign external debt constituted 4.9 per cent, implying low currency risk (Figure III.15). Further, sovereign external debt is entirely from official sources, which insulates it from volatility in the international capital markets.
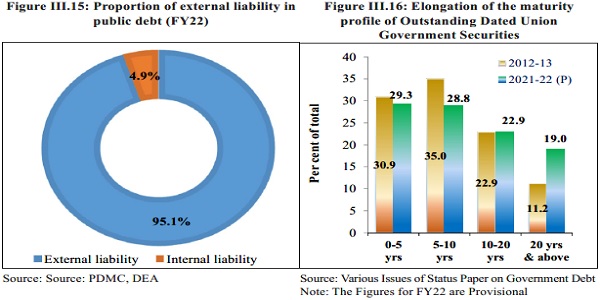
3.37. Public debt in India is primarily contracted at fixed interest rates, with floating internal debt constituting only 1.7 per cent of GDP in end-March 2021. The debt portfolio is, therefore, insulated from interest rate volatility, which also provides stability to interest payments. The weighted average maturity of the outstanding stock of dated securities of the government has increased from 9.7 years in end-March 2010 to 11.71 years in end-March 2022, thus reducing the rollover risk in the medium-term (Figure III.16). Over the last few years, the proportion of dated securities maturing in less than five years has declined, whereas long-term securities have shown an increasing trend.
Consolidating General government finances
3.38. The General Government finances give an overview of fiscal position of the Government sector as a whole. Figure III.17 shows the trends in General Government debt and deficits over the past few years. The General Government liabilities as a proportion of GDP increased steeply during FY21 on account of the additional borrowings made by Centre and States on account of the pandemic. However, the ratio has come off its peak in FY22 (RE). The General Government deficits as a per cent of GDP have also consolidated after their peak in F21. The General Government is expected to follow the path of fiscal consolidation in the medium term.
Figure III.17: General Government liabilities to GDP ratio come off their peak attained in FY21

Source: RBI
A positive growth-interest rate differential keeps the Government Debt sustainable
3.39. The emphasis on capex in recent years is expected to boost GDP growth directly, and indirectly through multiplier effects on private consumption expenditure and private investment. Higher GDP growth would thereby facilitate buoyant revenue collection in the medium term, and thereby enable a sustainable fiscal path. The General Government Debt to GDP ratio increased from 75.7 per cent of end-March 2020 to 89.6 per cent at the end of the pandemic year FY21. It is estimated to decline to 84.5 per cent of GDP by end-March 2022. The emphasis on capex-led growth will enable India to keep the growth-interest rate differential positive. As shown in Figure III.18 below, this differential has historically been positive for India. A positive growth-interest rate differential keeps the debt levels sustainable. Box III.5 shows that steady economic growth will accelerate fiscal consolidation in the economy.
Figure III.18: Growth-interest rate differential for India
Source: RBI, IMF
3.40. A comparison of the change in General Government debt to GDP ratio from 2005 to 2021 across the countries highlights a substantial increase for most countries. For India, this increase is modest, from 81 per cent of GDP in 2005 to around 84 per cent of GDP in 2021 (Figure III.19). It has been possible on the back of resilient economic growth during the last 15 years leading to a positive growth-interest rate differential, which, in turn, has resulted in sustainable Government debt to GDP levels.
Figure III.19: Comparing General Government debt to GDP ratio in 2005 with 2021
across the countries

Source: World Economic Outlook, October 2022.
Box III.5: Sustained growth as the path to fiscal consolidation
The high fiscal deficit to GDP ratio witnessed in the aftermath of the pandemic is a concern for countries worldwide. A solution to the increased fiscal deficit and debt-to-GDP ratios lies in persistently high growth for a few years. A simple counterfactual experiment shows that sustained growth of 10 per cent per annum would have resulted in much lower Union Government deficit and debt ratios for India in the post-pandemic years, despite keeping the expenditure levels the same.
Under Scenario 1, the impact of a higher nominal GDP growth is evaluated on fiscal deficit and debt ratios, keeping the revenues and expenditures the same as actual. A counterfactual nominal GDP is estimated, assuming a growth rate of 10 per cent each year from FY20 to FY22. The actual Central Government fiscal deficit as a per cent of the counterfactual GDP is estimated as 4.5 per cent in FY20, 8 per cent in FY21, and 6.3 per cent in FY22, lower than the actual ratios observed (see rows (A) and (E) of Table 5A). Similarly, the ratio of Central Government debt to the estimated GDP is also lower than the actual debt-GDP ratio (see rows (B) and (F) of Table 5A).
Table 5A: Counterfactual Experiment to show sustained growth results in
lower deficit and debt ratios
| FY19 | FY20 | FY21 | FY22 | Row | |
| Actual GDP (₹ lakh crore) | 189.0 | 200.7 | 198.0 | 236.6 | |
| Growth in actual GDP (%) | 6.2 | -1.4 | 19.5 | ||
| Assumed growth in GDP (%) | 10.0 | 10.0 | 10.0 | ||
| Estimated GDP (₹ lakh crore) | 207.9 | 228.7 | 251.6 | ||
| Scenario 1 | |||||
| Actual Fiscal Deficit/Estimated GDP (%) | 4.5 | 8.0 | 6.3 | (A) | |
| Actual Central Govt Debt/Estimated GDP (%) | 50.9 | 54.8 | 55.5 | (B) | |
| Scenario 2 | |||||
| Assumed revenue buoyancy | 0.8 | 1.6 | 1.6 | ||
| Estimated revenue collection (₹ lakh crore) | 18.1 | 21.0 | 24.3 | ||
| Estimated fiscal deficit (₹ lakh crore) | 8.8 | 14.1 | 13.7 | ||
| Estimated fiscal deficit/ Estimated GDP | 4.2 | 6.2 | 5.4 | (C) | |
| Scenario 3 | |||||
| Assumed revenue buoyancy | 0.8 | 0.9 | 1.6 | ||
| Estimated revenue collection (₹ lakh crore) | 18.1 | 19.6 | 22.7 | ||
| Estimated fiscal deficit (₹ lakh crore) | 8.8 | 15.5 | 15.2 | ||
| Estimated fiscal deficit/ Estimated GDP | 4.2 | 6.8 | 6.1 | (D) | |
| Memo items | |||||
| Actual Expenditure (₹ lakh crore) | 23.2 | 26.9 | 35.1 | 37.9 | |
| Actual Revenues (₹ lakh crore) | 16.7 | 17.5 | 16.9 | 22.1 | |
| Actual Fiscal deficit (₹ lakh crore) | 6.5 | 9.3 | 18.2 | 15.9 | |
| Actual Fiscal Deficit/Actual GDP (%) | 4.7 | 9.2 | 6.7 | (E) | |
| Actual Central Govt Debt/Actual GDP (%) | 52.7 | 63.3 | 59.0 | (F) | |
| Sources: Newspaper reports, RBI
However, higher GDP growth rate also impacts the fiscal deficit through higher revenues. Scenario 2 of the analysis incorporates the impact of higher GDP growth on the fiscal deficit to GDP ratio through the revenue channel. The expenditure levels were retained as actuals in the analysis. The actual revenue buoyancies for FY20 and FY22 and the budgeted revenue buoyancy for FY21 were considered to quantify the impact of higher GDP growth on revenues. The budgeted revenue buoyancy was taken for FY21 because the actual buoyancy ratio could not be interpreted in the year of nominal GDP contraction. The fiscal deficit was calculated using the estimated revenues and actual expenditures for respective years. The estimated fiscal deficit as a proportion of GDP came out to be 4.2 for FY20, 6.2 for FY21, and 5.4 for FY22, much lower than the actual observed (see rows (C) and (E) of Table 5A). Further, we see in scenario 3 that by taking the previous 5-year average revenue buoyancy for FY21 instead of the budgeted buoyancy and retaining actual revenue buoyancies for FY20 and FY22, the fiscal deficit to GDP ratio is still lower than the actual observed (see rows (D) and (E) of Table 5A). The messages from this counterfactual exercise are simple: even moderate growth, if sustained, will support fiscal consolidation in the medium run and result in sustainable public finances. Two, India’s public debt and deficit ratios went up sharply in recent years, not just on account of higher spending and lower tax revenues due to the pandemic but also due to the denominator undershooting trends resulting from financial system stress, followed by the pandemic. With both out of the way, nominal growth should return to its trend path, and hence, fiscal parameters would begin to show improvement. There is a need for continued vigilance and adherence to the path of fiscal prudence, but an undue alarm is unwarranted. |
|||||
Conclusion
3.41. The Government of India has adopted a holistic policy towards fiscal stability in the last few years. Using the crisis as an opportunity to bring about reforms, the government undertook a series of policy measures in the previous few years. These policies range from bringing in budget transparency and using prudent assumptions in the Budget to transforming the tax ecosystem by implementing technology, rationalising GST, reducing tax rates, simplifying tax compliances, and ending the uncertainty around retrospective taxation. All these measures have led to a greater formalisation of the economy, enhanced compliances and better reporting of the income by the public and imparted credibility to the government’s commitment to fiscal management.
3.42. The spike in India’s debt and deficit ratios has not only been due to higher spending necessitated by the pandemic-induced cessation of economic activity but also due to the contraction or slower growth in the denominator (nominal GDP). In FY20, India’s GDP growth slowed down due to the ongoing stress in the financial system. While the banking sector was undergoing repair and was recapitalising, the non-banking financial sector crisis renewed the uncertainties for the banking system. This kept credit growth muted, leading to slower GDP growth.11 The pandemic aggravated the situation in FY21, which caused the nominal GDP to contract, a rare occurrence in India. A detailed discussion may be seen in Chapter 2.
3.43. As India’s economic recovery advances, amidst the continuing global uncertainties and risks, the fiscal glide path illuminates the path for fiscal policy. That will ensure more significant fiscal space for policy action in uncertain times. Further, in reality, fiscal discipline translates into a fiscal stimulus for all sections of the economy through lower interest rates. As governments make their fiscal situations sustainable and stick to that path, the risk premium embedded in their interest rates comes down, thus lowering the cost of capital for all sections of society – on their educational loans, housing loans, car loans and business loans – and putting more money in their hands. For EMDE, the stimulus effect of fiscal deficit, via diminishing risk-premium, is likely greater than it is for advanced economies. That is the reality, as financial markets do not treat advanced and emerging economies similarly on fiscal deficits. Therefore, it stands to reason that they reap greater rewards for fiscal prudence. As stated earlier, this is particularly relevant in an era of rising interest rates.
3.44. The Centre should continue incentivising the States for reforms and higher capital spending to ensure a stronger General government. The capex-led growth strategy will ensure sustainable debt levels in the medium term.
ANNEXE
Annexe 1: Data on longer-term trends in Union government finances
Table 1: Union Government’s Fiscal Parameters
|
FY18 |
FY19 | FY20 | FY21 | FY22 PA | FY23 BE | |
| In ₹ lakh crore | ||||||
| Revenue Receipts | 14.35 | 15.53 | 16.84 | 16.34 | 21.68 | 22.04 |
| Gross Tax Revenue | 19.19 | 20.80 | 20.10 | 20.27 | 27.08 | 27.58 |
| Net tax revenue | 12.42 | 13.17 | 13.57 | 14.26 | 18.20 | 19.35 |
| Non-tax revenue | 1.93 | 2.36 | 3.27 | 2.08 | 3.48 | 2.70 |
| Non-debt capital receipts | 1.16 | 1.13 | 0.69 | 0.58 | 0.39 | 0.79 |
| Non-debt receipts | 15.51 | 16.66 | 17.53 | 16.92 | 22.08 | 22.84 |
| Total Expenditure | 21.42 | 23.15 | 26.86 | 35.10 | 37.94 | 39.45 |
| Revenue Expenditure | 18.79 | 20.07 | 23.51 | 30.84 | 32.01 | 31.95 |
| Capital Expenditure | 2.63 | 3.08 | 3.36 | 4.26 | 5.93 | 7.50 |
| Fiscal Deficit | 5.91 | 6.49 | 9.34 | 18.18 | 15.87 | 16.61 |
| Revenue Deficit | 4.44 | 4.54 | 6.67 | 14.50 | 10.33 | 9.90 |
| Primary Deficit | 0.62 | 0.67 | 3.22 | 11.38 | 7.81 | 7.21 |
| Memo Item | ||||||
| GDP at Market Price | 170.90 | 188.87 | 200.75 | 198.01 | 236.65 | 258.00 |
Source: Union Budget documents, O/o CGA
Table2: Union Government’s Fiscal Parameters (Per cent of GDP)
| FY18 | FY19 | FY20 | FY21 | FY22 PA | FY23 BE | |
| Revenue Receipts | 8.4 | 8.2 | 8.4 | 8.3 | 9.2 | 8.5 |
| Gross Tax Revenue | 11.2 | 11.0 | 10.0 | 10.2 | 11.4 | 10.7 |
| Net tax revenue | 7.3 | 7.0 | 6.8 | 7.2 | 7.7 | 7.5 |
| Non-tax revenue | 1.1 | 1.2 | 1.6 | 1.0 | 1.5 | 1.0 |
| Non-debt capital receipts | 0.7 | 0.6 | 0.3 | 0.3 | 0.2 | 0.3 |
| Non-debt receipts | 9.1 | 8.8 | 8.7 | 8.5 | 9.3 | 8.9 |
| Total Expenditure | 12.5 | 12.3 | 13.4 | 17.7 | 16.0 | 15.3 |
| Revenue Expenditure | 11.0 | 10.6 | 11.7 | 15.6 | 13.5 | 12.4 |
| Capital Expenditure | 1.5 | 1.6 | 1.7 | 2.2 | 2.5 | 2.9 |
| Fiscal Deficit | 3.5 | 3.4 | 4.7 | 9.2 | 6.7 | 6.4 |
| Revenue Deficit | 2.6 | 2.4 | 3.3 | 7.3 | 4.4 | 3.8 |
| Primary Deficit | 0.4 | 0.4 | 1.6 | 5.7 | 3.3 | 2.8 |
Source: Union Budget documents, O/o CGA
Table 3: Growth rate of Union Government’s Fiscal Indicators ( in per cent)
| FY18 | FY19 | FY20 | FY21 | FY22 PA | FY23 BE(1) | FY23 BE(2) | |
| Revenue Receipts | 4.4 | 8.2 | 8.4 | -3.0 | 32.7 | 6.0 | 1.7 |
| Gross Tax Revenue | 11.8 | 8.4 | -3.4 | 0.8 | 33.6 | 9.6 | 1.8 |
| Net tax revenue | 12.8 | 6.0 | 3.0 | 5.1 | 27.6 | 9.6 | 6.3 |
| Non-tax revenue | -29.4 | 22.3 | 38.8 | -36.5 | 67.6 | -14.1 | -22.5 |
| Non-debt capital receipts | 77.0 | -2.5 | -39.2 | -16.0 | -32.0 | -20.7 | 102.2 |
| Non-debt receipts | 7.7 | 7.4 | 5.2 | -3.5 | 30.5 | 4.8 | 3.4 |
| Total Expenditure | 8.4 | 8.1 | 16.0 | 30.7 | 8.1 | 4.6 | 4.0 |
| Revenue Expenditure | 11.1 | 6.8 | 17.1 | 31.2 | 3.8 | 0.9 | -0.2 |
| Capital Expenditure | -7.5 | 16.9 | 9.1 | 27.0 | 39.1 | 24.5 | 26.6 |
| Fiscal Deficit | 10.4 | 9.9 | 43.8 | 94.8 | -12.7 | 4.4 | 4.7 |
| Revenue Deficit | 40.2 | 2.5 | 46.7 | 117.5 | -28.7 | -9.0 | -4.1 |
| Primary Deficit | 13.1 | 7.5 | 381.6 | 254.0 | -31.4 | -7.3 | -7.8 |
Source: Union Budget documents, O/o CGA
Note: (1) Growth in FY23 BE over FY22 RE (2) Growth in FY23 BE over FY22 PA
Annexe 2: Indirect tax measures by CBIC during 2021-22
The reforms initiated by the government in recent years have ensured the development of a trust-based tax system. Progress has been made to move to an efficient and effective tax administration, which honours honest taxpayers and provides better taxpayer facilitation while advancing the government’s policy of facilitating Ease of Doing Business.
Ease of Compliance for Taxpayers
- A new scheme of updated return has been introduced in the Income-tax Act of 1961, which facilitates the taxpayer to voluntarily update his return anytime within two years from the end of the relevant assessment year by paying an additional tax. This scheme encourages voluntary compliance and reduces litigation.
- The scope of information in the pre-filled Income tax Returns (ITR) has been further expanded by including information such as house property income, capital gains from securities, bank interest, and dividends to make tax compliance more convenient.
- A new provision to effect business reorganisation has been made under the Income-tax Act, 1961, requiring the successor entity to file a modified return within six months of the order of the reorganisation being passed by the Competent Authority.
- The procedures for assessment, appeal and levy of penalty under the Income-tax Act have been made faceless by eliminating the human interface between the Assessing Officer and the assessee, optimising the use of resources through functional specialisation and streamlining the procedures to enable efficient implementation.
Reduction in Litigation
- A Dispute Resolution Committee is constituted to reduce litigation and give an impetus to dispute resolution for small taxpayers. A taxpayer having taxable income up to ₹50 lakh and disputed income up to ₹10 lakh shall be eligible to approach the Committee. The procedure of the Committee will be conducted electronically to ensure efficiency, transparency and accountability.
- Taking forward the policy of litigation management and to avoid repetitive appeals, a new provision has been made under the Income-tax Act, 1961, wherein if a question of law in the case of an assessee is identical to a question of law pending in appeal before the jurisdictional High Court or the Supreme Court in his case or any other case, the filing of further appeal to the Appellate Tribunal or the jurisdictional High Court in the case of the assessee shall be deferred till such question of law is decided by the relevant Court subject to certain conditions.
Measures undertaken to curb tax evasion & facilitate the widening of the tax base
- A formal mechanism of sharing information through the Annual Information Statement (AIS) and e-Verification scheme has recently been enabled. These measures further the aim of widening and deepening the tax base by ensuring authorities possess all relevant financial information of an assessee, thus allowing access to such information to a taxpayer for accurate filing of his return of income.
- The Finance Act 2022 has also introduced specific provisions for the taxation of virtual digital assets (VDA), where the transfer of VDA is to be taxed at the rate of 30% with no deduction in respect of expenditure (other than the cost of acquisition) to be allowed. Moreover, loss from the transfer of virtual digital assets cannot be set off from any other income and cannot be carried forward to subsequent years. Further, the transfer of VDA is subject to TDS of 1% of the transaction value (whether in cash/ kind/ both). The gift of VDA would also be taxed in the hands of the recipient.
- Deduction of tax at source on benefit or perquisite in respect of business or profession has also been introduced in Finance Act 2022 to widen and deepen the tax base. A person providing any benefit or perquisite to a resident would deduct TDS of 10% of the value or aggregate of the value of such benefit or perquisite (whether in cash/kind/ both).
- Finance Act 2022 has provided that no set off of any loss shall be allowed against undisclosed income detected during search and survey operations to bring certainty and increase deterrence among tax evaders.
- Vide Finance Act 2022, provisions applicable to bonus stripping have also been made applicable to securities. It has also been provided that the provisions on bonus stripping and dividend stripping shall also apply to units of an Infrastructure Investment Trust or a Real Estate Investment Trust, or units of Alternative Investment Funds.
Tax incentives
- Finance Act 2022 has provided income tax relief to the amount received by a taxpayer for medical treatment from an employer or from any person for treatment of Covid-19 during FY 2019-2020 and subsequent years. Income-tax relief has also been provided to ex-gratia payment received from the employer/ other person by family members of a person who has died on account of Covid-19 during FY 2019-2020 and subsequent years.
- Tax relief has also been widened to the persons with disability. The payment of annuity and lump sum amount from insurance scheme is to be allowed to differently abled dependent during the lifetime of parents/guardians, i.e., on parents/ guardian attaining the age of 60 years or more and where such contribution to the scheme has been discontinued.
- To bring parity between employees of State and Central government, the tax deduction limit on employer contribution has been increased from existing 10% to 14% of salary in NPS Tier-I Account for State Government employees as well. This would also help in enhancing social security benefits.
- To promote start-ups, the Income Tax Act of 1961 allows for a deduction of 100% of the profit and gains of eligible start-ups for three consecutive years out of ten years. However, due to Covid-19, there have been delays in setting up such eligible businesses. To lend a supporting hand to these start-ups, the period of incorporation of the eligible start-up has been extended to 31.03.2023 vide Finance Act 2022.
- To provide a level playing field between cooperative societies and companies, the alternate minimum tax rate paid by cooperatives has been reduced from 18.5% to 15%. Further, surcharge on cooperative societies has been reduced from 12% to 7% for those having total income of more than ₹1 crore and up to ₹10 crore.
- For concessional tax regime to establish a globally competitive environment, the date of commencement of manufacturing or production of an article or thing for a newly established manufacturing entity for availing 15% concessional tax rate under section 115BAB of the Income-tax Act, 1961 has been extended from 31st March 2023 to 31st March 2024.
- Over the past few years, several tax concessions have been provided to units located in International Financial Services Centre (IFSC) under the Income-tax Act, 1961, to make it a global hub of the financial services sector. To further incentivise operations from IFSC, the following have been made exempt from tax subject to specified conditions vide Finance Act, 2022:
i. Income of a non-resident from offshore derivative instruments
ii. Income from over-the-counter derivatives issued by an offshore banking unit
iii. Income from royalty and interest on account of the lease of a ship
iv. Income received from portfolio management services in IFSC
Annexe 3: Measures by CBIC undertaken during FY23
Reform Measures as regards Customs:
- The Customs duty rate structure has been guided by a conscious policy of the government to incentivise domestic value addition under Make in India and Aatmanirbhar Bharat initiative, which inter alia envisages imposition of lower duty on raw materials and providing reasonable tariff support to goods being manufactured in India. The customs duty structure has been calibrated to incentivise investment in key areas like petroleum exploration, electronic manufacturing, etc. In accordance with this policy, the MFN rates of BCD have been increased in recent years on such items which are being manufactured in India or which domestic industry aspires to manufacture. Accordingly, during the last 6 years, about 4000 tariff lines (approximately 1/3rd of total tariff lines) have seen upward calibration of BCD. Such items include, metals, metal products, auto parts, footwear, fabrics, garments, specified chemicals, toys, certain machinery, medical equipment, a number of MSME items like bells, gongs, ceramic wares, table ware, utensils, hardware etc, consumer electronics and home appliances including mobile, TV, refrigerators, washing machine, AC, fans, heaters, hair dryers, shavers, toasters, ovens etc. At the same time, duties of inputs and raw materials have been rationalised.
- Phased Manufacturing Plan (PMP) in respect of significant products like mobile phones, other electronic goods like TVs, electric vehicles, batteries, solar panel etc- The BCD rates in respect of different stages of the value chain of these products are calibrated in a manner that encourages gradual deepening of domestic value addition. For example, in respect of mobile phones, initially the parts were placed under nil BCD while duty was imposed on mobiles. Gradually, duty has been raised on parts in phased manner as their production began in India.
- India stands fully compliant with all the commitments under WTO’s Trade Facilitation Agreement. Compliance has been achieved well within the stipulated timeline of February 2022 and the same stands duly notified and acknowledged by the World Trade Organisation. The heartening results achieved can be evidenced from the significant improvements in the standings in the United Nation’s Global Survey on Digital and Sustainable Trade Facilitation, wherein, India has witnessed a sustained improvement in the Trade Facilitation score to 90.32% in 2021 from 78.49% in 2019. India is the best performing country when compared with South and South West Asia (63.12%) region.
- With the objective to enhance the uniformity in the physical examination process of EXIM cargo and reduce the time and cost involved in the process, CBIC has introduced Risk Management based uniform cargo examination orders at all Customs locations across the country, vide Circular No. 16/2022-Customs dated 29th of August, 2022.
- Continuing with the trend to implement measures to facilitate taxpayers, CBIC has notified the Customs (Electronic Cash Ledger), Regulations, 2022 dated 30.03.2022 to enable the importer, exporter or any person liable to pay Customs duty, fees etc., to deposit an advance with the government instead of making transaction wise payment as was being done earlier. Such deposit can be utilised for payment of duties and other sums relating to Customs by seamlessly debiting the requisite amount from the ECL. Additionally, CBIC has launched an Anonymised Escalation Mechanism for handling the grievances related to delay in clearances. In the above mechanism, CBIC’s ICEGATE registered users can submit their grievance for delayed clearances under faceless assessment and escalate it anonymously to the concerned assessing as well as the higher officers at relevant FAG Port (Faceless Assessment Group). The Anonymized Escalation facility also enables users to track the status of the grievances submitted by them till the final resolution.
- With an objective to utilise technology to optimise internal processes, CBIC has launched a pilot project for implementation of Electronic Cargo Tracking System (ECTS) on 14.10.2021, based on blockchain technology for tracking movement of goods from the port to a warehouse at ICD Tughlakabad ensuring secured documentation & GPS based tracking of containers.
- Indian Customs has notified IGCRS Rules, 2022 vide Notification 74/2022 dated 9th September, 2022 superseding the existing Customs (Import of Goods at Concessional Rate of Duty) Rules, 2017. These rules have come into effect from 10th September 2022. These rules have introduced significant changes for simplifying and automating the procedures for import of goods at concessional Rate of Duty in accordance with the larger goals of “Ease of doing business” by accommodating long standing demands from the trade such as inclusion of job work, clearance of capital goods at depreciated value, making the entire process simple and online and doing away with any need for physical interface with officers.
Changes in Customs Law and Procedure:
- As a trade facilitation measure, the validity of e-scrips issued under the Electronic Duty Credit Ledger Regulations, 2021, has been increased from one year to two years from the date of their generation. Further, the recovery provisions from the transferee holder of the e-scrips (issued under RoDTEP and RoSCTL schemes) and suspension of its credit account have also been omitted.
- In order to leverage the vast network of post offices across the country and enable MSME’s (Micro Small and Medium Enterprises) to export to global markets using e-commerce or other regular channels, the CBIC in collaboration with the Department of Posts (Dop) has notified the Postal Exports (Electronic Declaration and processing) Regulations, 2022. Under the new system, an exporter need not visit a Foreign post Office (FPO) to file the Postal Bill of Export (PBE) and present export parcel. Rather, he is enabled to file the PBE online from his home/office and handover the export parcel to postal authorities at a nearby booking post office. Postal authorities shall arrange secure transport of export parcel from booking post office to an FPO, where customs clearance shall take place.
- Circular No.8/2022-Customs dated 17.5.2022 has been issued to enable exports from Bangladesh to India by rail in closed containers, with clearance at hinterland ICDs. A transshipment module has also been developed in the Indian Customs EDI system to digitise the procedure. This would decongest the border trade points and facilitate Bangladesh’s exports.
- Vide Circular No. 17/2022-Customs dated 9.9.2022, CBIC has enabled export of containerised cargo from any inland Container Depot (ICD) to Bangladesh using a combination of rail/ road route and riverine route. For instance, the containerised cargo after customs clearance at an ICD shall be transported to Kolkata/Haldia port by rail or road, from where it shall be loaded on a barge for export to Bangladesh using riverine route. Customs clearance shall take place at the ICD and only preventive checks are conducted at Kolkata/Haldia. This facility is expected to help reduce congestion of export cargo at land Customs Stations.
- With a view to leveraging the potential of inland Waterways for enhancing trade and transit, CBIC has allowed movement of containerised export goods of Bangladesh through India using a combination of riverine and rail routes. This facility, allowed Vide Circular No. 19/2022-Customs dated 14.9.2022, involves entry of containerised cargo on a barge/vessel from Bangladesh into India up to the sea port of Kolkata or Haldia using the riverine route. From the sea port of Kolkata or Haldia, the goods will travel by rail to the sea port of Nhava Sheva or Mundra for final export to third countries by sea route. The Circular lays down detailed procedure and documentation and provides for track and trace facility using ECTS (Electronics Cargo Tracking System). This arrangement is expected to save time and cost for the traders by providing an alternate and more efficient trade route.
- Vide Circular No. 09/2022-Customs dated 30.6.2022, CBIC has put in place a simplified regulatory framework for e-commerce exports of jewellery via international Courier Terminals (ICTs). To accommodate the e-commerce business need, it incorporates a re-import process for return of jewellery. For this purpose, the Courier import and export (Electronic Declaration and Processing) Regulations, 2010 have been amended vide Notification No. 57/2022-Customs (N.T) dated 30.6.2022. The simplified framework is applicable on e-commerce export of jewellery made of precious metals (whether or not studded or set with precious or semi-precious stones). This reform is aimed at supporting the Make-in-India brand in the international markets and enhancing the competitiveness of Indian jewellery exports leveraging the rapidly evolving global e-Market space.
Changes in Excise Duty:
- Retail selling prices of petrol and diesel in the country are linked to crude prices. The crude prices have been varying for the past few months. Indian basket is moving upwards and reached beyond $110 per barrel in May, 2022. The Dollar exchange rate was also on the upward trend and is hovering around ₹77 per USD, impacting the prices of Petrol and Diesel. The Retail selling price of petrol and diesel have risen from ₹95.41 per litre and ₹86.67 per litre respectively in March 2022 to ₹105.41 per litre and ₹96.67 per litre respectively on 21 May, 2022. This has necessitated a reduction in Excise Duty on petrol and diesel. Extensive deliberations were held at various stakeholders including Ministry of Petroleum and Natural Gas and it was decided to rationalise Central Excise duty rates on Petrol and Diesel by ₹8 per litre on Petrol and ₹6 per litre on Diesel. The proposed reductions has been given effect to by reducing the Road and Infrastructure Cess (RIC).
Changes in GST (Rates):
- In 2022, the following changes were made to GST rates on goods and services:
- In the 47th GST Council meeting, it was decided to increase the GST rates on items such as Printing, writing or drawing ink, Power driven pumps primarily designed for handling water such as centrifugal pumps, Pawan Chakki, Drawing and marking out instruments, Solar Water Heater and system etc to correct inverted duty structure in these items. Similarly, GST rates on certain services such as Services supplied by foreman to chit fund, Job work in relation to processing of hides, skins and leather, Job work in relation to manufacture of leather goods and footwear etc were also calibrated to correct inverted duty structure.
- Hitherto, GST was exempted on specified food items, grains etc when not branded, or right on the brand has been foregone. In the 47th GST Council Meeting, it has been decided to revise the scope of exemption to exclude from it prepackaged and pre-labelled retail pack in terms of Legal Metrology Act, including pre-packed, pre-labelled curd, lassi and butter milk.
- With an objective to rationalise GST exemptions, the 47th GST Council Meeting recommended to withdraw GST exemption on items such as Cheques, lose or in book form, Maps and hydrographic or similar charts of all kinds, including atlases, wall maps, topographical plans and globes, printed. On similar lines, exemption in form of a concessional rate of GST is being rationalised on items such as Petroleum/ Coal bed methane, Scientific and technical instruments supplied to public funded research institutes, E-waste.
Changes in GST Law and Procedure:
- The following measures were undertaken for trade facilitation and ease of doing business under GST in 2022-23:
Measures intended to facilitate trade:
- Retrospective amendment made in section 50 of CGST Act with effect from 01.7.2017 to provide the interest is required to be paid on the wrongly availed ITC only when the same has been availed as well as utilised. Also, rate of interest on wrongly availed and utilised ITC reduced to 18% from 24% with retrospective effect from 01.7.2017.
- Vide Notification No. 14/2022-Central Tax dated 5.7.2022, UPI & IMPS have been provided as an additional mode for payment of GST to facilitate taxpayers and to further encourage digital payment by amending Rule 87(3) of CGST Rules. This will provide them flexibility and case in making their GST payment.
- Transfer of CGST/IGST cash ledger balance has been allowed between ‘distinct persons’ (entities having same PAN but registered in different states). Facility has been provided for withdrawal of refund applications made under GST by the taxpayers.
- Facility has been provided for withdrawal of refund applications made under GST by the taxpayers.
- In GST, a mechanism has been prescribed for refund of accumulated ITC on export of electricity.
- Procedure of sanction of IGST Refund in case of export of goods, where the exporters have been identified as risky, has been streamlined, to expedite verification and processing of such claims.
Measures intended to improve ease of doing business:
- Threshold for mandatory issuance of e-invoice has been reduced to ₹10 crore from 01.10.2022.
- To facilitate small taxpayers in making supply of goods through e-commerce operators (ECO), and to provide parity in intra-state offline and online supply of goods, in-principle decision has been taken for waiver of requirement of mandatory registration under GST for intra-state supply of goods through ECO’s Composition taxpayers would also be allowed to make intra-State supply through ECOs subject to certain conditions. This will open the huge e-commerce market for the small taxpayers to sell their goods without getting mandatory registration which will boost small business. These changes would be notified in due course of time, as it would require amendment in GST provision, as per recommendations of GST Council, and technical change on portal and also by ECOs.
Notes:-
1 ‘Ruchir Sharma’s investor guide to 2023: from peak dollar to better TV’, Financial Times, 6th January 2023 (https://www.ft.com/con-tent/3e040c2c-f7e4-4121-9dfe-7ba5732707f7)
2 PMEAC Report- ‘GST-Connecting the remaining dots’, June 2022
3 This amount does not include Rs. 12,100 cr received as Enterprise Value for NINL transaction as Government of India didn’t have any direct equity in this Joint Venture of Central and State PSEs.
4Section 3- Budget preparation – Guidelines for Public Expenditure Management (IMF, 1999)-https://www.imf.org/external/pubs/ft/expend/ guide3.htm
5https://pib.gov.in/newsite/PrintRelease.aspx?relid=136996
6https://pib.gov.in/newsite/PrintRelease.aspx?relid=153672
7https://rbidocs.rbi.org.in/rdocs/Publications/PDFs/RMF101120223A34C4F7023A4A9E99CB7F7FEF6881D0.PDF
8https://www.panchayat.gov.in/documents/448457/0/Assess+the+Availability+of+Resources+for+Creating+the+Assets+and+Initiatives+tak-en+for+Generating+Various+OSR+%281%29.pdf/b4a01029-d4f5-ab38-becb-b650b269f338?t=1669965866134
9IMF fiscal Monitor (Oct 2022)
10Global Financial Stability Report (Oct 2022)
11IMF Working paper (WP/22/137)- Financial Sector and Economic Growth in India by Margaux MacDonald ; TengTeng Xu (July 2022) – (https://www.imf.org/en/Publications/WP/Issues/2022/07/08/Financial-Sector-and-Economic-Growth-in-India-520580 )


