The year 2022 marked the return of high inflation, especially in advanced economies, after nearly four decades. Inflation did not spare emerging economies either. These developments led to an unprecedented, synchronous, and sharp cycle of monetary tightening across countries. Major central banks have implemented sharp increases in policy rates, with the Federal Reserve’s rate hikes being the steepest since the 1970s. While the Federal Reserve has raised policy rates by 425 basis points (bps), the European Central Bank (ECB) and the Bank of England (BoE) have implemented 300 bps and 250 bps rate increases, respectively. The RBI initiated its monetary tightening cycle in April 2022 and has since implemented a policy repo rate hike of 225 bps. Consequently, domestic financial conditions began to tighten, which was reflected in the lower growth of monetary aggregates.
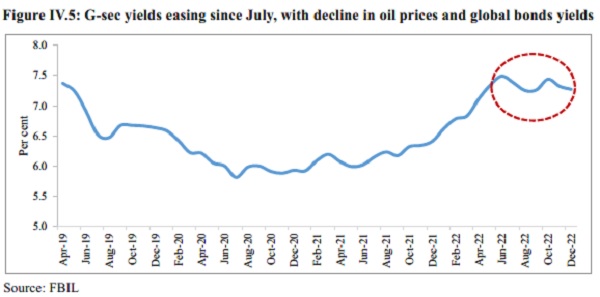
The change in RBI’s policy stance in FY23 led to a moderation of surplus liquidity conditions that prevailed during the pandemic years. Monetary policy transmission is well underway as lending and deposit rates increased following the hike in policy rates. In the government securities (G-sec) market, bond yields were on an upward trajectory until June 2022 on concerns of high inflation and policy rate hikes. These yields moderated in November and December 2022, aided by lower crude oil prices, a slower pace of rate hikes, and general moderation in global sovereign bond yields.
While the global tightening cycle has contributed to a dampened global outlook, the domestic appetite for credit has been on an upswing. Non-food credit offtake by scheduled Commercial Banks (SCBs) has been growing in double digits since April 2022, with the increase being broad-based. Credit disbursed by Non-Banking Financial Companies (NBFCs) has also been on the rise. The balance sheet clean-up exercise has been vital in enhancing the lending ability of financial institutions. The Gross Non-Performing Assets (GNPA) ratio of SCBs has fallen to a seven-year low of 5.0, while the Capital-to-Risk Weighted Assets Ratio (CRAR) remains healthy at 16.0 and well above the regulatory requirement of 11.5. The health of NBFCs has continued to improve as well. The recovery rate for the SCBs through Insolvency and Bankruptcy Code (IBC) was highest in FY22 compared to other channels.
Political and economic developments in 2022 – the breakout of a conflict in Europe, high inflation and raising interest rates – meant that capital markets around the world were characterised by increased volatility. However, domestic capital markets displayed some encouraging trends. The primary equity markets witnessed participation from all segments, especially with increased Small and Medium Enterprises (SMEs) contributions
Monetary Management And Financial Inter Mediation: A Good Year 79
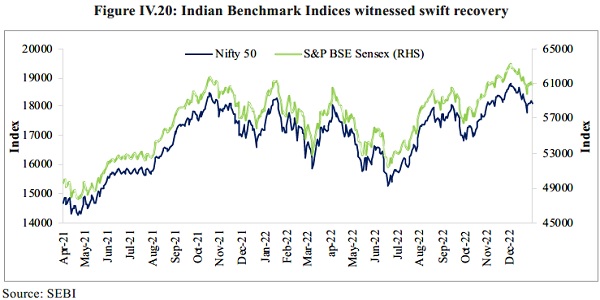
while primary private debt markets saw a growth in placements and resource mobilisation. While secondary capital market indices of the Nifty 50 and the S&P BSE Sensex were not immune to the volatility in Foreign Portfolio Investment (FPI) flows, they performed better than their peers between April and December 2022. Furthermore, net FPI flows turned positive in the quarter ending December 2022. The indices have displayed a decreasing trend in volatility as measured by the India Volatility Index (VIX) over this period. Both developments underscore India’s strong macroeconomic fundamentals and relatively buoyant demand outlook.
The increasing outreach of the banking sector and capital markets is reflected in the insurance and pension sectors. Insurance penetration in India has been steadily increasing, with life insurance penetration being above the emerging markets and global averages. Important government interventions and a conducive regulatory environment have supported the growth of the insurance market, which has seen increasing partnerships, product innovations, and vibrant distribution channels. India is poised to emerge as one of the fastest-growing insurance markets in the coming decade. The pension sector too has been taking rapid strides since the introduction of the National Pension Scheme (NPS), more recently, the Atal Pension Yojana (APY). The sector has witnessed a robust increase in the number of subscribers and assets under management (AuM). The expansion of the sector has been aided by government measures such as relaxation in CCS (Pension) Rules, integration of electronic Pension Payment Order (e-PPO) with DigiLocker, and relaxation in the timeline for submitting Digital Life Certificate.
As global central banks reaffirm their hawkish stances and telegraph ‘higher-for-longer’ policy rates in their battle against inflation, monetary conditions are expected to remain tight worldwide. Domestically, however, RBI’s support to growth will ensure adequate liquidity in financial markets. The growth in credit offtake is expected to sustain, and combined with a pick-up in private Capex, will usher in a virtuous investment cycle. The credit upcycle will also be aided by constant monitoring of the risks in the financial system by the regulators and their efforts to contain them. Strong macroeconomic fundamentals will underpin the return of global capital flows to India once the fog of uncertainty lifts. The financial system will play a key role in realising the objectives of Amrit Kaal.
Monetary developments
4.1 Inflationary pressures dominated the global economic landscape in FY23. The build-up of price pressures occurring in tandem with the economic recovery in FY22 from the pandemic was long viewed as transient. It was expected to abate as supply chains normalised. The debate on said transience was put to rest by the conflict that erupted in Europe in February 2022. It resulted in commodity prices soaring and added significantly to the prevailing inflationary pressures. This development has triggered the current sharp and synchronous monetary tightening cycle. Setting the context, this chapter will review India’s monetary developments and the performance of the financial system in the current financial year. It includes reviewing the monetary policy actions and their impact on system liquidity and evaluating the performance of the banking system, sectoral credit developments and various insolvency frameworks. Further, it looks into the capital market, insurance and pension sector developments.
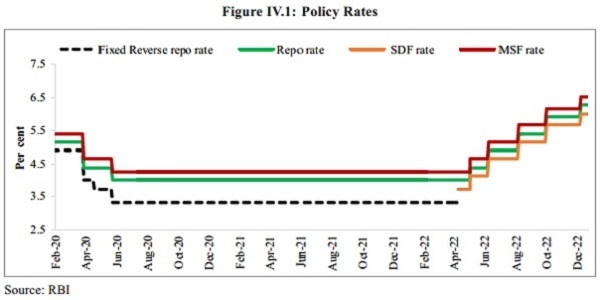
4.2 The Monetary Policy Committee (MPC) maintained a status quo on the policy repo rate between May 2020 and February 2022 after implementing a 115 basis points (bps) reduction between March 2020 and May 2020. Retail inflation has crossed the upper limit of RBI’s tolerance band since January 2022. Sensing a serious risk to price stability, RBI initiated the monetary tightening cycle. In its April 2022 meeting, the committee introduced the Standing Deposit Facility (SDF), which allowed for the deposit of excess funds by banks with the RBI without the necessity of collateral in the form of government securities, thereby allowing effective liquidity management in a collateral-free manner. Here, it is worth mentioning that while the SDF window is available for overnight deposits, the Reserve Bank retains the flexibility to absorb surplus liquidity of longer tenors under the window, if necessary, with appropriate pricing. The SDF, introduced at a rate of 3.75 per cent, replaced the reverse repo rate as the new floor of the Liquidity Adjustment Facility (LAF) corridor. The MPC also indicated a change in stance from ‘Accommodative’ to ‘Accommodative and focused on the withdrawal of accommodation, while supporting growth’ in this meeting, signalling the start of the monetary tightening cycle.
4.3 Recognising the sizeable upside risk imparted by adverse global developments, such as the generalised hardening of commodity prices and an increased likelihood of prolonged supply chain disruptions, the MPC convened an off-cycle meeting in May 2022. Members unanimously voted for an increase of 40 bps each in the policy repo rate, the SDF and the Marginal Standing Facility (MSF), and a 50 bps increase in the Cash Reserve Ratio (CRR). Between May 2022 and December 2022 and over five meetings, the MPC implemented a cumulative hike of 225 bps each in the policy repo rate, the SDF, the MSF and the bank rate. In the initial phases of the tightening cycle, the committee noted that commodity price-driven inflationary pressures, increased volatility and initial signs of a slowdown in output characterised the global outlook. In its latest meeting of December 5-7 2022, the MPC hiked the policy repo rate by 35 bps, and reiterated its focus on withdrawal of accommodation to ensure that inflation remains within the target going forward, while supporting growth.
4.4 Reserve money (M0) increased by 10.3 per cent year-on-year (YoY) as on 30th December 2022 compared to 13 per cent last year. However, reserve money adjusted for the first-round impact of changes in the Cash Reserve Ratio (CRR) recorded a YoY growth of 7.8 per cent compared to 9.1 per cent a year ago. On the component side, growth in Currency in Circulation (CIC) broadly remained stable at levels seen after Covid-19, barring a marginal increase in the immediate aftermath of the outbreak of the Russia-Ukraine conflict, which can be attributed to a rise in precautionary holdings. So far, expansion in M0 during FY23 was mainly driven by bankers’ deposits with the RBI, with an increase in the CRR.
Table IV.1: YoY Growth in monetary aggregates (in per cent)
| Item | FY17^ | FY18 | FY19 | FY20 | FY21 | FY22 | FY23* |
| 1. Reserve Money (M0) | -12.9 | 27.3 | 14.5 | 9.4 | 18.8 | 13.0 | 10.3 |
| 1.a. Currency in Circulation (CiC) | -19.7 | 37.0 | 16.8 | 14.5 | 16.6 | 9.8 | 8.2 |
| 1.b. Bankers’ Deposits with the RBI |
8.4 | 3.9 | 6.4 | -9.6 | 28.5 | 25.4 | 17.6 |
| 2. Narrow Money (M1) | -3.9 | 21.8 | 13.6 | 11.2 | 16.2 | 10.7 | 7.6 |
| 3. Broad Money (M3) | 6.9 | 9.2 | 10.5 | 8.9 | 12.2 | 8.8 | 8.7 |
| 3.a. Currency with the Public | -20.8 | 39.2 | 16.6 | 14.5 | 17.1 | 10.3 | 8.4 |
| 3.b. Aggregate Deposits | 6.9 | 5.8 | 9.6 | 8.0 | 11.3 | 8.4 | 9.2 |
| Demand Deposits | 18.4 | 6.2 | 9.6 | 6.8 | 14.8 | 10.9 | 6.2 |
| Time Deposits | 10.2 | 5.8 | 9.6 | 8.1 | 10.9 | 8.1 | 9.1 |
Source: RBI.
Note: ^: March 31, 2017 over April 1, 2016, barring M0, CiC and Bankers’ Deposits with the RBI.
*: Data for FY23 is as on December 30, 2022
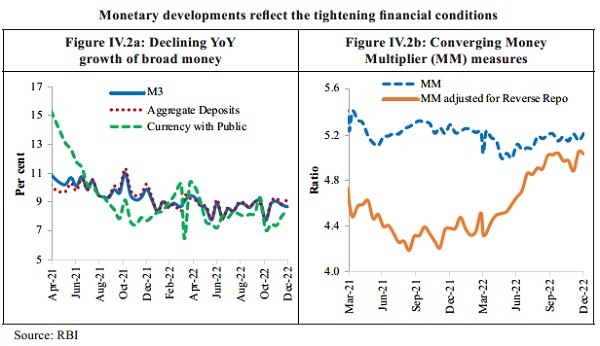
4.5 As on 30th December 2022, broad money stock (M3) increased by 8.7 per cent YoY. From the component side, aggregate deposits have been the largest component and contributed most to the expansion of M3 during the year so far. Amongst sources, bank credit to the commercial sector drove the expansion of broad money, and net bank credit to the government supplemented this expansion. Of significance is the increase in the share of bank credit to the commercial sector in M3 to 64.3 per cent as on 30th December 2022 from 61.1 per cent in the corresponding period of the previous year, reflecting the upswing in the credit disbursal by commercial banks.
4.6 The money multiplier – the ratio of M3 and M0 – has broadly remained stable at an average of 5.1 over April – December 2022 period compared to 5.2 in the corresponding period of the previous year. However, M0 adjusted for reverse repo, which is analytically akin to banks’ deposits with the RBI, was much higher until April 2022. Hence, the adjusted money multiplier was lower at 4.3 at the beginning of FY23. M0 adjusted for the reverse repo is now much closer to M0; hence, as on 30 December 2022, the money multiplier and adjusted money multiplier stood at 5.21 and 5.03, respectively.
Liquidity Conditions
4.7 Surplus liquidity conditions that prevailed post-Covid-19 in response to the Reserve Bank’s conventional and unconventional monetary measures moderated during FY23 in consonance with the changed monetary policy stance that focused on the withdrawal of accommodation. With the MSF rate retained at 25 bps above the policy repo rate, the LAF corridor became symmetric around the policy repo rate – the corridor width was thus restored to 50 bps, the position that prevailed before the pandemic. The RBI’s move to hike the CRR by 50 bps resulted in a withdrawal of primary liquidity to the tune of ₹87,000 crore from the banking system.
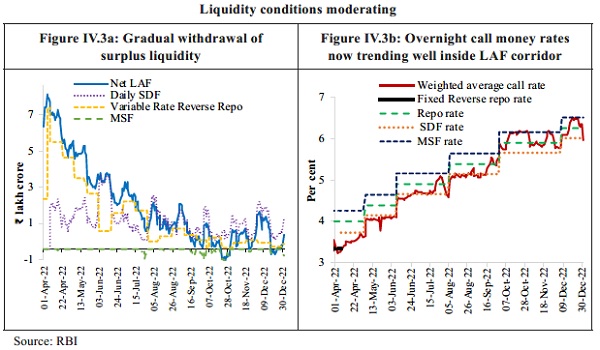
4.8 The daily net liquidity absorption averaged ₹2.5 lakh crore during FY23 (up to 21 December 2022) as compared with ₹6.7 lakh crore in FY22. The Reserve Bank remained nimble and agile in liquidity management by conducting two-way operations. It injected liquidity to assuage transient liquidity tightness through two variable rate repo (VRR) auctions of ₹50,000 crore each of 3 days and overnight maturity on 26th July and 22nd September 2022, respectively. The gradual withdrawal of surplus liquidity pushed the weighted average call rate (WACR) – the operating target of monetary policy – closer to the policy repo rate, on an average basis. The WACR traded 6 bps above the policy repo rate, on an average, during H2 (up to 21 December 2022) compared to 28 bps below it during H1. Interest rates on various money market rates – 91-day Treasury Bills (T-Bills), 3-month certificates of deposit and commercial papers – gradually firmed up in line with the increase in the repo rate.
Monetary Policy Transmission
4.9 Lending and deposit rates of banks increased during FY23 in consonance with the policy repo rate changes. During FY23 (up to December 2022), external benchmark-based lending rate and 1-year median marginal cost of funds-based lending rate (MCLR) increased by 225 bps and 115 bps, respectively. Overall, the weighted average lending rate (WALR) on fresh and outstanding rupee loans rose by 135 bps and 71 bps, respectively, in FY23 (up to November 2022). On the deposit side, the weighted average domestic term deposit rate (WADTDR) on outstanding deposits increased by 59 bps in FY23 (up to November 2022).
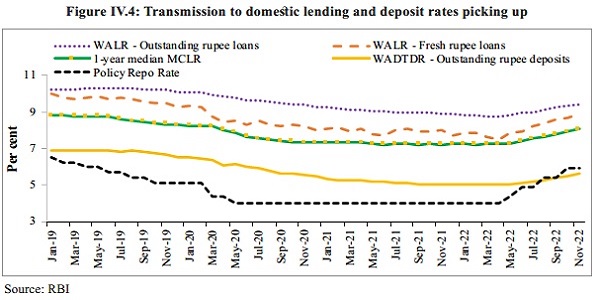
4.10 An analysis of transmission across bank groups during FY23 (up to November 2022) indicates that the increase in the WALRs on fresh loans was higher in the case of public sector banks, while that of the WADTDR on outstanding deposits and WALR on outstanding loans was higher for private banks.
Table IV.2: Transmission to lending and deposit rates across bank groups
| Variation in bps | February 2019 – March 2022 | April to November 2022 | ||||
| WALR – Outstanding Rupee Loans |
WALR – Fresh Rupee Loans | WADTDR – Outstanding Deposits |
WALR – Outstanding Rupee Loans |
WALR – Fresh Rupee Loans | WADTDR – Outstanding Deposits |
|
| PSBs | -153 | -252 | -169 | 59 | 149 | 51 |
| PVBs | -141 | -188 | -211 | 82 | 101 | 59 |
| SCBs# | -150 | -232 | -188 | 71 | 135 | 59 |
| ^: March 31, 2017 over April 1, 2016, barring M0, CiC and Bankers’ Deposits with the RBI. *: Data for FY23 is as on December 30, 2022 | ||||||
Source: RBI
Note: WALR: Weighted Average Lending Rate; WADTDR: Weighted Average Domestic Term Deposit Rate.
MCLR: Marginal Cost of funds-based Lending Rate;
# SCBs include public, private and foreign banks.
PSBs: Public Sector Banks
PVBs: Private Banks
Developments in the G-sec Market
4.11 After remaining steady through 2020 and 2021, the yield on the 10-year government bond rose in 2022. The weighted average yield spike reflects the domestic bond market volatility stemming from uncertainty in crude prices, a hawkish stance of major central banks, a hardening of global bond yield and the pressure on the rupee. The monthly average yield on the 10-year government bond stood at 7.3 per cent in December 2022 after having peaked at 7.5 per cent in June 2022. Yields moderated in November and December 2022 following smaller rate hikes by major central banks and declining inflation. With the softening of yields, volatility also declined in the second half of 2022.
Figure IV.5: G-sec yields easing since July, with decline in oil prices and global bonds yields
4.12 The trading volume in G-Secs (including T-Bills and SDLs) reached a two-year high of ₹27.7 lakh crore during Q2 FY23, registering a YoY growth of 6.3 per cent. The higher trading volume reflects the growing interest of market players/ traders in the government security market.
4.13 Private Sector Banks emerged as the dominant trading segment in the secondary market during the quarter under review, with a share of 25.0 per cent in “Buy” deals and 24.8 per cent in “Sell” deals in the total outright trading activity, followed by foreign banks, public sector banks, primary dealers and mutual fund. On a net basis, foreign banks and primary dealers were net sellers. In contrast, public sector banks, cooperative banks, financial institutions, insurance companies, mutual funds, private sector banks and ‘others’ were net buyers in the secondary market.
Table IV.3: Category-wise Share (Per cent) of Total Outright Trading Activity in G-Secs*
| Category | July – Sept 2021 | Apr-Jun 2022 | July-Sept 2022 | |||
| Buy | Sell | Buy | Sell | Buy | Sell | |
| Private Sector Banks | 25.6 | 28.4 | 24.3 | 23.8 | 25 | 24.9 |
| Foreign Banks | 18.6 | 19.3 | 20.5 | 22.7 | 21.7 | 22.1 |
| Public Sector Banks | 16.6 | 15.6 | 17.3 | 16.4 | 15.7 | 14 |
| Primary Dealers | 12.3 | 17.7 | 13.9 | 20.3 | 13.9 | 19.5 |
| Mutual Funds | 14.8 | 10.1 | 12.7 | 8.5 | 11.2 | 8.9 |
| Others | 5.1 | 3.6 | 4.1 | 3.3 | 5.3 | 5 |
| Co-operative Banks | 2.9 | 2.9 | 3.1 | 2.8 | 3.5 | 3.3 |
| Insurance Companies | 3.2 | 2.1 | 3.4 | 2.2 | 3.1 | 2.4 |
| Financial Institutions | 1 | 0.4 | 0.6 | 0 | 0.5 | 0 |
| Total | 100 | 100 | 100 | 100 | 100 | 100 |
Source: Dept. of Economic Affairs, Ministry of Finance
Note: *: Includes T-Bills and SDLs.
Banking Sector
Resilient and well-capitalised Banking System
4.14 Since the middle of the previous decade, RBI and the government have made dedicated efforts in terms of calibrated policy measures like strengthening the regulatory and supervisory framework, implementation of 4R’s approach of Recognition, Resolution, Recapitalisation and Reforms to clean and strengthen the balance sheet of the banking system. These continuous efforts over the years have culminated in the enhancement of risk absorption capacity and a healthier banking system balance sheet both in terms of asset quantity and quality over the years.
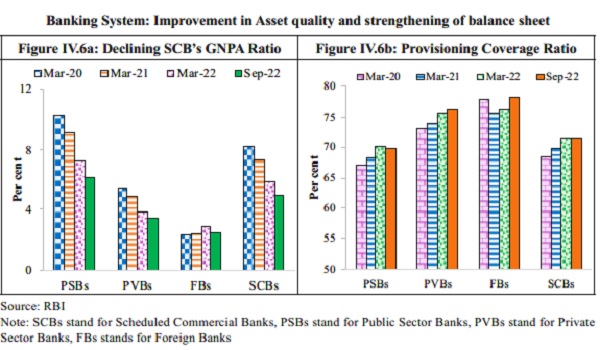
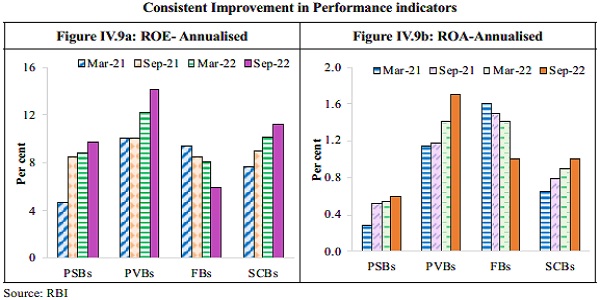
Note: SCBs stand for Scheduled Commercial Banks, PSBs stand for Public Sector Banks, PVBs stand for Private
Sector Banks, FBs stands for Foreign Banks
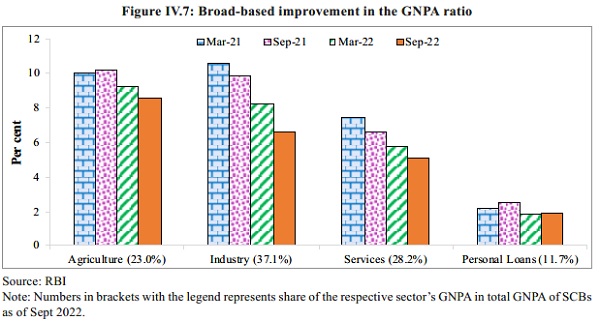
4.15 Consequently, the asset quality of SCBs has been improving steadily over the years across all major sectors. The GNPA ratio has decreased from 8.2 per cent in March 2020 to a seven-year low of 5.0 per cent in September 2022, while Net Non-Performing Assets (NNPA) have dropped to a ten-year low of 1.3 per cent of total assets. Lower slippages and the reduction in outstanding GNPAs through recoveries, upgrades and write-offs led to this decrease. Lower GNPAs, combined with high provisions accumulated in recent years, contributed to a decline in NNPA. There was a broad-based improvement in the GNPA ratio in the industrial sector, though it remained elevated for gems and jewellery and construction sub-sectors. Going ahead, as per the baseline scenario of the RBI’s stress testing framework, the declining tendency in the GNPA ratio is likely to continue and is projected to drop further to 4.9 per cent in March 2023.
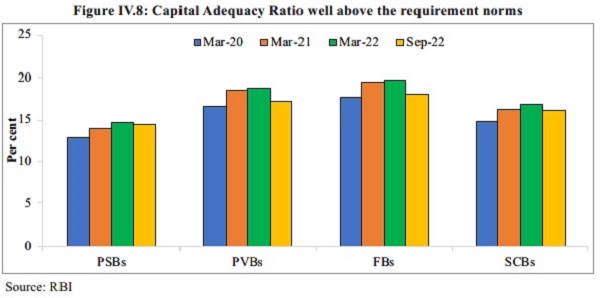
4.16 Moreover, with shrinking GNPAs, the Provisioning Coverage Ratio (PCR) has been increasing steadily since March 2021 and reached 71.6 per cent in September 2022. The CRAR of SCBs has been rising sequentially in the post-asset quality review period. With a pickup in lending activity during H1:FY23, CRAR moderated in September 2022 because of an increase in risk-weighted assets (RWAs). However, it remains well above the minimum capital requirement, including Capital Conservation Buffer (CCB) requirements of 11.5 per cent.
4.17 During the first half of FY23, the profitability of SCBs, measured in terms of Return on Equity (ROE) and Return on Assets (ROA), improved to levels last observed in FY15. At the system level, Profit After Tax (PAT) witnessed a double-digit growth of 40.7 per cent in the quarter ending September 2022, led by strong growth in Net Interest Income (NII) and a significant lowering of provisions. Macro-stress tests conducted by RBI for credit risk reveal that SCBs are well-capitalised and that all banks would be able to comply with the minimum capital requirements even under adverse stress scenarios.
Credit Growth Aided by a Sound Banking System and Deleveraged Corporate Sector
4.18 The recovery in economic activity in FY22, along with the enhanced financial soundness of banks and corporates, has bolstered the expansion of non-food bank credit since June 2021. The YoY growth in non-food bank credit accelerated to 15.3 per cent in December 2022. This not only shows an acceleration in the growth of current economic activities but also an anticipation of continued momentum in economic activity in future.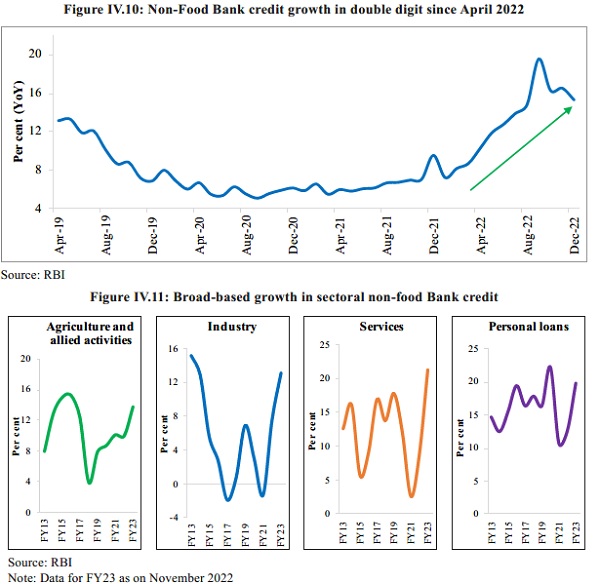
4.19 Credit growth has been broad-based across sectors, with retail credit driving the growth primarily owing to rising demand for home loans. An increase in demand for housing induces greater investment which, in turn, sets off a virtuous cycle of growth and investment. Credit to agriculture and allied activities gained momentum supported by the Government’s concessional institutional credit and higher agricultural credit target. Industrial credit growth has been buoyed by a pick-up in credit to MSMEs, assisted by the benefits accrued from the effective implementation of the Emergency Credit Line Guarantee Scheme (ECLGS) and the support provided by the government’s production-linked incentive scheme and improvement in capacity utilisation. Credit growth in services was driven by a recovery in credit to NBFCs, commercial real estate and trade sectors.
4.20 With moderation in overseas issuances and lower investments by Private Equity (PE)/ Venture Capital (VC), the financing needs of the corporate sector are being met through domestic resources. As funds raised from the primary segment of domestic equity markets declined during FY23, reliance on bank credit for funding regular operations and capacity expansion increased. Also, the Incremental Credit-Deposit ratio rose sharply both on an annual (122.0 per cent, YoY) and half-yearly basis (172.5 per cent; September 2022 over March 2022). The accumulation of deposits in the past few years has enabled banks to fund the growing credit demand. Here, the well-capitalised banking system with a low NPA ratio and more robust corporate sector fundamentals will continue to enhance the flow of bank credit into productive investment opportunities, notwithstanding the rising interest rates.
Non-Banking Financial Companies (NBFCs) Continue to Recover
4.21 The growing importance of the NBFC sector in the Indian financial system is reflected in the consistent rise of NBFCs’ credit as a proportion to GDP as well as in relation to credit extended by SCBs. Supported by various policy initiatives, NBFCs could absorb the shocks of the pandemic. They built up financial soundness during FY22, marked by balance sheet consolidation, improvement in asset quality, augmented capital buffers and profitability.
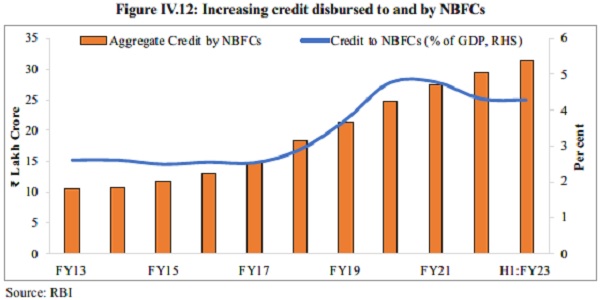
Note: Credit to NBFCs (per cent of GDP) for FY23 (H1) is estimated based on NSO’s 1st AE for FY23 and credit by NBFCs as of September 2022.
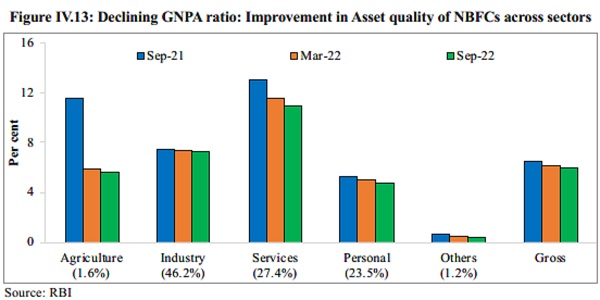
4.22 The continuous improvement in asset quality is seen in the declining GNPA ratio of NBFCs from the peak of 7.2 per cent recorded during the second wave of the pandemic (June 2021) to 5.9 per cent in September 2022, reaching close to the pre-pandemic level. Although this softening was observed across sectors, the GNPA ratio of the services sector remains in double digits.
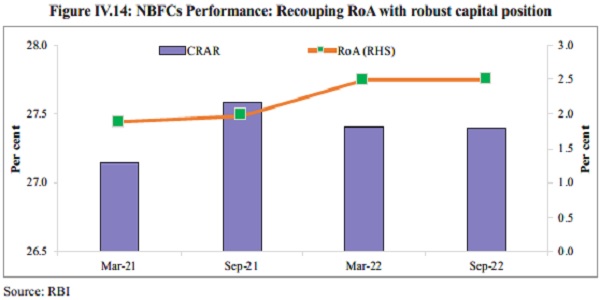
4.23 With the decline in GNPAs, the capital position of NBFCs also remains robust, with a CRAR of 27.4 per cent in end-September 2022, slightly lower than 27.6 per cent in March 2022. However, it remains well above the regulatory requirement. The decline of 20 bps was mainly because of an increase in RWA as lending picked up. The RoA has recouped over successive half-years. RBI’s stress test to assess the resilience of the NBFC sector to credit risk shocks for a sample of 152 NBFCs reveals that the number of NBFCs that would fail to meet the minimum regulatory capital requirement of 15 per cent stood at 8 per cent under the baseline scenario. It increases to 10 per cent and 13 per cent under medium and severe stress scenarios, respectively.
4.24 Credit extended by NBFCs is picking up momentum, with the aggregate outstanding amount at ₹31.5 lakh crore as of September 2022. NBFCs continued to deploy the largest quantum of credit from their balance sheets to the industrial sector, followed by retail, services, and agriculture. Loans to the services sector (share in outstanding credit being 14.7 per cent) and personal loans (share of 29.5 per cent) registered a robust double-digit growth.
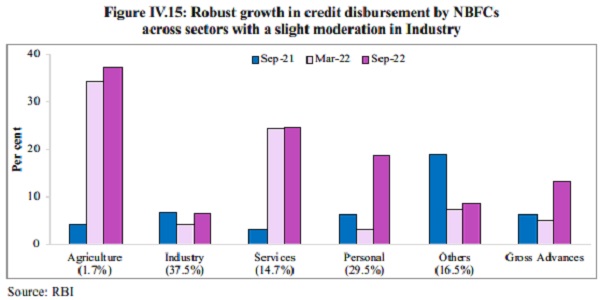
Note: Numbers in the bracket corresponds to sectoral shares in outstanding loans in Sep-22
Progress made under the Insolvency and Bankruptcy Code
Ease of doing business: Facilitating the process of ‘exit’
4.25 The Insolvency and Bankruptcy Code (IBC) has facilitated the exit of distressed firms, thereby allocating scarce economic resources towards more productive use. Since the inception of the IBC in December 2016, 5,893 Corporate Insolvency Resolution Processes (CIRPs) had commenced by end-September 2022, of which 67 per cent have been closed. Of these, around 21 per cent were closed on appeal or review or settled, 19 per cent were withdrawn, 46 per cent ended in orders for liquidation, and 14 per cent culminated in the approval of resolution plans. The Code also provides for a Corporate Debtor (CD) to voluntarily liquidate itself subject to the fulfilment of certain conditions as prescribed under the Code. 1,351 corporate persons initiated voluntary liquidation under the Code as of end-September 2022.

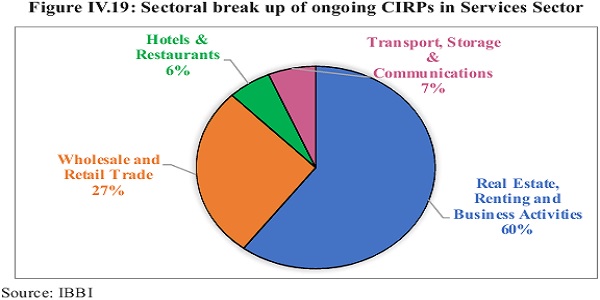
4.26 Sectoral analysis reveals that 52 per cent of the ongoing CIRPs belong to industry, followed by 37 per cent in the services sector by September 2022. Further, within the industry, 74 per cent of the initiated CIRPs was from the manufacturing sector. Of these, the textile, basic metals and food sectors accounted for 48 per cent of the ongoing CIRPs. While in the services sector, 60 per cent of the ongoing CIRPs belongs to real estate, renting and business activities.
60 per cent of the ongoing CIRPs belongs to real estate, renting and business activities. Figure IV.17: Sector-wise status of CIRPs (as on September 2022)


Behavioural change: Recoding Business Relationships
4.27 One of the far-reaching spill-over effects of the Code has been the behavioural change effectuated by it among debtors. The fear of losing control over the CD upon initiation of CIRP has nudged thousands of debtors to settle their dues even before the initiation of insolvency proceedings. Until September 30 2022, 23,417 applications for initiation of CIRPs of CDs having underlying default of ₹7.3 lakh crore were disposed of before their admission into CIRP.
69 per cent of the distressed assets rescued, realisation value around 178 per cent of the liquidation value
4.28 Until September 30, 2022, 553 CIRPs have ended in resolution. Despite the very low value of the distressed firms to begin with, 69 per cent of distressed assets were rescued by the Code. Overall, in terms of value realisation for initiators of CIRPs (which includes Financial Creditors, Operational Creditors and Corporate Debtors), the resolution plans realised ₹2.4 lakh crore, which is 177.6 per cent of the liquidation value and 841 per cent of the fair value of the 553 CDs rescued. Moreover, realisation by financial creditors under resolution plans in comparison to liquidation value was 201 per cent, while the realisation by them was 33 per cent of their claims.
92 per cent of the value realised under the liquidation Process
4.29 1807 CDs ended up with orders for liquidation as of September 2022. These CDs assets were valued at less than 8 per cent of the aggregate claim amount on the ground. However, more than 76 per cent of the CIRPs ending in liquidation (1349 out of 1774 for which data are available) were earlier with the Board for Industrial and Financial Reconstruction (BIFR) and/ or are defunct. The economic value of most of the corporate debtors that ended in liquidation had almost completely eroded even before they were admitted into CIRP. 429 CDs have been completely liquidated. The Code has facilitated the realisation of 92 per cent of the value through the liquidation of these companies.
Table IV.4: Rescue of distressed assets as on 30th September (Amount in ₹ crore)
| Rescue of Distressed Assets | Companies Rescued by resolution |
Companies Ordered for Liquidation |
Total |
| No. of Companies | 553 | 1807 | 2360 |
| Aggregate Claims | 7,90,626 | 8,28,180 | 16,18,806 |
| Liquidation Value | 1,37,119 | 60,143 | 1,97,261 |
| Assets available as % of Aggregate Claims | 17.3 | 7.3 | 12.19 |
| Resolution Value | 2,43,452 | NA | 2,43,452 |
| Resolution Value as % of Liquidation Value | 177.6 | NA | NA |
| Resolution Value as % of Aggregate Claims | 30.8 | NA | NA |
| Average time taken | 561 days | 437 days | NA |
| Cost % of Resolution Value | 0.6 | NA | NA |
Source: IBBI
NPAs: IBC recovers highest amount for Scheduled Commercial Banks
4.30 As per the RBI data, in FY 22, the total amount recovered by SCBs under IBC has been the highest compared to other channels such as Lok Adalat’s, SARFAESI Act and DRTs in this period.
4.31 In a public auction-based resolution model2 such as the IBC, the extent of the haircut represents the discount the market demands for acquiring the stressed entity as a going concern. Since significant value destruction may have already happened in these assets, a comparison of realised value with admitted claims may not be a reasonable indicator of the effectiveness of the resolution process. Further, the rate of recovery is contingent on several factors, including the overall macroeconomic environment, perceived growth prospects of the entity and its sector, and the extent of erosion in the intrinsic value of the entity. As a broad-based recovery gains traction, these factors are likely to turn favourable for financial resolution3.
Table IV.5: Amount recovered by SCBs through various channels (Amount in ₹ crore)
| Recovery Channel |
Amount recovered during the year* | ||||
| 2017-18 | 2018-19 | 2019-20 | 2020-21 | 2021-22(P) | |
| Lok Adalats | 1,811 | 2,750 | 4,211 | 1,119 | 2,777 |
| DRTs | 7,235 | 10,552 | 9,986 | 8,113 | 12,114 |
| SARFAESI Act | 26,380 | 38,905 | 34,283 | 27,686 | 27,349 |
| IBC | 4,926 | 66,440 | 1,04,117 | 27,311 | 47,421 |
| Total | 40,352 | 1,18,647 | 1,52,597 | 64,229 | 89,661 |
| Source: Off-site returns, RBI and IBBI
Note: P: Provisional, DRTs stand for Debt Recovery Tribunals *: Refers to the amount recovered during the given year, which could be with reference to the cases referred during the given year as well as during the earlier years. |
|||||
Development in Capital Markets
4.31 Global macroeconomic uncertainty, unprecedented inflation, monetary policy tightening, volatile markets, etc., resulted in hurting investor sentiments, leading to a downbeat performance of global capital markets in FY23. Though global macroeconomic and financial market developments exercised some influence on Indian capital markets, India’s capital market had a good year, overall.
Primary Market
Equity: Large number of SMEs coming out with the public offer
4.32 From April to November 2022, the buoyant performance of the primary market has been observed despite turmoil in global financial markets. Compared to FY22, the number of firms opting to list on the bourses increased by 37 per cent, though the amount raised declined to almost half of what was raised in the last year.
4.33 Although the year so far has been lacklustre in terms of fund mobilisation through IPOs, the number of SMEs coming out with public offer has been quite encouraging. Compared to FY22 (until November 2021), this year, not only did the number of SMEs coming with IPOs almost double, but the total funds raised by them were almost three times the funds raised by them in the same period last year.
4.34 Further, this year also witnessed the largest IPO ever in the history of India. In May 2022, the Central Government diluted its stake in the Life Insurance Corporation (LIC) of India and listed it on the stock exchanges, thereby making LIC’s IPO the largest IPO ever in India and the sixth biggest IPO globally of 2022. Listing of LIC accounted for more than a third of resources mobilised in the primary equity market until November 2022.
Debt: Underactivity in public debt issuances more than compensated by private debt placements
4.35 In April-November 2022, the amount of resources mobilised by the issuance of debt securities in the primary market increased by 5 per cent, compared to the corresponding period last year. The total number of issues in the same period also increased by 11 per cent. From April to November 2022, public issues of debt increased by 10 per cent compared to the same period the year before, but the amount raised by public issues of debt in the same period decreased by 27 per cent. However, the underactivity in public debt issuances was more than compensated by private debt placements. The number of private debt placements increased by 11 per cent from 851 to 945, while resources mobilised increased by 6 per cent in April-November 2022, compared to the corresponding period in the year before.
Table IV.6: Resource Mobilisation from the Primary Market
| Particulars | April – Nov 2021 | April – Nov 2022 | ||
| No. of Issues |
Amount (₹ crore) |
No. of Issues |
Amount (₹ crore) |
|
| A. Equity | 350 | 1,81,532 | 448 | 1,14,361 |
| IPOs | 76 | 89,166 | 104 | 48,095 |
| FPOs | 0 | 0 | 1 | 4,300 |
| Rights Issues | 18 | 22,659 | 37 | 3,436 |
| QIPs | 23 | 26,704 | 8 | 4,115 |
| Preferential Allotments | 233 | 43,004 | 298 | 54,414 |
| B. Debt | 871 | 3,71,590 | 967 | 3,91,997 |
| Public | 20 | 9,132 | 22 | 6,624 |
| Private Placement | 851 | 3,62,458 | 945 | 3,85,373 |
| Total (A+B) | 1,221 | 5,53,122 | 1,415 | 5,06,358 |
Source: SEBI
Secondary Market
Stock Market Performance: Indian stock market witnessing a resilient performance
4.36 In April-December 2022, global stock markets declined because of geopolitical uncertainty. On the contrary, the Indian stock market saw a resilient performance, with the bluechip index Nifty 50 registering a return of 3.7 per cent during the same period. The Nifty 50 – US dollar adjusted return also stood at -4.7 per cent, adjusting for the depreciation of the Indian Rupee against the US Dollar. As regards the US, S&P 500 Average Index declined by 15.3 per cent, while Nasdaq Composite – heavily weighted (49 per cent) towards technology sector companies, declined sharply by 26.4 per cent. At the end of December 2022, Sensex closed 3.9 per cent higher from its closing level on March 31, 2022. Even among major emerging market economies, India outperformed its peers in April-December 2022.
Table IV.7: India outperformed its peers during FY23 (April-December)
| Index | As on 31st March 2022 |
As on 30th December 2022 | Per cent Change in FY22 (Apr-Dec) |
Per cent Change in FY23 (Apr-Dec) |
| India | ||||
| Nifty 50 | 17,464.7 | 18,105.3 | 18.1 | 3.7 |
| S&P BSE Sensex | 58,568.5 | 60,840.7 | 17.7 | 3.9 |
| Emerging Markets | ||||
| Shanghai
Composite, China |
3,252.2 | 3,089.3 | 5.8 | -5.0 |
| Ibovespa, Brazil | 1,19,999.0 | 1,09,735.0 | -10.1 | -8.6 |
| KOSPI, Korea | 2,757.6 | 2,236.4 | -2.7 | -18.9 |
| Developed Markets | ||||
| Nasdaq, USA | 14,220.5 | 10,466.5 | 18.1 | -26.4 |
| Dow Jones, USA | 34,678.3 | 33,147.3 | 10.2 | -4.4 |
| S&P 500, USA | 4,530.4 | 3,839.5 | 20.0 | -15.3 |
| CAC, France | 6,659.9 | 6,473.8 | 17.9 | -2.8 |
| DAX, Germany | 14,414.8 | 13,923.6 | 5.8 | -3.4 |
| FTSE 100, UK | 7,515.7 | 7,451.7 | 10.0 | -0.9 |
| Hang Seng, Hong Kong | 21,997.8 | 19,781.0 | -17.5 | -10.1 |
| Nikkei, Japan | 27,821.4 | 26,094.5 | -1.3 | -6.2 |
Source: Refinitiv, NSE, BSE
–
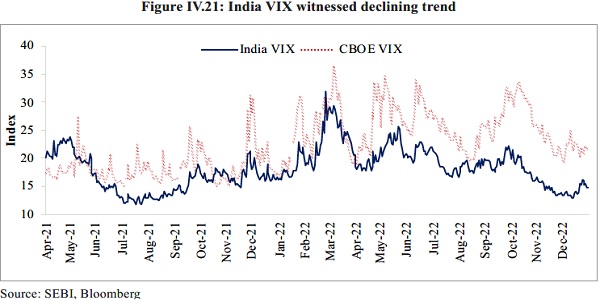
4.37 Heightened geopolitical uncertainty and supply chain disruption post-Russia-Ukraine crisis led to increased volatility in the stock market. India VIX, which measures expected short-term volatility in the stock market, rose to a high of 32.0 on 24th February 2022 with the outbreak of the Russia-Ukraine conflict. Same trend was witnessed in the US equity market (measured by CBOE VIX). Following the outbreak of the conflict, the geopolitical crisis weakened market sentiments which got reflected in the downward movement of benchmark indices over a couple of weeks. Indian stock market also registered losses but recovered quickly to end on a positive note in March 2022. In April-November 2022, the India VIX witnessed a declining trend as the impact of the conflict started to wane as the year progressed.
Valuations (P/E Ratio): Nifty 50 vis-à-vis the global markets
4.38 Nifty 50, with its valuation at 21.8 times the earnings of the constituent stocks (P/E ratio) on trailing basis at the end of December 2022, is expensive compared to global markets, though still lower as compared to its own last five-year average.
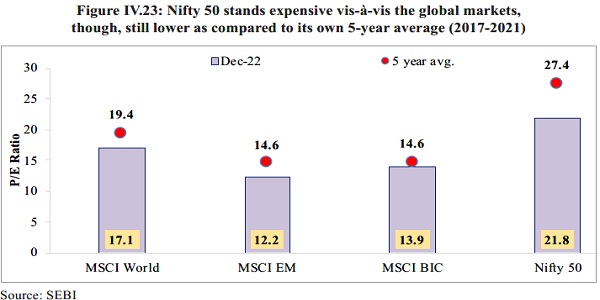
Notes: The MSCI World Index captures large and mid-cap representation across 23 Developed Markets (DM) countries. The MSCI Emerging Markets Index captures large and mid-cap representation across 24 Emerging Markets (EM) countries. MSCI BIC Index is a free float-adjusted market capitalisation weighted index that is designed to measure the equity market performance across the three Emerging Markets country indexes: Brazil, India and China.
Monetary Management And Financial Inter Mediation: A Good Year 99
Retail Participation in the Capital Market
4.40 The share of individual investors in the cash segment marginally declined during FY23 (April-November 2022) compared to the same period during FY22. However, the number of demat accounts rose sharply, 39 per cent higher by the end of November 2022 on YoY basis. However, the incremental additions of demat accounts have been on a declining trend during FY23 relative to FY22, probably because of the increased volatility in the secondary market and subdued primary market performance, amid prevailing global headwinds during the current financial year.
Table IV.8: Share of Individual Investors in Equity Cash Segment Turnover declined
| Year | Share of Individual Investors (per cent) |
| FY22 | 41.1 |
| FY22 (April to November) | 42.2 |
| FY23 (April to November) | 37.5 |
Source: NSE, BSE
Note: Individual investors include individual domestic investors, NRIs, sole proprietorship firms and HUFs.
Others: Partnership Firms/LLP, Trust / Society, Depository Receipts, Statutory Bodies, OCBs, FNs, etc.
Table IV.9: Demat Accounts witnessed a sharp increase in FY22
| Year | Total No. of Demat Accounts (in lakh) |
Accounts Added during the Period (in lakh) |
| FY22* | 890.3 | 344.8 |
| FY22@ | 766.1 | 220.7 |
| FY23# | 1,061.7 | 171.5 |
Source: SEBI; Note: * as at end of Mar-22, @ as at end of Nov-21, # as at end of Nov-22
Turnover Statistics: equity derivatives volumes witnessed a huge jump
4.41 The cash segment turnover declined between April and November 2022, compared to the same period last year, while equity derivatives volumes recorded a considerable jump, reflecting the drifting interests of individuals and proprietary traders away from the equity cash segment to the equity derivatives segment. Driven by the uncertainty prevailing across the globe, currency and commodity derivatives volumes too increased during the same period.
Table IV.10: Turnover in equity, commodity and currency derivatives increased
| Year | FY22
(₹ lakh crore) (1) |
FY22#
(₹ lakh crore) (2) |
FY23#
(₹ lakh crore) (3) |
per cent Change (3) over (2) |
| Cash Segment | 179.0 | 124.3 | 98.2 | -21 |
| Equity Derivatives | 17,613.1 | 9,860.8 | 20,979.6 | 113 |
| Currency Derivatives | 277.2 | 152.7 | 280.4 | 87 |
| Commodity Derivatives | 100.3 | 65.2 | 92.6 | 42 |
| Interest Rate Derivatives | 0.7 | 0.4 | 0.3 | -17 |
Source: SEBI; Note: # Period – April to November
Commodity Derivatives Market: sharp correction on account of monetary tightening by the Fed
4.42 The Russia-Ukraine conflict triggered disruptions to the supply of commodities, especially energy, base metals and food commodities. As a result, a sudden jump in the prices of crude oil and some base metals like Nickel and Aluminium was witnessed. However, commodity prices have seen a sharp correction as the Federal Reserve started increasing interest rates in March 2022 to combat rising inflation. Compared to 31st March 2022, the price of MCX iCOMDEX Base Metal Index declined by 19.1 per cent by the end of November 2022, followed by the bullion index (-3.5 per cent) and Energy index (-1 per cent). The prices of Aluminium, Copper, Zinc and Nickel at MCX also declined as of November 2022, compared to March 2022.
Mutual Funds witnessed lower net inflows
4.43 During April-November 2022, Mutual Funds witnessed significantly lower net inflows than last year. However, during the same period, some schemes comprising growth/equity-oriented schemes and solution-oriented schemes observed significantly higher inflows than in the previous year.
4.44 On the other hand, income/debt-oriented schemes and hybrid schemes recorded outflows compared to inflows in the same period of the previous year. Outflows from liquid funds and hybrid schemes were mainly affected by increasing interest rate cycles, liquidity requirements and advance tax commitments by corporates. Despite that, the mutual fund industry’s assets under management (AuM) increased by 8.1 per cent at the end of November 2022 on YoY basis, thanks to the market performance.
Table IV.11: AuM of the mutual funds industry increased
| Period | No. of Folios (crore) |
Gross Resource Mobilisation (₹ lakh crore) |
Redemption (₹ lakh crore) | Net Resource Mobilisation (₹ lakh crore) |
AUM
(₹ lakh crore) |
| FY22 | 13.0 | 93.2 | 90.7 | 2.5 | 37.6 |
| FY22 | 11.7 | 58.6 | 56.1 | 2.5 | 37.3 |
| FY23 | 14.0 | 69.1 | 68.4 | 0.7 | 40.4 |
Source: SEBI
Note: As on November 30 of the respective financial year
Table IV.12: Equity-oriented schemes witnessed net inflows
| Period | Income/ Debt- Oriented (₹ lakh crore) |
Growth/ Equity Oriented (₹ lakh crore |
Hybrid (₹ crore) |
Solution Oriented (₹ crore) |
Others (₹ lakh crore) |
Total (₹ lakh crore) |
| FY22 | 2.0 | -0.4 | -2,936 | 1,577 | 0.6 | 2.1 |
| FY22 | 0.2 | 0.7 | 88,854 | 650 | 0.8 | 2.5 |
| FY23 | -1.1 | 0.9 | -13,649 | 1,091 | 1.0 | 0.7 |
Source: SEBI
Note: Other Schemes include Index Funds, Gold ETFs, Other ETFs and FoFs investing overseas.
As on November 30 of the respective financial year
Monetary Management And Financial Inter Mediation: A Good Year 101
Foreign Portfolio Investments
Strong macroeconomic fundamentals ensure India remains an attractive destination
4.45 Global economic factors, such as inflationary pressures, monetary tightening by central banks and recessionary fears in Advanced Economies, exerted pressure on FPIs to sell in Indian markets. Further, investors were also sitting on gains from Indian stocks that could be realised to offset losses elsewhere. However, on account of the strong macroeconomic fundamentals of the Indian economy and the improvement in market risk appetite from time to time, assets under custody (custodial holdings of FPIs reflecting the total market value of the holdings) witnessed an increase despite the outflows driven by global factors. The total assets under custody with FPIs increased by 3.4 per cent at the end of November 2022 compared to November 2021.
Table IV.13: Assets under Custody for FPIs increased
| Period | Equity (₹ lakh crore) |
Debt (₹ lakh crore) |
Debt- VRR (₹ lakh crore) |
Hybrid (₹ lakh crore) |
Total (₹ lakh crore) |
| End November 2022 | 49.9 | 2.4 | 1.4 | 0.3 | 54.0 |
| End November 2021 | 48.0 | 2.7 | 1.3 | 0.3 | 52.2 |
Source: SEBI
4.46 The overall net investments by Foreign Portfolio Investors during FY23 registered an outflow of ₹16,153 crore at the end of December 2022 from an outflow of ₹5,578 crore during FY22 at the end of December 2021, with both the equity segment and the debt segment witnessing net FPI outflows.
Table IV.14: Net investments by FPI registered outflows
| Monthly FPI Net Investments (FY23) | |||||
| Month | ₹ crore | ||||
| Equity | Debt | Debt-VRR | Hybrid | Total | |
| April | -17,144 | -4,439 | -1,175 | 69 | -22,688 |
| May | -39,993 | -5,506 | 9,043 | -62 | -36,518 |
| June | -50,203 | -1,414 | 87 | 108 | -51,422 |
| July | 4,989 | -2,056 | -785 | -176 | 1,971 |
| August | 51,204 | 3,845 | 2,997 | -1,525 | 56,521 |
| September | -7,624 | 4,012 | -1,455 | 1,112 | -3,955 |
| October | -8 | -3,532 | 762 | -301 | -3,080 |
| November | 36,239 | -1,637 | -540 | -214 | 33,847 |
| December | 11,119 | -1,673 | -272 | -4 | 9,171 |
| Total – FY23 | -11,421 | -12,400 | 8,662 | -993 | -16,153 |
Source: SEBI
Note: * The data presented above is compiled on the basis of reports submitted to SEBI/Depositories by Custodians and constitutes trades conducted by FPIs on and up to the previous trading day(s).
# As of December 2022.
4.47 Large capital outflows from EMDEs such as India and China, which are importers of commodities, were matched by inflows into commodity export-oriented markets such as Indonesia, Malaysia and Brazil.
Table IV.15: Trends in Total Portfolio Flows to Select Markets (US$ billion)
| 2019 | 2020 | 2021 | 2022 (up to November) | |
| South Korea | 46.7 | 42.2 | 83.2 | 43.6 |
| China | 196.1 | 408.3 | 230.3 | -183.3 |
| Brazil | -19.4 | -6.4 | 14.6 | 3.1 |
| Japan | 88.9 | -87.7 | 141.7 | -39.0 |
| India | 17.7 | 9.5 | 2.2 | -18.9 |
| South Africa | -10.2 | -9.7 | -23.6 | -20.7 |
| Thailand | -2.0 | -9.3 | 4.9 | 11.1 |
| Taiwan | 9.4 | -15.3 | -15.6 | -41.5 |
| Turkey | -2.7 | -9.4 | 0.4 | -3.1 |
Source: Bloomberg, based on latest available data as on December 12, 2022
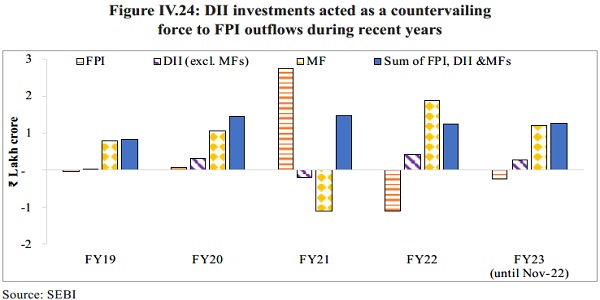
4.48 Investments by Domestic Institutional Investors (DIIs) acted as a countervailing force against FPI outflows during recent years, rendering the Indian equity market relatively less susceptible to large scale corrections. Net DII inflows and net investment by mutual funds in equities were observed during FY23 (until November 2022).
Other Developments
Necessity of a common approach to regulating the crypto ecosystem
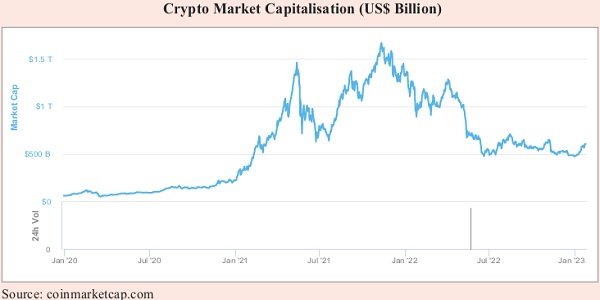
4.49 The recent collapse of the crypto exchange FTX and the ensuing sell-off in the crypto markets have placed a spotlight on the vulnerabilities in the crypto ecosystem. Crypto assets are self-referential instruments and do not strictly pass the test of being a financial asset because it has no intrinsic cashflows attached to them. US regulators have disqualified Bitcoin, Ether and various other crypto assets as securities4. A rare joint statement5 by the Federal Reserve, Federal Deposit Insurance Corporation (FDIC), and the Office of the Comptroller of the Currency (OCC) on 3rd January 2023 highlighted their concerns about crypto-asset risks to the banking system. The geographically pervasive nature of the crypto ecosystem necessitates a common approach to the regulation of these volatile instruments. In this context, the global response to cryptos is evolving, and Box 1 captures the current state of regulatory approaches to cryptos worldwide.
Box IV.1: Cross country analysis: Regulation of Cryptocurrency
Crypto assets are new forms of digital assets implemented using cryptographic techniques. The crypto asset market has been very volatile, with its total valuation swinging from almost US$ 3 trillion in November 2021 to less than US$ 1 trillion in Jan 2023. The volatility of the crypto asset ecosystem has brought to the forefront their fragile backing and governance problems, as well as the increasing complexity and non-transparency. With related financial stability risks rising, the issue of crypto asset regulation has recently moved up the policy agenda of many nations. International fora like OECD and G20 are discussing a globally coordinated approach to regulating crypto assets.
Monitoring and regulating cryptocurrencies have been tricky, and regulators across the globe find it challenging to keep track of the new and emerging issues in the fast-moving uncharted field. While crypto assets were apparently designed to disintermediate traditional financial services, this has created new unregulated intermediating entities. The promise of decentralisation haslso yet to be realised in practice. New centralised intermediaries, such as crypto asset exchanges, wallet providers, and crypto conglomerates, require users to trust centralised entities. The increasing importance of these entities could force regulators to consider them as systemic financial market infrastructures (FMIs)6. Still, the fact that they are yet largely unregulated is a cause for concern globally.
Interestingly, holdings of crypto assets are primarily concentrated in the hands of a few “whales”. Estimates show that around 85 per cent of all circulating Bitcoins are held by 4.5 per cent of entities (Ben Mariem et al., 2020). The underlying protocols used to create crypto assets may also conflict with other public policy objectives, for instance, the massive energy intensity of “mining” crypto assets.
There are minimal global standards applicable to unbacked crypto assets, which do not currently mitigate all risks and vulnerabilities. Even as Standard-Setting Bodies (SSBs) have been making efforts to adjust and develop standards, these remain mainly focused on specific issues (financial integrity), sectors (payments, securities and banking), products (global stablecoins), or entities designated as systemic by domestic authorities. Thus, there are regulatory gaps at each stage when crypto assets are issued, transferred, exchanged, or stored by non-bank entities. Crypto’s cross-sector and cross-border nature limits the effectiveness of uncoordinated national approaches. The terminology used to describe the different activities, products, and stakeholders is not globally harmonised. The term “crypto asset” itself refers to a broad spectrum of digital products that may need the attention of multiple domestic regulators based on their actual or intended use. There is a range of crypto actors, such as miners, validators, and protocol developers, that may not be easily covered by traditional financial regulation (Narain & Moretti, 2022).
A few case studies7 of countries and jurisdictions attempting to regulate unbacked crypto assets are discussed below:
- European Union: The European Union’s digital finance strategy comprises regulating Markets in Crypto Assets (MiCA). Even as the focus is on stablecoins, for other crypto assets and key entities delivering critical functions such as exchanges and wallet providers, MiCA proposes onshoring, notification and licensing regimes.
- Japan: The Japan Financial Services Agency introduced regulation of crypto asset service providers in April 2017, mandating clients’ asset segregation, operational risk and cyber security management, Know-Your-Customer, internal audits, and minimum capital requirements. This was implemented by amending the Payment Service Act. Further amendments to the law were made in May 2019 and June 2020 to extend crypto regulation to other entities, such as wallet service providers, limit the leverage provided to retail customers by crypto asset exchanges, and introduce regulations for security tokens and stablecoins, respectively. The law for partial amendment to the Payment Services Act, etc. was enacted in June 2022 to establish a stable and efficient funds settlement system and to provide for the regulation of stablecoins.
- Switzerland: The Swiss Financial Market Supervisory Authority (FINMA) issued guidelines for initial coin offerings in February 2018. Three categories of tokens were introduced: payment tokens, utility tokens, and asset tokens (with a clarification that tradable tokens at pre-financing and presale stage could be treated as securities). Subsequently, the Financial Services Act harmonised prospectus requirements across all securities (including asset tokens) in June 2018. The distributed ledger technology (DLT) amended various civil and financial market laws in February 2021 to enable the introduction of ledger-based securities on blockchain and provide rules for the segregation of crypto assets in the event of bankruptcy of crypto custodians.
- United Kingdom: Financial Conduct Authority’s “Final Guidance on Crypto assets” declared in June 2019 that while security tokens (crypto assets with rights and obligations similar to “specified investments”) fell inside the regulatory purview, utility and “exchange tokens” (i.e., unbacked crypto assets) were outside of prudential and conduct regime. Following significant consumer research on the crypto asset market, the UK Treasury set out its roadmap for crypto asset regulation in April 2022, focusing on stablecoins and a proposal for a sandbox regime for blockchain-based FMIs. Regarding regulating crypto asset promotions, the UK Crypto Assets Taskforce8 published a report in 2018 that found that misleading advertising (overstating benefits and rarely warning retail investors of volatility and risks) and lack of suitable information were vital consumer protection issues in crypto-asset markets. In January 2022, the UK Treasury proposed bringing crypto assets within its Financial Promotions Regime, subjecting crypto asset promotions to the same high standards as for other financial promotions such as stocks, shares, and insurance products. Similarly, the Monetary Authority of Singapore published guidelines to restrict the marketing of crypto assets in Singapore in January 2022, limiting crypto asset promotions to an entity’s corporate website, official social media accounts, and mobile applications.
- Albania: Albania’s law on “DLT-based Financial Markets” (also known as the “Fintoken Act”) legalised crypto assets inAlbania for investment purposes in May2020. The regulation encompasses the issuance of digital tokens and virtual currencies and the licensing, monitoring, and supervision of entities engaged in distribution, trading, and custody. The Albanian Financial Supervisory Authority (AFSA) and the National Agency for Information Society (NAIS) are entrusted as competent authorities for unbacked crypto assets (and the Bank of Albania for stablecoins). It may be noted that licensing crypto asset service providers heavily relies on third-party agents, licensed as ‘Digital Token Agents’ when focusing on regulatory and financial compliance side by AFSA and as ‘Innovative Service Providers’ when dealing with technological compliance by NAIS.
- Nigeria: The Central Bank of Nigeria (CBN) declared in February 2018 that crypto assets are not legal tender in Nigeria. Further, in February 2021, the CBN wrote to regulated financial institutions that dealing in crypto assets and facilitating payments for crypto asset service providers was prohibited. More recently, the Securities and Exchange Commission published “New Rules on Issuance, Offering Platforms and Custody of Digital Assets,” outlining “digital asset offerings” as within the purview of the SEC and imposing requirements on “digital asset offering platforms” and “digital asset offering custodians” in May 2022.
Despite some progress through the AML/CFT obligations for crypto asset providers stipulated by FATF, their implementation is still a work in progress (FATF 2021),9 with significant delays in critical areas such as the “travel rule,” leaving the virtual asset (VA) and virtual asset service providers (VASP) sector vulnerable to criminal and terrorist misuse10. As of March 2022, while 29 out of 98 responding jurisdictions reported having passed Travel Rule legislation, only 11 jurisdictions have started enforcement and supervisory measures.
Therefore, Global standards need to be comprehensive and consistent; regulatory responses must be based on standard taxonomies, reliable data to address contagion effects, and flexible enough to be adjusted in the future based on market developments and future international standards.
IFSC – GIFT City
4.50 Over the last few years, various initiatives taken by the government have opened up new avenues and opportunities for capital market players. Setting up and operationalising India’s maiden International Financial Services Centre (IFSC) in GIFT City is the most important one. The aim is to facilitate India to emerge as a significant economic power by accelerating the development of a strong base of International Financial Services in the country. Box 2 below discusses the key role that IFSC can play in facilitating India’s emergence as a preferred jurisdiction for international financial services and encouraging easier access and greater participation from foreign investors to bring in capital to further promote India’s growth.
Box IV.2: GIFT IFSC – Emerging as a Preferred Jurisdiction for International Financial Services
Globally, International Financial Centres (IFCs) have assumed prominence in the financial services ecosystem primarily because they have contributed enormously to the growth of international financial transactions. These centres have played a pivotal role in accelerating the pace of financial globalisation. In common parlance, an IFC is a jurisdiction with a high concentration of financial institutions such as Banks, Stock Markets & related entities, Insurance firms, Fund Managers, FinTech firms, etc., which offer specialised financial services to non-residents and residents, in an environment that promotes financial innovation and facilitates cross border transactions.
Given this backdrop, setting up and operationalising India’s maiden IFSC in GIFT City has been a path-breaking financial reform underpinning India’s increasingly liberal outlook towards capital account convertibility. GIFT-IFSC is housed in India’s first fully operational Smart City with world-class commercial, social and physical infrastructure. To bolster the development of IFSC, the Government took a major policy decision to establish the first of its kind, unified and agile financial sector regulator for IFSCs viz International Financial Services Centres Authority (IFSCA) through an Act of Parliament in 2019. From 1st October 2020, IFSCA assumed the power of four domestic sector regulators, namely RBI, SEBI, IRDAI & Pension Fund Regulatory and Development Authority of India (PFRDAI), in so far as the development and regulation of IFSCs in India were concerned.
Over the last two years, GIFT-IFSC has witnessed tremendous growth and traction across the entire spectrum of financial services, including banking, capital markets, insurance, fund management, aircraft leasing, etc. With an internationally aligned regulatory regime, competitive tax structure and beneficial cost of operations, GIFT IFSC is now emerging as a preferred jurisdiction for international financial services. Recognising the growing significance of IFSC, the Global Financial Centres Index, London Report (March 2022) put IFSC in GIFT City at the top, among 15 centres globally, which is likely to become more significant over the next 2 to 3 years.
GIFT IFSC has more than 390 + entities registered across a full spectrum of financial services, including Banks, Capital Markets, Insurance, FinTech, Aircraft Leasing, Bullion Exchange, etc. The financial services market is rapidly growing with the healthy and increasing participation of international and domestic financial institutions.
Recent developments/milestones/innovations/collaborations with other countries In pursuit of its vision to become an international financial centre of global stature, IFSCA has continuously engaged in deliberations with many globally prominent financial authorities and standard-setting bodies. To date, the Union Cabinet has approved the signing of 2 Multilateral MoUs (MMoU) and 7 Bilateral MoUs (BMoUs) by IFSCA to deepen cooperation with foreign regulators and aid the mutual exchange of information for the development of financial products and services in GIFT-IFSC. The table below provides the latest status of MoUs approved by the Union Cabinet –
Multilateral Memorandum of Understanding (MMoU)
- International Organization of Securities Commissions (IOSCO)
- International Association of Insurance Supervisors (IAIS)
Bilateral Memorandum of Understanding (BMoU)
- Dubai Financial Services Authority (DFSA)
- Qatar Financial Services Authority (QFCA)
- Abu Dhabi Global Market (ADGM) Financial Services Regulatory Authority (FSRA)
- Autorite Des Marches Financiers of France (AMF)
- Commission De Surveillance Du Secteur Financier (CSSF) Luxembourg
- Finansinspektionen (FI) Sweden.
- Monetary Authority of Singapore (MAS)
Besides the above, IFSCA has also entered into agreements for technical cooperation and capacity building for the development of a world-class regulatory environment for financial products and financial services in IFSC. Some of the projects/agreements showcasing IFSCA’s growing engagement with the global community are highlighted below:
FinTech bridge with the Monetary Authority of Singapore
Both India and Singapore have been pioneers in the FinTech sector. To fuel the next phase of FinTech growth, the Government of India is developing GIFT IFSC as the nerve centre of all FinTech activities. Monetary Authority of Singapore (MAS) and the International Financial Services Centres Authority (IFSCA) have signed a FinTech Co-operation Agreement (CA) to facilitate regulatory collaboration and partnership in FinTech to promote a Joint Regulatory Sandbox Collaboration that will leverage existing regulatory sandboxes in their respective jurisdictions to support experimentation of technology innovations. The Agreement will enable FinTech firms from one jurisdiction to gain market access in the other jurisdiction through a regulatory referral system.
NSE IFSC -SGX Connect
NSE IFSC-SGX Connect, inaugurated by the PM on July 29, 2022, is an essential milestone in the cross-border collaboration between India and Singapore in the area of capital markets. The Connect, likely to be fully operational by June 2023, will play a pivotal role in onshoring derivative trading in NIFTY Products from SGX, Singapore, to NSE-IFSC, GIFT City. The Connect is expected to consolidate volumes and deepen liquidity in derivative instruments at GIFT IFSC, bring in more international participants and positively impact other financial ecosystems in GIFT IFSC. It has been designed to harness the advantages of respective exchanges, SGX for ease of access to investors and NSE IFSC for trading and clearing derivative contracts, in a symbiotic manner to confer gains on all.
Visibility and Mindshare Among FinTechs globally
To promote the FinTech ecosystem at GIFT IFSC and create visibility amongst the Global FinTech community, IFSCA, with support from GoI, has instituted a flagship financial technology and global thought leadership event, “InFinity Forum” as an annual feature beginning in 2021. It unites the world’s leading minds in policy, business, and technology to discuss and develop actionable insight into how the FinTech industry can leverage technology and innovation for inclusive growth. The first edition of the Forum held on the 3rd and 4th of December 2021, was inaugurated by the Prime Minister, with Indonesia, South Africa and the United Kingdom participating as partner countries. The event saw a total of 94,300 registrations, leaving behind a massive international footprint.
Cooperation agreement between India INX and Luxembourg Stock Exchange
India INX, an IFSC-based exchange, signed a cooperation agreement with Luxembourg Stock Exchange on June 01, 2022. The two exchanges will endeavour to enhance the visibility of listed Indian securities towards international investors by facilitating the admission of such securities listed on LuxSE. The Agreement builds on the Memorandum of Understanding signed between the two institutions in November 2020, which focuses on advancing green finance in India. The green corridor opportunity established with this dual listing cooperation agreement between India INX and LuxSE will go a long way in attracting more issuers from India and the region and provides access to green capital from international investors.
IFSCA Vision for FY24 and beyond
FY23 is a watershed year for IFSC. It marks a decade of India’s maiden IFSC. The vision plan beyond 2022 revolves around elevating GIFT-IFSC to a virtuous self-sustaining trajectory towards becoming the nerve centre of new-age global financial services and activities. This aspirational pursuit of integrating our economy with the global financial ecosystem has been rich in learnings which are being systematically capitalised to design cutting-edge statutory and regulatory frameworks to lift the centre into a higher orbit of financial innovation and dynamism.
Within years of its establishment, GIFT-IFSC has become a prominent gateway for the flow of global capital into India. Significant gains have been made in kickstarting experimental and innovative financial services such as bullion trading, aircraft and ship leasing, global-in house centres, Fintech, sustainable financing and cross-border bill discounting and factoring. Sophisticated financial products such as Bullion Depository Receipts, unsponsored Depository Receipts, and financial and operational leases have been introduced, with many more in the pipeline. State-of-the-art infrastructure has been created for wholesome quality of life with essential projects including metro connectivity, integrated residential projects, Central Park, Riverfront and recreational centres on the anvil.
The foundation has been laid for creating a thriving knowledge economy by allowing foreign universities to set up operations in IFSC free of domestic regulations. Simultaneously, external assistance is mobilised to establish India’s premier Fintech Institute and Innovation Centre in GIFT City. The Centre, with an estimated cost of ₹800 crore, will underpin India’s growing stature and
leadership in Fintech and attract the best of talent globally.
Significantly, the Government’s vision for GIFT-IFSC transcends much beyond traditional finance and ventures into thought leadership. It is envisioned as the embodiment of Aatmanirbhar Bharat, a hub of ingenuity and innovation. As we advance, the vision entails a quantum leap in imagination and endeavours to transform GIFT City into a bustling financial hub, a vibrant city bearing a distinctively international character and pioneering solutions to complex problem statements involving finance.
Developments in the Insurance Market
Insurance markets globally have demonstrated remarkable flexibility and resilience in overcoming the impact of the pandemic
4.51 Insurance, an integral part of the financial sector, plays a significant role in economic development. Apart from protecting against mortality, property, and casualty risks and providing a safety net, the insurance sector encourages savings and provides long-term funds for infrastructure development. The development of the insurance sector is necessary to support its continued economic transformation.
4.52 Internationally, the potential and performance of the insurance sector are generally assessed based on two parameters, viz., ‘insurance penetration’, which refers to the ratio of total insurance premiums to Gross Domestic Product (GDP) in a year and ‘insurance density’, which refers to the ratio of insurance premium to population, i.e.; insurance premium per capita and is measured in US Dollar, as they reflect the level of development of the insurance sector in a country. In 2021, total global insurance premiums grew by 3.4 per cent in real terms, with the non-life insurance sector registering 2.6 per cent growth, driven by rate hardening in commercial lines in developed markets. However, in China, the largest emerging market, non-life premium volumes contracted by 0.7 per cent as the de-tariffication11 of motor insurance sparked fierce competition and rate reductions.
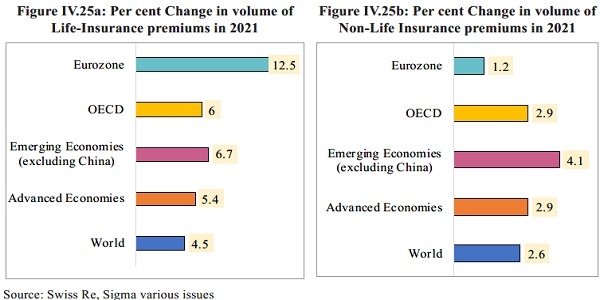
4.53 In the life insurance segment, global premium growth bounced back strongly, registering an increase of 4.5 per cent. The US remained the largest insurance market in the world, with total premiums (non-life and life) of US$ 2.8 trillion in 2021, followed by China and Japan. With the conflict in Ukraine weighing on economic growth in Europe in particular, it is expected that insurance industry growth in emerging markets will outpace that in the developed markets this year, with emerging Asia in the lead.
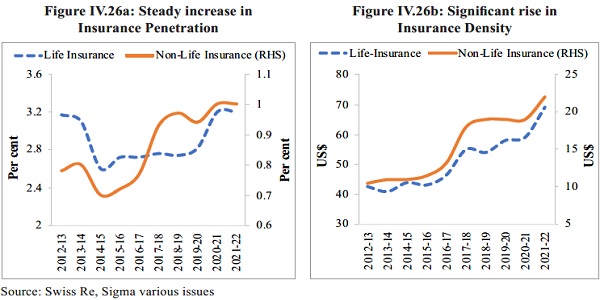
India poised to emerge as one of the fastest-growing insurance markets in the coming decade
4.54 Insurance penetration in India increased steadily from 2.7 per cent around the turn of the millennium to 4.2 per cent in 2020 and remained the same in 2021. Life insurance penetration in India was 3.2 per cent in 2021, almost twice more than the emerging markets and slightly above the global average. However, most life insurance products sold in India are savings-linked, with just a small protection component. Hence, households remain exposed to a significant financing gap in the event of the premature death of the primary breadwinner. Be that as it may, the insurance density in India has increased from US$ 11.1 in 2001 to US$ 91 in 2021 (density for Life insurance was US$ 69 and Non-Life insurance was US$ 22 in 2021) in keeping with the relatively faster expansion of the insurance market in the country.
4.55 During FY22, the gross direct premium of non-Life insurers (within and outside India) registered YoY growth of 10.8 per cent, primarily driven by health and motor segments. The net incurred claims of non-Life insurers stood at ₹1.4 lakh crore in FY22, primarily driven by rising per capita income, product innovations and customisation, development of strong distribution channels, and rising financial literacy. The life insurance premium registered YoY growth of 10.2 per cent in FY22, with new businesses contributing 45.5 per cent of the total premiums received by the life insurers. The life insurance industry paid benefits of ₹5.02 lakh crore in FY22, out of which 8.3 per cent benefits were on death claims.
4.56 Public listings improve public disclosure, corporate governance, and valuation12. In keeping with this understanding, India’s largest life insurer, the Life Insurance Corporation of India, went public in May 2022, raising US$ 2.7 billion in the country’s largest IPO to date. The private insurance providers have also been seizing such opportunities. The largest private-sector health insurer in the country, was listed in December 2021, making it the fifth private-sector insurer to IPO. The insurance sector is highly competitive and is already witnessing mergers and acquisitions (M&A) activity as insurers have tremendous opportunities and volume to co- exist in the space. Additional FDI inflows, IPOs, simplified rules & regulations and improved corporate valuations will likely further accelerate M&A activities in the sector. A rapidly maturing insurance market has provided a lucrative opportunity to the government to privatize its stake in insurance business. Accordingly, the General Insurance Business (Nationalisation) Amendment Act, 2021 allows the central government to pare its stake to less than 51 per cent of the equity capital in a specified insurer.
4.57 To facilitate the penetration of insurance to the lower income segments of the population, the Insurance Regulatory and Development Authority of India (IRDAI) issued IRDAI (Micro Insurance) Regulations, 2015, which provide a platform for distributing insurance products that are affordable for the rural and urban poor and promote financial inclusion. Further, the IRDAI (Obligations of Insurers to Rural and Social Sectors) Regulations, 2015 stipulate obligations for insurers in rural and social sectors and has contributed to developing and promoting micro-insurance products in India. In FY21, 10.7 lakh new micro-insurance policies were issued to individuals with a new business premium of ₹355.3 crore (in the life-insurance segment), and 53,046 new microinsurance policies were issued in the general insurance segment (excluding standalone health insurers).
4.58 Government schemes and financial inclusion initiatives have driven insurance adoption and penetration across all segments. The government’s flagship initiative for crop insurance, Pradhan Mantri Fasal Bima Yojana (PMFBY), has led to significant growth in the premium income for crop insurance. Ayushman Bharat (Pradhan Mantri Jan Arogya Yojana) (AB PM-JAY) aims at providing a health cover of ₹5 lakh per family per year for secondary and tertiary care hospitalisation. The insurance regulator IRDAI has also undertaken various initiatives towards boosting insurance penetration, such as permitting insurers to conduct video-based Know Your Customer (KYC), launching standardised insurance products, and allowing insurers to offer rewards for low-risk behaviour. Important government initiatives, strong demographic factors, a conducive regulatory environment, increased M&As, product innovations, and vibrant distribution channels are supporting the insurance market’s growth.
A list of various Government Insurance schemes and progress made so far is given in the table below:
Table IV.16: Government Insurance schemes and progress
| Scheme name | Brief description | Achievement |
| Ayushman Bharat Yojana | The scheme provides health coverage of ₹5 lakh per beneficiary family per annum to poor and vulnerable families identified based on select deprivation and occupational criteria | Since inception, 19.7 crore beneficiaries have been provided Ayushman cards, and over 4.3 crore hospital admissions worth over ₹0.49 lakh crore have been authorised through a network of 28,667 empanelled health- care providers, including 13,115 private hospitals as of 20th January 2023. |
| Pradhan Mantri Suraksha Bima Yojana | Under the scheme, risk coverage of ₹2 lakh for accidental death and complete disability and ₹1 lakh for partial disability is given to beneficiaries | Since its inception, 31.3 crore beneficiaries have been enrolled under the scheme, and 1.07 lakh claims have been disbursed as of 30th November 2022. |
| Pradhan Mantri Jeevan Jyoti Bima Yojana | Under the scheme, risk coverage of ₹2 Lakh is credited to the savings bank account of the holder in case of the death of the insured | Since its inception, 14.4 crore beneficiaries have been enrolled under the scheme, and 6.3 lakh claims have been disbursed as of 30th November 2022. |
| Pradhan Mantri Vaya Vandana
Yojana |
Under the scheme, old age income security is provided to senior citizens through the provision of an assured pension/return linked to the subscription amount based on a government guarantee to LIC | A total number of 8.6 lakh subscribers with a subscription amount of ₹84,659.4 crore deposited by these subscribers have benefited under the scheme as of 30th September 2022 |
| Pradhan Mantri Fasal Bima Yojana | Under the scheme, risk insurance is provided to farmers against crop damage due to non-preventable natural risks from pre-sowing to post- harvest for the crops/areas notified by the concerned State Government | During 2016 and 2022, 2763.9 lakh applications were received under the scheme, and claims of about ₹ 1.28 lakh crore have been paid to the farmers. |
Source: DFS, PIB, PMFBY Dashboard
4.59 Global life premiums are expected to contract slightly in 2022 after last year’s robust recovery from pandemic-induced lows driven by inflationary pressures, economic uncertainty, and monetary tightening. Saving premiums are expected to decline due to volatility in the financial markets and as disposable incomes fall. Heightened risk awareness due to Covid-19 may continue to support demand for life protection (and health) insurance products.
4.60 As per the Swiss Re Institute World Insurance: ‘Inflation risks front and centre report’13, India is one of the fastest-growing insurance markets in the world. In total premium volumes, it was the 10th largest globally in 2021, with an estimated market share of 1.9 per cent and the second largest of all emerging markets. India is expected to emerge as one of the top six insurance markets in the world by 2032, ahead of Germany, Canada, Italy, and South Korea. Further, growth in the non-life insurance sector is likely to be driven by demand for health coverage, with people more aware of health security post-Covid-19 and strong support from the government-sponsored mass health program (Ayushman Bharat). Compulsory motor third-party insurance will multiply as India’s middle class expands and buys more cars.
4.61 The digitisation of India’s insurance market goes beyond telematics and customer risk assessment. Many digital platforms have emerged over recent years, offering various services, including insurance purchases. These measures, accompanied by an increase in FDI limit for Insurance Companies, are likely to facilitate an increased flow of long-term capital, global technology, processes, and international best practices, which will support the growth of India’s insurance sector.
Pension Sector
India’s Pension Sector demonstrated remarkable performance during the Covid-19
4.62 The framework of the pension system has evolved globally. In advanced countries, the pension sector is substantial, partly stemming from a large share of formal salaried employment. While the state provides some basic pension, it is only sometimes funded and thus is a pay-as-you-go scheme relying on current government revenue for pension payments. In 2021, pension assets in OECD countries14 stood at US$ 38.5 trillion, 66.9 per cent of the GDP. In some of the OECD countries, pension assets were over 100 per cent of the GDP. The United States recorded the largest holdings in pension funds, followed by the United Kingdom and Australia. During Covid-19, countries undertook unprecedented and swift health and pension-related reforms15 to address health challenges, limit the impact of the crisis on labour markets, support incomes and adjust macroeconomic policies.
4.63 In addition, countries took other measures to minimise the impact of Covid-19 on the marginalised, poor and vulnerable sections such as subsidising wages and pension entitlements through Job Retention Scheme (JRS), broadening the access to unemployment benefits, or grant of unemployment insurance to new groups of workers. The United States expanded the coverage of unemployment benefits to the self-employed and Finland broadened the coverage of the already existing scheme for the self-employed. Chile permanently expanded the coverage of unemployment insurance to workers. New Zealand introduced a temporary benefit paid for up to three months to employees who lost their jobs and to the self-employed who stopped their activity.
4.64 The Government of India announced various measures to provide pensions to families who have lost their earning members due to Covid. It also took initiatives towards enhancing and liberalising insurance compensation. The benefit of the Employees State Insurance Corporation (ESIC) pension scheme was extended to even those who have lost earning members due to Covid-19. Dependent family members of such persons were entitled to a pension equivalent to 90 per cent of the average daily wage drawn by the worker as per the existing norms. The insurance benefits under the Employees Deposit Linked Insurance (EDLI) scheme were also enhanced and liberalised.
4.65 Ex-gratia of ₹1,000 was given to around three crore poor senior citizens, widows, and disabled sections of the population (aged above 60 years) for three months during April-June 2020. Rule 64 of CCS (Pension) Rules, 1972, was relaxed to ensure immediate provisional sanction of pensionary benefits amid the unprecedented pandemic. To enhance the “Ease of Living” of Central Government Civil Pensioners, an Electronic Pension Payment order (e-PPO) was integrated with Digi Locker, creating a permanent PPO record in the Digi Locker. The timeline for submitting Life Certificate was relaxed, along with providing a doorstep facility to pensioners for submission of the life certificate digitally.
4.66 The Government of India is implementing various pension schemes such as the Indira Gandhi National Old Age Pension Scheme (IGNOAPS), Indira Gandhi National Widow Pension Scheme (IGNWPS), Indira Gandhi National Disability Pension Scheme (IGNDPS) under the National Social Assistance Programme (NSAP) with a total beneficiary coverage of 4.7 crore. The National Pension System (NPS) was introduced in January 2004, the primary pension system for government employees with a pay-as-you-go defined benefit plan. NPS for government employees is a defined contribution plan with co-contribution from the government. The value of the pension corpus is marked-to-market, and accordingly, the rate of return is market determined. NPS was extended to all the citizens of the country in the age group of 18-70 years, including the unorganised sector workers (on a voluntary basis) in 2009. In order to ensure that an avenue for savings is available to all sections of society, PFRDA launched “NPS-Corporate Sector Model” in 2011 to provide NPS to the employees of corporate entities, including PSUs.
4.67 The Government introduced APY in June 2015 as a part of the overarching objective of providing universal social security. The scheme applies to all individuals aged 18-40 years, with an emphasis on underprivileged, unorganised, and low-income individuals. Since the introduction of NPS and, more recently, APY, India’s pension sector has expanded. The total number of subscribers under the NPS and APY registered a YoY growth of 25.1 per cent in November 2022, with AuM witnessing a growth of 22.7 per cent during the same period. The overall contribution recorded an increase of 27.6 per cent in November 2022, with maximum growth registered by the All-Citizen model followed by the Corporate Sector.
Table IV.17: Performance of India’s Pension Sector
| No. of Subscribers | YoY | Contribution (₹ Crore) |
YoY | AUM (₹ Crore) |
YoY | ||||
| Nov-
21 |
Nov-
22 |
per cent | Nov-21 | Nov-22 | per cent | Nov-21 | Nov-22 | per cent |
|
| CG+SG | 77 | 83 | 8 | 3,93,690 | 4,89,855 | 24 | 5,55,932 | 6,67,255 | 20 |
| Corporate+All Citizen | 32 | 42 | 31 | 8,41,80 | 1,19,817 | 42 | 1,07,554 | 1,46,705 | 36 |
| APY | 325 | 429 | 32 | 16,877 | 22,437 | 33 | 19,352 | 24,829 | 28 |
Source: PFRDA
Note: CG stands for Central Government and SG for State Government
4.68 A survey by PFRDA16 on the socio-economic characteristics of NPS subscribers (all citizen models) for the five-year period FY17 to FY21 showed that 24 per cent were female subscribers, with the balance 76 per cent being male subscribers. This contrasts with a better gender balance in the case of APY. Female subscribers under APY have increased from nearly 38 per cent in the initial years of the scheme to around 44 per cent by March 202117. Among various states, enrolment from Maharashtra was the highest, accounting for 17 per cent. The age profile of the subscribers in the APY scheme suggests increasing enrolments at younger age. As of August 2022, 44.8 per cent subscribers were between 18 and 25 years, as compared to 29.3 per cent as on March 201618. Further, more people are now opting for a pension amount of ₹1000 per month. As of March 2022, around 76 per cent of subscribers have opted for ₹1000 per month pension amount, as compared to 38 per cent of subscribers as on March 2016. However, the number of subscribers opting for ₹5000 per month pension has declined from 47 per cent as of March 2016 to 15 per cent as of March 2022. The coverage of the population in pension under NPS and APY as a share of the total population has raised from 1.2 per cent to 3.7 per cent during the six years FY17 to FY22. Assets as a proportion of GDP have increased from 1.2 per cent to 3.2 per cent, reflecting that the pension sector is progressing much faster than the nominal growth of the economy and population.
4.69 PFRDA has undertaken various measures to ease the accessibility of NPS and APY to subscribers, such as reducing timelines for processing settlements to T+2 days. Central Recordkeeping Agencies have integrated their systems with DigiLocker to provide Subscriber Centric Services such as electronic-Pension Retirement Account Number (e-PRAN), electronic Account statements, and Aadhar & DigiLocker-based account openings. Government sector subscribers can change their investment choices online by submitting the request directly in the CRA login. The contributions through the UPI handle can be accepted for the benefit of NPS subscribers, permitting them to remit funds into their PRAN via the Virtual account number provided by CRA.
4.70 There is tremendous scope for growth in India’s pension sector as per capita income is expected to rise further as the economy transitions to a high-middle-income country. India’s demographic structure, with a more significant proportion of younger people, favours a phase of accumulation. However, financial literacy is a significant challenge not only in emerging market economies but also in advanced economies. PFRDA, under the aegis of the Financial Stability and Development Council (FSDC), has taken several steps to enhance financial education so that consumers can make informed decisions and reap the benefit of the formal financial sector while being cognizant of risks and various trade-offs involved. These include pension education through print and electronic media, outreach programs through trade bodies, intermediaries such as banks, and town hall events.
4.71 India’s pension sector provides a flexible mode of old age income-security for salaried employees and the common person. In the recent five years, FY18 to FY22, the number of subscribers has multiplied over three-fold, led by APY, and AUM by over four-fold, led by NPS. The future expansion in NPS is expected to emanate from the private sector, both the salaried and self-employed. Steps towards enhanced pension literacy, both of the subscribers and the intermediaries, coupled with a nudge from the regulator and the government, along with encouragement to young adults to join a pension scheme, would accelerate the movement towards a pensioned society.
Outlook
4.72 The resilience of the domestic financial system is reflected in the healthy balance sheet of banks, stronger capital levels of NBFCs and robust growth in the AuM of domestic mutual funds. Buoyant demand for bank credit and early signs of a revival in the investment cycle are benefiting from improving asset quality, a return to profitability and resilient capital and liquidity buffers. Further, IBC mechanism continues to support the ‘Ease of Doing Business’ in India by facilitating easy exit with time bound resolutions for firms. These strengths are helping the financial system absorb external spillovers, tightening global financial conditions and high volatility in financial markets.
4.73 India is one of the fastest-growing insurance markets in the world and is expected to emerge as one of the top six insurance markets by 2032. Digitisation of India’s insurance market, accompanied by an increase in FDI limit for insurance companies, is likely to facilitate an increased flow of long-term capital, a global technology, processes, and international best practices, which will support the growth of India’s insurance sector. Also, as we transition to a high middle-income economy, India’s pension sector has tremendous scope for growth. Government initiatives towards enhancing pension literacy of subscribers and intermediaries, and a nudge from the regulator and the government to encourage young adults to join the pension scheme would play a significant role in enhancing pension availability to a more extensive section of society.
Notes:
1 Based on 456 cases where fair values have been estimated
2 Section 9.2.2 Mode of Sale https://ibbi.gov.in/uploads/publication/e42fddce80e99d28b683a7e21c81110e.pdf
3 Report on Trend and Progress of Banking in India for the year ended March 31, 2022
4 Source:https://www.washingtonpost.com/business/how-cryptos-meltdown-changed-the-regulatory debate/2023/01/07/4a469c9a-8e51-11ed-b86a-2e3a77336b8e_story.html
5 Joint Statement by Federal Reserve, FDIC, OCC https://www.federalreserve.gov/newsevents/pressreleases/files/bcreg20230103a1.pdf
6 As per Bank of International Settlements, Financial Market Infrastructure (FMI) is defined as a multilateral system among participating institutions, including the operator of the system, used for the purposes of clearing, settling, or recording payments, securities, derivatives, or other financial transactions. As per RBI, the term FMI
7 generally refers to systemically important payment systems, Central Securities Depositories (CSDs), Securities Settlement Systems (SSSs), Central Counter Parties (CCPs), and Trade Repositories (TRs) that facilitate the clearing, settlement, and recording of financial transactions. IMF Fintech Notes, ‘Regulating the Crypto Ecosystem: The Case of Unbacked Crypto Assets’; https://www.imf.org/en/Publications/fintech-notes/Issues/2022/09/26/Regulating-the-Crypto-Ecosystem-The-Case-of-Unbacked-Crypto-Assets-523715
8 The ‘UK Crypto Asset Taskforce’ comprises HM Treasury, Bank of England, and Financial Conduct Authority (FCA)
9 FATF, “Second 12-month Review Virtual Assets and VASPs,” FATF, (Paris, France 2021).
10 FATF, “Targeted Update on Implementation of the FATF Standards on Virtual Assets/VASPs,” FATF, (Paris, France 2022).
11 De-tariffication means removing the tariff structure. This allows insurance companies to charge premiums that matches the risk profiles of its consumers. Different insurance companies can charge at a different price to its consumers for the same risk behaviour based on their business risks models and strategies.
12 https://m.rbi.org.in/Scripts/bs_viewcontent.aspx?Id=3619
13 https://www.swissre.com/dam/jcr:4500fe30-7d7b-4bc7-b217-085d7d87a35b/swiss-re-institute-sigma-4-2022.pdf https://www.oecd.org/daf/fin/private-pensions/Pension-Markets-in-Focus-Preliminary-2021-Data-on-Pension-Funds.pdf https://www.oecd-ilibrary.org/docserver/ca401ebd-enpdf?expires=1672272470&id=id&accname=guest&checksum=A210559FD020AD4 78A4ECA831FC94891
16 https://www.pfrda.org.in/myauth/admin/showimg.cshtml?ID=2170
17 https://www.pfrda.org.in/myauth/admin/showimg.cshtml?ID=2307
18 https://www.pfrda.org.in/myauth/admin/showimg.cshtml?ID=2296


