SEBI’s recent study highlights significant trends in investor behavior regarding Main Board IPOs listed between April 2021 and December 2023. The study found that 54% of IPO shares allocated to investors (excluding anchor investors) were sold within a week of listing. Individual investors exhibited a notable “flipping” behavior, with 50% of shares sold by value within a week and 70% within a year. The study also identified a strong disposition effect, with investors more likely to sell shares showing positive gains. Notably, 67.6% of shares were sold within a week when returns exceeded 20%, compared to 23.3% for negative returns. Additionally, the post-COVID period saw a surge in demat accounts, with nearly half of those used for IPO applications being opened during 2021-2023. SEBI’s policy changes in April 2022 led to a reduction in oversubscription of Non-Institutional Investor (NII) shares and a decline in large-scale NII applications. For more details, the full study is available on the SEBI website.
Securities and Exchange Board of India
PR No.19/2024
SEBI study shows 54% of IPO Shares allotted to Investors (excluding anchor investors) are sold within a week
In light of the increasing participation of retail investors and the heightened oversubscription in recent IPOs, SEBI conducted an in-depth study to analyze investor behavior in Main Board IPOs. The study encompasses data from 144 IPOs listed between April 2021 and December 2023.
Key findings of the study include:
1. “Flipping” behavior among Individual Investors: Individual investors sold 50% of the shares allotted to them by value within a week of listing, and 70% of shares by value within a year.
2. Disposition effect evident among Investors: The study found a strong disposition effect, with investors showing a greater propensity to sell IPO shares that posted positive listing gains, compared to those that listed at a loss.
3. Returns influencing the selling behavior: When IPO returns exceeded 20%, individual investors sold 67.6% of the shares by value within a week. In contrast, only 23.3% of shares by value were sold when returns were negative.
4. Surge in Demat accounts post-COVID: Nearly half of the demat accounts that applied for IPOs between April 2021 and December 2023 were opened during the post-COVID period (i.e., 2021-2023).
5. Following SEBI’s policy interventions regarding Non-Institutional Investor (NII) share allotment process and RBI’s guidelines on IPO financing by NBFCs in April 2022, the following trends were observed:
- Significant reduction in NII category oversubscription: Oversubscription under the NII category halved from 38 times to 17 times.
- Sharp decline in applications from “Big Ticket NII Investors”: The average number of applications from NII investors applying for more than ₹1 crore in IPOs dropped from approximately 626 per IPO in the pre-policy period (April 2021 – March 2022) to around 20 per IPO in the post-policy period (April 2022 – December 2023). Note that the total funds raised during the two periods were comparable.
The study is available on the SEBI website at www.sebi.gov.in
Mumbai
September 02, 2024
Analysis of Investor Behavior in Initial Public Offerings (IPOs)
Department of Economic and Policy Analysis
Mumbai
September 2024
Page Contents
- Executive Summary
- 5. DATA ANALYSIS AND FINDINGS
- 5.1. Exit Pattern of IPO Allottees
- 5.2. Exit compared to Listing Gain / IPO Performance
- 5.3. Exit compared to Issue size, Type of issue and level of subscription
- 5.4. Buyers and Sellers
- 5.5. Observations post Policy Changes
- 5.6. Brokers’ concentration in IPO Market
- 5.7. Off market transfers
- 5.8. Change in Shareholding Pattern over one Year
- 6. ANNEXURES
Executive Summary
1. The study highlights flipping behavior of investors in the IPO market. About 54% of IPO shares (in value terms) allotted to Investors (excluding anchor investors) were sold within a week from listing.
2. Individual Investors sold 50.2 per cent shares (in value terms) allotted to them within a week from listing.
- Non Institutional Investors (NIIs1) sold 63.3 per cent shares by value
- Retail2 investors sold 42.7 per cent shares by value
3. Mutual Funds tend to invest for longer period in IPO shares, whereas Banks tend to sell swiftly. Mutual Funds sold about 3.3 per cent of allotted value within a week, as compared to 79.8 per cent for Banks.
4. Investors, in general, show “disposition effect”3, implying greater propensity to exit from the IPOs that exhibit positive listing gain than those that exhibit loss on listing.
5. Individual investors sold 67.6 per cent shares by value allotted to them within a week, when returns were more than 20 per cent and sold 23.3 per cent shares by value, when returns were negative.
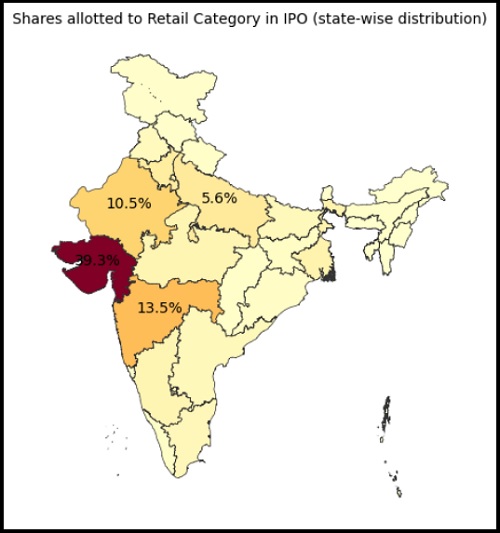
6. 39.3 per cent of Retail Investors were from Gujarat, followed by Maharashtra (13.5%), and Rajasthan (10.5%).
7. Almost half of the total allotted demat accounts that applied for IPOs during Apr21- Dec23, were opened in the post-COVID period (i.e. during CY2021-CY2023).
8. In April 2022, the key policy measures were introduced by SEBI and RBI, especially for NII category. SEBI made changes in share allotment methodology from pro-rata basis to lottery basis for NII category and subdivided NII category (15% quota) into small-NII (5% quota) and big-NII (10% quota) categories, while RBI introduced restrictions on IPO funding by NBFC upto ₹ 1 crore per borrower. Post these policy changes, the following changes were observed,
- Reduction in the over-subscription under NII category from 38 times to 17 times.
- Decline in number of IPO applications by “Big Ticket NII Investors” (applying for more than ₹1 crore in IPOs) from around 626 applications per IPO in pre-period (April 21-Mar 22) to 20 applications per IPO in the post period (April 22-Dec 23).
- Reduction in the exit (in terms of value of shares sold) of “Big Ticket NII Investors” from about 70 per cent within a week during Apr21-Mar22 to about 25 per cent within a week during Apr22-Dec23.
1. OBJECTIVE OF THE STUDY
The study aims to conduct the behavioral analysis of the IPO allottees in the main board Initial Public Offerings (IPOs) for the period between FY22 and FY24$4 in the following ways:
a. Exit pattern of various categories of investors5 on the Listing Day and the selected days post listing over a span of one year.
b. Observations post policy change by SEBI w.r.t. NII category shares allotment and by RBI w.r.t. IPO financing by NBFC
c. The category of investors buying/selling post-listing
d. Off market transfers
e. Shareholding Analysis
2. BACKGROUND
Following a muted fund raising activity for three straight years from FY19 to FY21, FY22 marked a historic year for the public equity issuances, where fund mobilization through Main Board Initial Public Offerings (IPOs) reached new highs, along with listing of many new generation growth-oriented tech companies. In FY22 alone, a record amount of more than ₹1,10,000 crore was raised through 50 IPOs.
Chart 1: Trends in resource mobilization through Main Board IPOs from FY19
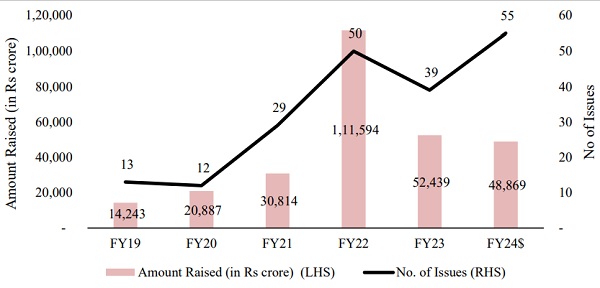
The activity in the IPO market remained buoyant during FY22 to FY24, on back of stronger retail participation as reflected by number of applications and oversubscription. Success of the IPOs was partly supported by overall positive market sentiments and was further boosted by strong post-listing performance in some of the IPOs.
Of the 144 IPOs listed during April 2021- December 2023, 75 per cent IPOs (108 in number) delivered positive returns. As many as 26 IPOs delivered more than 50 per cent listing day returns. Although, there were some laggards post listing, it did not deterred enthusiasm in new IPOs. As many as 92 IPOs were oversubscribed more than 10 times and only 2 IPOs were undersubscribed.
With rising interests in IPO, practice of IPO financing also gained traction. SEBI introduced changes with respect to the allotment of shares for NII (lottery based allotment and sub division of NII category) and Anchor lock-in extension, amongst other measures. RBI also imposed restrictions on IPO financing by limiting funding upto ₹ 1 crore per borrower.
In view of these developments, this study aims to analyze the behavior of different types of investors in the IPOs, underlying trends in the primary market and observations post these policy measures.
3. DATA COLLECTION AND OVERVIEW
The study examines data from 144 main board IPOs listed between April 2021 and December 2023. For the purpose of the study, PAN wise allotment data has been collected from Exchanges (NSE and BSE) whereas holding data on various selected days has been collected from Depositories (CDSL and NSDL). The exit (in terms of the shares sold by the shareholders) are considered at six different time frames during the first year of listing. Therefore, PAN-wise holding data of all the shareholders in 144 IPOs was collected from the depositories for following timeframes,
| Time Code | Details |
| LD_1 | Post Allotment, but Pre-Listing |
| LD | Listing Day |
| LD2 | Listing + 2 days |
| LD_1W | Listing + 7 days |
| LD_1M | Listing + 30 days |
| LD_3M | Listing + 90 days |
| LD_6M | Listing + 180 days |
| LD_1Y | Listing + 365 days |
Note: LD stands for Listing Day
During the study period (April 2021- December 2023), 144 IPOs collectively raised a total of ₹ 2,13,000 Crore. As many as 43 IPOs raised approx. ₹ 92,000 crore (43 per cent of total amount raised) through non-profitability route of fund raising. Notably, 65 per cent of total issue size was Offer for Sale (OFS), through which the pre-existing shareholder sold their shares, instead of the company raising the money.
- Total number of shareholders studied: 2.9 crore (grossed across IPOs)
- Total unique demats: 95.40 lakhs
- Total unique shareholders: 92.6 lakhs
- Average IPO allotment per Retail investor6: 3.2 IPOs
Table 1: Number of allotted investors under different categories
| Category of Investors |
Total Investors |
Total Investors ( per cent of total) |
Unique Investors |
Average IPO Allotments per Investors |
| Retail | 2,85,09,578 | 98.0 | 90,36,416 | 3.2 |
| NII | 5,59,043 | 1.9 | 2,26,836 | 2.5 |
| QIB | 10,126 | 0.03 | 1,149 | 8.8 |
| Others | 5,937 | 0.02 | 599 | 9.9 |
| Total | 2,90,84,684 | 100 | 92,65,000 | 3.1 |
Note: Retail includes employees and shareholders; QIB includes Anchor Investors; Others include Clearing Members, Underwriters, etc.
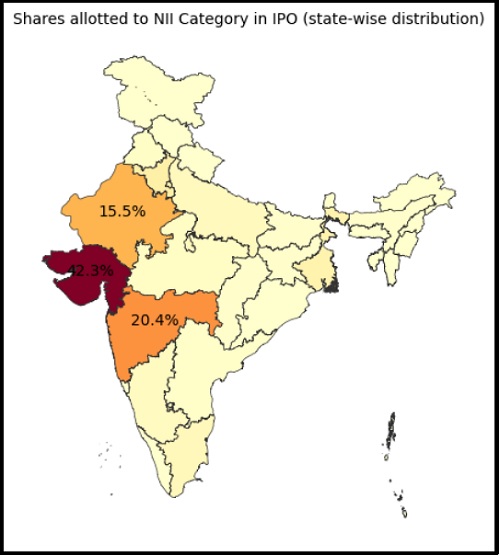
With regard to geographical spread of investors in IPOs, it was observed that about 70 per cent of the IPO investors were from the top four states viz. Gujarat, Maharashtra, Rajasthan and Uttar Pradesh. The retail investors from Gujarat received 39.3 per cent of the allotment in the Retail category, followed by Maharashtra (13.5%), Rajasthan (10.5%). NII Investors from Gujarat received about 42.3 per cent of total allotment in NII Category, followed by Maharashtra (20.4%) and Rajasthan (15.5%) (Annexure 7.1).
With regards to the accounts opened, it was observed that almost half of the total allotted demat accounts for IPOs during April 21- Dec 23, were opened in the post-COVID period (i.e. during CY2021-CY2023). Furthermore, 85 percent of the total allotted demat accounts (for the IPOs under study) were opened in the last eight years (from 2016-2023).
Table 2: Age Distribution of the Demat Accounts that received allotments in IPOs
| Period
(accounts opened) |
Demat Accounts | % of Total Demat Account |
| Prior to 2001 | 59,549 | 1% |
| 2001-2005 | 1,50,916 | 2% |
| 2006-2010 | 6,77,814 | 7% |
| 2011-2015 | 5,59,949 | 6% |
| 2016-2020 | 35,22,180 | 37% |
| 2021-2023 | 45,69,624 | 48% |
| Grand Total | 95,40,032 | 100% |
For this study, the investors are categorized in two different ways:
a. IPO Categorisation (Category 1): Retail, NII, QIB, Anchor, Shareholder and Employee
b. Shareholding Categorisation (Category 2): Individuals, FPI, Mutual Fund, Banks, Corporates and others
4. METHODOLOGY
- For this study, the descriptive analysis technique has been used. In order to aggregate the results across the IPOs, the weighted average methodology has been used. The weights are assigned based on the amount allotted to a particular category in that IPO. Therefore, the IPO Categories with higher issue size have higher weightage.
- Weighted Average method is considered as it reflects the broader market trends, when the data has outliers.
- The term “exit” in this study refers to the percentage of shares sold (in value terms) compared to the total allotment received in value terms).
- Exit is considered only for the shares allotted in IPOs and not the pre-existing shares. Therefore, for this study, ‘exit per cent’ can be understood as ‘per cent of allotted shares sold in value terms’
- Exit is considered in terms of per cent of shares sold at the acquisition cost (irrespective of selling price).
- The exit on selected days’ post listing is a cumulative figure.
- The computation is illustrated with following example-
Table 3: Illustration of Weighted Average methodology used in the study
| Investor Name |
Allotment to Retail Category (shares) | Issue Price (in ₹) |
Allotment amount (in ₹) |
Shares Exited after 1 week | Amount Sold at Acquisition Cost (in ₹) |
Exit (in percent) |
| (A) | (B) | (C) = (A)*(B) | (D) | (E) = (D)*(B) | (D)/(A) | |
| IPO A | 20 | 100 | 2000 | 10 | 1000 | 50% |
| IPO B | 20 | 50 | 1000 | 20 | 1000 | 100% |
| IPO C | 100 | 40 | 4000 | 10 | 400 | 10% |
| Total | ₹ 7,000
(x1) |
₹ 2,400
(x2) |
53.3
(Average) |
- Suppose there are three IPOs viz. A, B and C and they have made allotment of ₹ 2000, ₹ 1,000 and ₹ 4,000, respectively, to retail category investors. Out of those, suppose shares worth ₹ 1,000, ₹ 1,000 and ₹ 400, respectively, are sold within a week. Then the exit for retail investors is considered as ₹ 2,400 shares are sold out of the total ₹ 7,000 shares allotted to them. So the percent exit comes to 34.3 per cent exit.
- The formula for computing weighted average is as follows:
| Per cent of shares sold in retail category = | Total amount sold at acquisition cost (x2)
Total allotment to Retail category (xl) |
=2,400/7,000
=34.3 per cent
- While the simple average calculation shows exit as 53.3 per cent, the weighted average shows it as 34.3 per cent. The weighted average is a relatively a better measure of ‘overall exit’ in value terms as it assigns more weightage to the IPOs with higher allotment value.
- If an investor sells his/her IPO shares once, it is considered exit even if he/she repurchases them after some days. However, if he/she exited and repurchased shares, within the six intervals considered (say between 3 months and 6 months window), then those shares not considered as exited.
- In our sample, the last IPO considered is as of December 31, 2023, whereas the holding data from depositories is considered until January 20, 2024 (cut-off date). Therefore, few IPOs, did not complete 1 month, 3 months, 6 months or 1 year timeframes and hence data for these periods was not available for the computation of exits.
No of companies available at different timeframes in our data for this study is as follows,
| LD | 1W | 1M | 3M | 6M | 1Y | |
| Number of companies available at different time frames | 144 | 144 | 135 | 121 | 98 | 87 |
It may be noted that this reduced sample size in the subsequent periods (from 1 month onwards) has altered the weights assigned in the subsequent periods. For instance, it is possible to have lower “weighted average of cumulative exits” in subsequent timeframes, if the ‘high value’ and ‘high weightage’ observation is not available later, resulting in giving more weightage to ‘low value’ observation. This was observed in case of Banks in our study sample. In this regard, relevant footnote has also been provided below the chart.
5. DATA ANALYSIS AND FINDINGS
5.1. Exit Pattern of IPO Allottees
5.1.1. Results as per Category 1 (Basis of Allotment)
- Guidelines for allotment of shares in IPOs are prescribed in SEBI ICDR Regulations, 2018.
- Eligibility under Regulation 6(1) (Profitability Route)- For companies satisfying net-worth and profitability criteria (i.e. companies that are eligible for IPOs as per regulation 6(1) of SEBI ICDR, 2018), the minimum allotment to Retail and NII is 35 per cent and 15 per cent, respectively. Out of 144 IPOs, 101 IPOs were listed through this route.
| Allotment category | Reservation |
| RETAIL | At least 35 per cent |
| NII (Non Institutional Investors) | At least 15 per cent |
| QIB (Qualified Institutional Buyers) | Not more than 50 per cent |
- Eligibility under Regulation 6(2) (Alternate Route)- For companies not satisfying net-worth or profitability criteria (i.e. companies getting eligible through alternate route as per regulation 6(2) of SEBI ICDR, 2018), the maximum allotment to Retail and NII is 10 per cent and 15 per cent, respectively. Most of the companies falling under this route are the new-age technology companies. Out of 144 IPOs, 43 IPOs were listed through this route.
| Allotment category | Reservation |
| RETAIL | Not more than 10 per cent |
| NII | Not more than 15 per cent |
| QIB | At least 75 per cent |
- In our sample, 21.9 per cent of the total shares were allotted to the Retail category, whereas QIBs received 64.6 per cent of shares allotted (in value terms). NII accounted for 12.4 per cent of total allotments
Chart 2: Share of allotment under different categories (category 1)
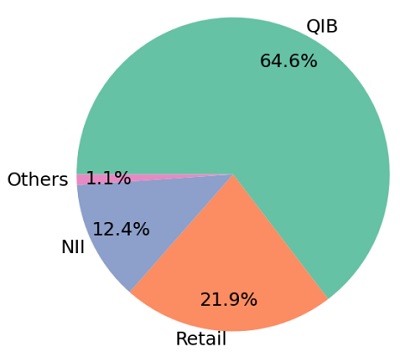
Note: Others include Shareholders, Employees
- It was observed that 42.7 per cent shares allotted to Retail shareholders were sold within a week. NIIs (HNIs + Corporates) exited 63.3 per cent of the shares allotted to them within a week.
Chart 3: Exit Pattern of Investors (per cent of shares sold in value terms)
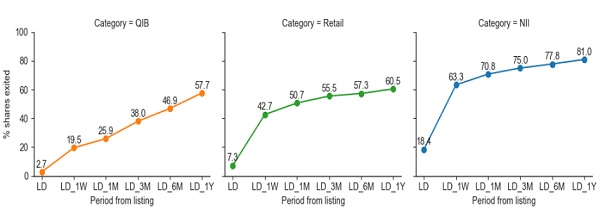
Note: % of shares exited – % of shares sold in value terms.
- Institutional Investors (or QIBs) exited 19.5 per cent of the allotted shares within a week. This was primarily because the Anchor Investors holding
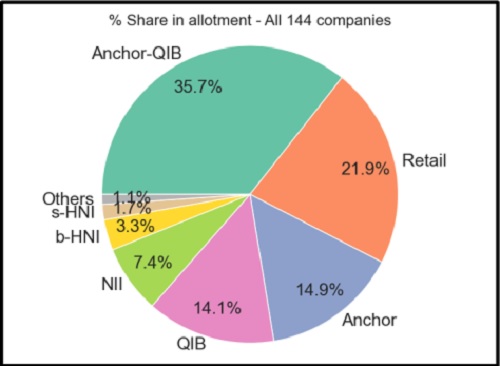
- Since the QIB category was the largest category, it was further sub-categorised into a)”Exclusive Anchor”, b) “Exclusive QIB” (or non-Anchor QIB), and c) “Anchor – QIB”7 (both anchor as well as QIB).
- Exclusive QIB and Exclusive Anchor accounted for 14.1 per cent and 14.9 per cent of the total allotments, respectively. Anchor-QIB accounted for 35.7 per cent of total allotments.
- It was observed that “Exclusive QIB” category investors sold their shares faster than the other categories. This category was observed exiting 65.4 per cent of the shares allotted to them within a week and 87.8 per cent shares within a year of listing. Detail are given at Annexure 7.2.
- Excluding anchor investors, it was observed that 53.9% of IPO shares (in value terms) were sold within a week and 72.6% within a year.
Chart 4: Exit Pattern of Investors (excluding Anchor Investors)
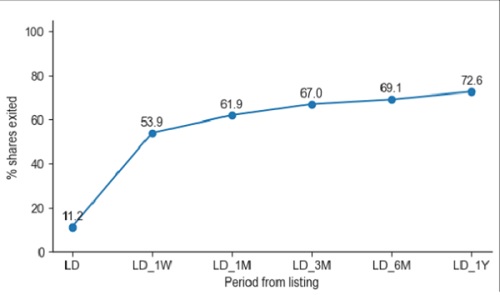
Notes: The exits are considered after excluding Anchor Investors from the sample; % of shares exited – % of shares sold in value terms;
5.1.2. Results as per Category 2 (Basis of Holding)
- It was observed that about 37.7 per cent of the total shares were allotted to FPIs, followed by Individuals (31.9 per cent), Mutual Funds (16.0 per cent), Corporates (5.2 per cent), Insurance and Pension funds (3.8 per cent) and Banks (3.6 per cent).
Chart 5: Share of allotment under different categories (Category 2)
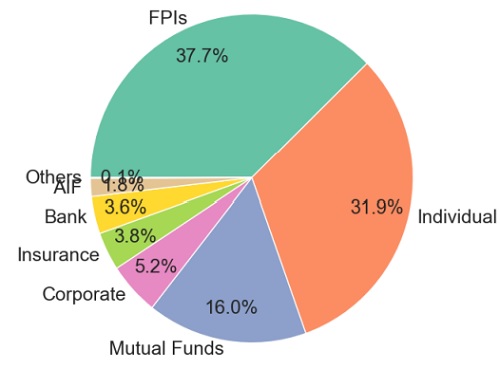
Note: “Others” include Clearing Members, Underwriters, etc
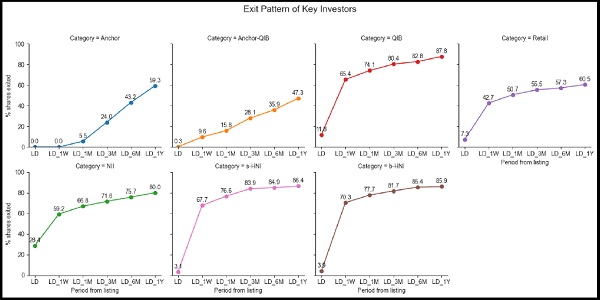
- It was observed that 50.2 per cent of the shares allotted to Individual investors were sold within a week, whereas 79.8 per cent shares allotted to banks were sold within a week. The mutual funds tend to stay invested for a longer time, exiting just about 3.3 per cent within a week and exiting less than a third of the allotted shares after 1 year. The chart below shows the exit pattern of key investors (viz FPIs, Mutual Funds and Individuals).
Chart 6: Exit Pattern of Key Investors (per cent of shares exited in value terms)
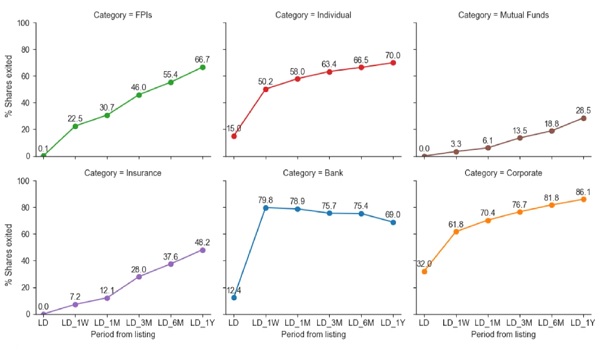
Note: % of shares exited – % of shares sold in value terms; The declining trend in exits in case of banks is due to changes in the weights as some companies are dropped out since they did not complete 1M, 3M, 6M, or 1Y (details in methodology).
5.2. Exit compared to Listing Gain / IPO Performance
5.2.1. Correlation Between Percentage Exit and Listing Gain
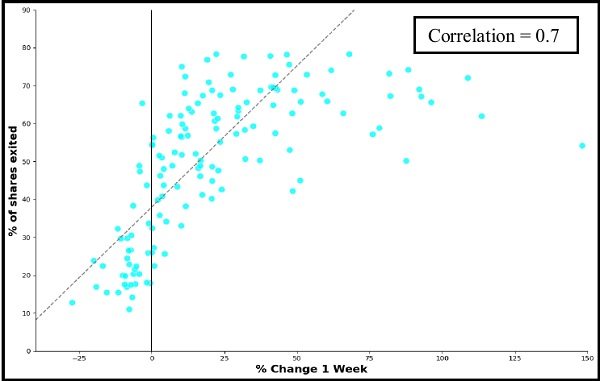
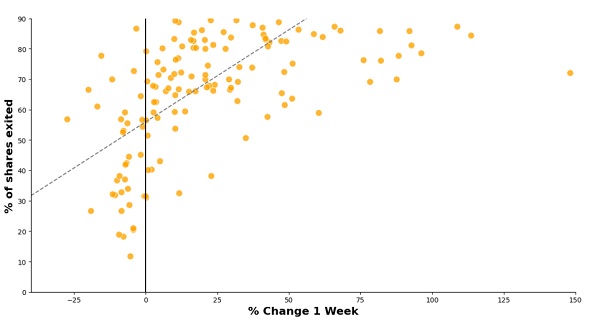
- A positive correlation was observed between first week listing gain and percentage of shares exited within a week by Retail and NII category investors. Exit pattern of NII investors are given at Annexure 7.3.
Chart 7: Exit of Retail Investors vs Listing Gain
5.2.2. Summary of exit by different category investors (compared to IPO Performance)
- When returns were high, exit by Retail, NII and QIB category investors was higher than their respective averages. The IPOs which witnessed a gain of more than 20 per cent within a week (considered as very high return IPOs), witnessed NIIs exiting 79.1 per cent of their shares within a week (compared to average exit of 63.3 per cent). Similarly, Retail investors exited 61.9 per cent shares, when returns were very high (compared to average exit of 42.7 per cent)
Chart 8: Per cent of shares exited within a week as per Category1 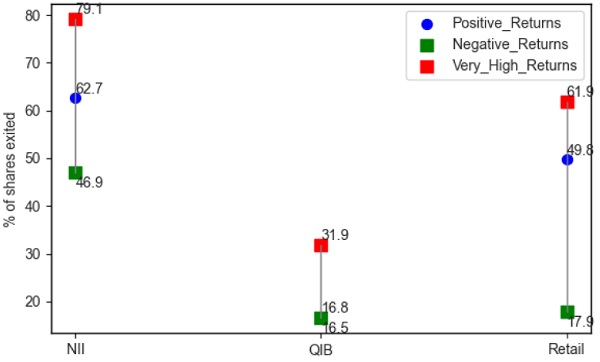 (Compared to returns generated in 1 week)
Note: Very High Returns – IPOs where first week returns is greater than 20 per cent; % of shares exited – % of shares sold in value terms.
- In case of “Category 2”, similar pattern was observed. Individuals exited 67.6 per cent shares within a week, when returns were very high and exited just about 23.3 per cent, when returns were negative.
Chart 9: Per cent of shares exited within a week as per Category2 (Compared to returns generated in 1 week)
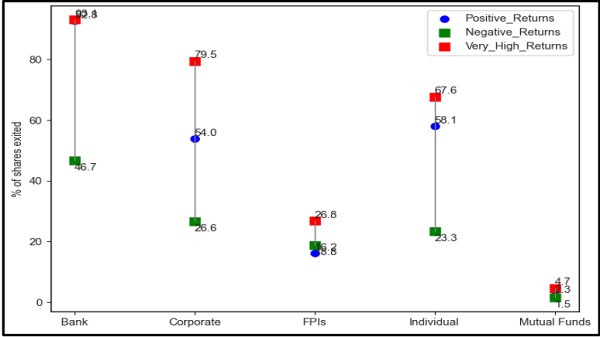
Note: Very High Returns – IPOs where first week returns is greater than 20 per cent; % of shares exited – % of shares sold in value terms.
5.3. Exit compared to Issue size, Type of issue and level of subscription
5.3.1. On the basis of Issue Size
- It was observed that FPIs, Individual and Mutual Funds exited more in issues having issue size less than ₹ 1,000 crore. This exit is more pronounced in the case of Individuals.
Chart 10: Exit of Key Investors on the Basis of Issue Size (in per cent)
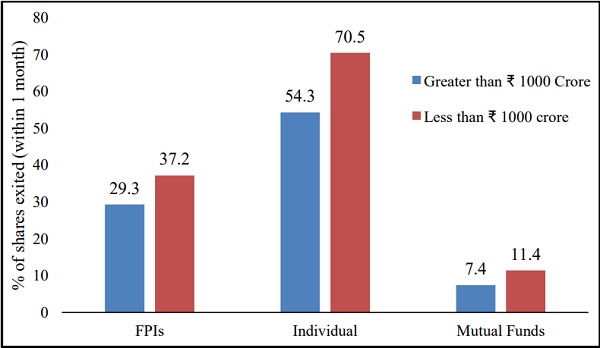
Note – % of shares exited – % of shares sold in value terms.
5.3.2. On the basis of Type of Issue
- It was observed that the exit of key category investors was nearly same when the issue type is either fresh issue or Investor seller issue.
- However, FPIs and Individuals displayed contrasting behavior in cases where Promoters offloaded their shares in IPO. FPIs exited more in ‘Promoter seller’ IPOs than other types and Individuals exited less in ‘Promoter seller’ IPOs than other types.
Chart 11: Exit of Key Investors on the Basis of Type of Issue (in per cent)
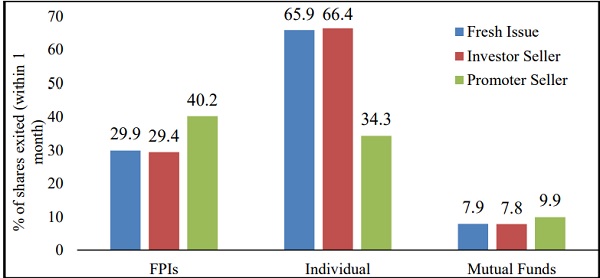
Note: In the dataset, out of 144 IPOs, there are 45 IPOs defined as OFS8. Out of which, 33 are categorized as investor selling IPOs and 12 are categorized as promoter selling IPOs; % of shares exited – % of shares sold in value terms.
5.3.3. On the basis of Level of Subscription
- During the period under the study, as many as 92 issues were oversubscribed by more than 10 times.
Table 4: Level of Over-subscription in IPOs
| No of times subscribed |
No of IPOs | Listing Day Returns (Median) |
| Greater Than 100x | 17 | 82% |
| 10x-100x | 75 | 22% |
| 5x-10x | 10 | 10% |
| 1x-5x | 40 | -2% |
| Undersubscribed | 2 | 2% |
- A positive association was observed between IPO subscription, listing day returns, and exit of investors (in terms of percentage of shares sold in value terms). Higher subscription was associated with higher listing day returns (Table 4) and in turn higher exit by investors (Chart 12). For Individuals, the exit from IPOs roughly doubled from the oversubscribed IPOs in the range 5x-10x, compared to those in the range 1x-5x.
Chart 12: Exit of Key Investors on the basis of level of subscription (in per cent)
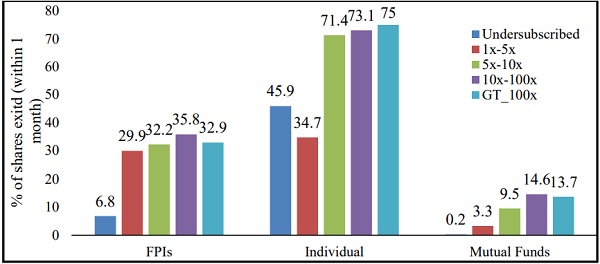
Note- % of shares exited – % of shares sold in value terms.
5.4. Buyers and Sellers
5.4.1. Gross Selling on the Listing Day
- In this section, the gross amount of shares sold by the sellers on the listing day, across IPOs, was analysed.
- It was found that out of all the shares sold (in value terms) on the listing day, Individuals sold 54.3 per cent, followed by Corporates (19.9 per cent). Banks contributed 15.2 per cent to the gross selling on listing day
Chart 13: Distribution of Gross Amount Sold on Listing Day
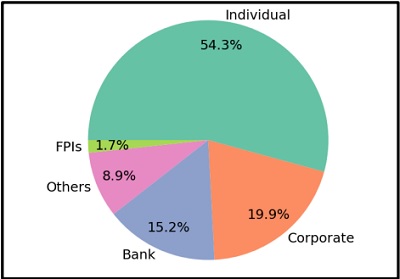
Note: This is an approximate estimate. Gross amount sold is computed as (shares sold on listing day) * (listing price). Listing price is considered for approximation (instead of exact sell price for each investor). Others include Clearing Member, Underwriters, etc.
5.4.2. Net Buying and Selling within 1 Week of Listing
- In this section, net buying and net selling are computed by comparing holding of investors pre-listing (LD – 1 day) and one week after listing (LD + 1 week). Thus, for this section, the Sellers are the IPO investors, whereas the Buyers are those who bought shares in the secondary market post listing.
- It was found that during the first week of listing, Individuals were net sellers, whereas Mutual Funds were net buyers. In the first week, Individuals sold shares worth about ₹ 15,000 crore across IPOs, while Mutual Funds bought about the same amount of shares. Banks and Corporates were also net sellers in the first week of listing.
Chart 14: Buyers and Sellers on first week of listing (in ₹crore)
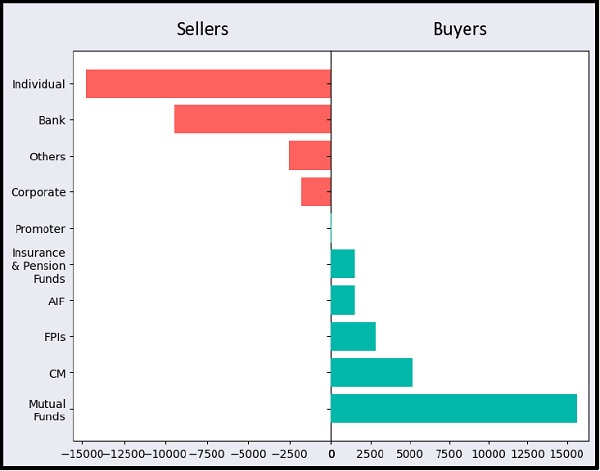
Note:
1. This is an approximate estimate. Gross amount sold is computed as (shares sold within 1 week) * (listing price). Listing price is considered for approximation (instead of exact sell price for each investor).
2 The CM (Clearing Member) buying represents shares in transit (to be delivered to Beneficial Owners).
3. Others include trusts, underwriters
5.5. Observations post Policy Changes
Some of the key policy changes implemented w.e.f. April 01, 2022 are as follows: SEBI:
1. Lottery based allotment for NII – Earlier, in case of oversubscription, the shares in NII category were allotted on the pro-rata basis. It simply means, if an IPO is oversubscribed, people applying for a higher amount of shares will get more shares. From April 1, 2022, the pro-rata or proportionality based allotment method was changed to a lottery system, similar to Retail category.
2. NII Category subdivided into Small-NIIs and Big-NIIs – As per ICDR regulations, NII category as a whole has 15 per cent reservation in IPOs. From April 1, 2022, this category was further sub-classified into s-NII (5 per cent quota) and b-NII (10 per cent quota). s-NII are defined as the NIIs having application size between ₹ 2 lakh and ₹ 10 lakh, whereas b-NIIs are defined as NIIs having application size more than ₹ 10 lakh. The reservation under s-NII category is one-third of the portion available to NII and remaining two-third reservation is for b-NII category.
3. Lock-in of Anchor investors changed: The existing lock-in of 30 days will continue for 50 per cent of the portion allocated to anchor investors and for the remaining portion, a lock-in of 90 days from the date of allotment will be applicable.
RBI
1. Ceiling on IPO funding by RBI9– RBI restricted IPO funding by NBFC upto ₹ 1 crore per borrower.
Following sections present observations post such policy interventions.
5.5.1. Observations on high value NII Applications
- The number of “Big Ticket”10 NII investors has dropped significantly from April 2022 onwards. Prior to April 2022, the average number of NIIs applications (application size more than ₹ 1 crore) per IPO per quarter, ranged between 229 and 747. Post the policy interventions, this range decreased to between 2 and 29 average “Big Ticket” applications per quarter.
- Average number of IPO applications by “Big Ticket NII Investors” (applying for more than ₹1 crore in IPOs) declined from around 626 applications per IPO in pre-period (April 21-Mar 22) to 20 applications per IPO in the post period (April 22-Dec 23).
Chart 15: Average No of Applications per IPO (value more than 1 crore)
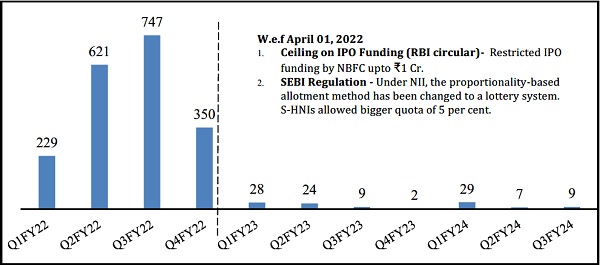
No of IPOs in each quarter:
| 5 | 18 | 24 | 3 | 12# | 4 | 18 | 4 | 4 | 23 | 28 |
Note:# Excluded LIC IPO because the SEBI policy change was not applicable to it
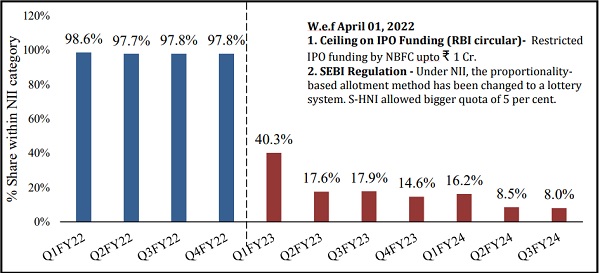
- Prior to April 2022, the “Big Ticket” investor’s application size represented 98 per cent of total NII Category applications (in value terms). Post policy changes, their proportion has dropped to 40 per cent in Q1 FY23 and further to 8 per cent in Q3 FY24.
Chart 16: Share of ‘Big Ticket’ Investors in NII Category
- In scenarios of anticipated large oversubscription under the new rule, prospect of larger share allotments does not improve with a larger application amount. Instead, only the basic lot size, representing shares valued just above ₹2 Lakh, is allotted to NII investors. This policy change diminishes the incentive for applicants to submit higher application amounts for obtaining more number of shares, in cases of oversubscription.
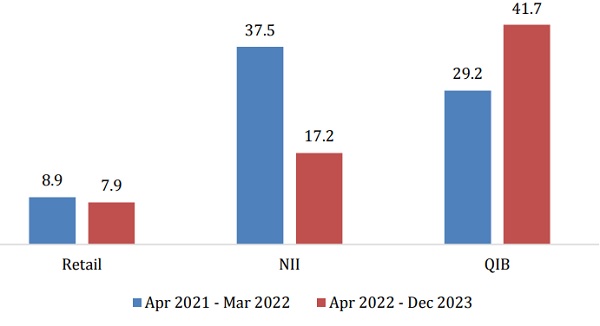
5.5.2. Observations on Oversubscription
- The amount of over subscription in NII category dropped from 37.5 times during Apr 2021- Mar 2022 to 17.2 times during Apr 2022- Dec 2023.
Chart 17: Category-wise Oversubscription (No of times)
5.5.3. Observations on Exit of “Big Ticket” investors
- Prior to April 2022, the percentage of shares exited was higher for “Big Ticket” NII investors wherein about 70 per cent of allotted value of shares exited within a week. Post April 2022, the exit by “Big Ticket” NII investors have subsided (in the range of 14-26 per cent).
Chart 18: Exit Pattern of NII Investors– Based on Application Size
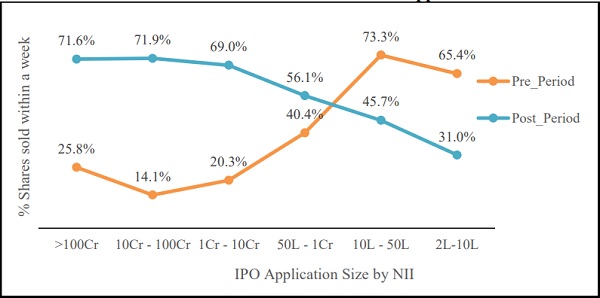
Note: Pre_Period: Apr21- Mar22
Post_Period: Apr22- Dec23
5.5.4. Observations on Exit of “Exclusive Anchor”11 investors
- For issues opening after April 1, 2022, the anchor investors could sell maximum 50 per cent of allotted shares after 1 month. The remaining 50 per cent can be sold only after 3 months.
- The exit of anchor investors reduced by 2.2 percentage points (i.e. from 6.5 per cent exit in pre-period to 4.3 per cent exit in post-period) after 30 days and by 10.4 percentage points (i.e. from 28.3 per cent exit in pre-period to 17.9 per cent exit post-period) after 90 days. Pre-Period refers to the period prior to April 2022 (Apr 21- Mar 22) while Post-Period refers to the period starting April 2022 (Apr 22- Dec 23)
Chart 19: Impact of Policy change on “Exclusive Anchor” Investor Exit (in %)
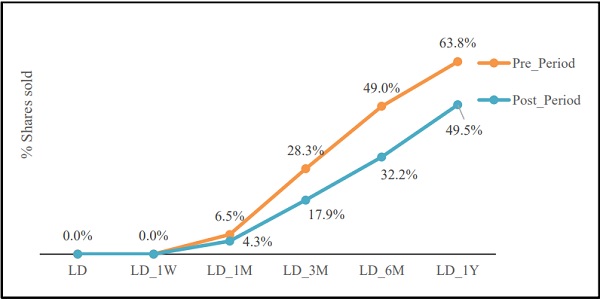
Note: Pre_Period: Apr21- Mar22
Post_Period: Apr22- Dec23
5.6. Brokers’ concentration in IPO Market
- Post policy change, the brokers’ concentration has reduced significantly. In NII category, the share of top 5 brokers declined to 21.1 per cent in Apr22-Dec23 period, from 58.1 per cent in Apr21-Mar22.
Table 5: Top 5 brokers share in IPO market (in per cent)
| Year | Retail | NII |
| Apr 21- Mar 22 | 41.8 | 58.1 |
| Apr 22- Dec 23 | 37.5 | 21.1 |
5.7. Off market transfers
- IPO shares worth around ₹ 5,300 crore (2.7 per cent of the total shares allotted to IPO shareholders) were transferred off-market within a period of 3 months.
- Of these shares, 95 per cent were transferred to a self /family account.
- Out of 144 IPOs, 87 IPOs had completed 1 year as on January 31, 2024.
- The total number of shareholders in these IPOs dropped significantly on listing date and two days post listing. The total number of shareholders remained stable after 1 month.
Chart 20: Total Number of Individual Shareholders Post Listing (in crore) (grossed across 87 IPOs)
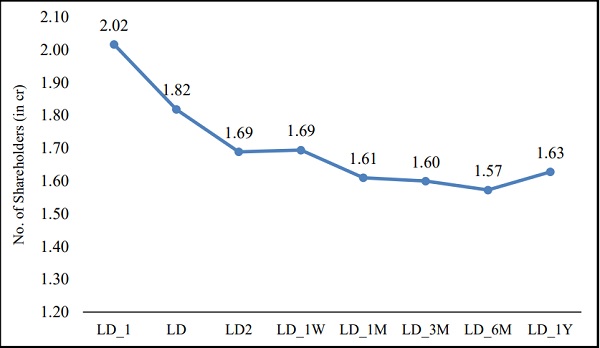
Note: 1. No of shareholders are grossed across IPOs
2. Data for 87 IPOs which completed one year as on January 31, 2024 are considered for this analysis
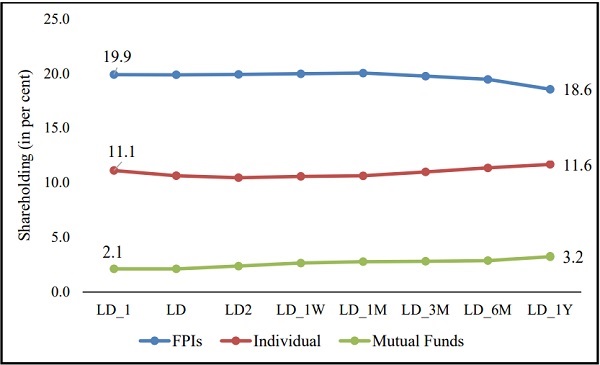
- In value terms, the shareholding pattern didn’t change significantly. The percentage share of the FPI category dropped by 1.3 percentage point from 19.9 per cent pre-listing(post allotment) to 18.6 per cent after 1 year. On the contrary, the percentage share of the Mutual Funds increased by 1.1 percentage points from 2.1 per cent pre-listing(post allotment) to 3.2 per cent after 1 year.
Chart 21: Shareholding Pattern of key categories post listing (in percent)
******
6. ANNEXURES
6.1. Geographical distribution of Retail and NII investors
–
Note: Based on limited sample of 80 companies that came up with IPO in FY23-FY24.
Since QIB category was the largest category with 64.7 per cent total allotment going to QIB, this category was further categorized into Exclusive Anchors, Exclusive QIB (Non-Anchor) and Anchor-QIB. Exclusive QIB and Exclusive Anchor accounted for 14.1 per cent and 14.9 per cent of the total allotments, respectively. Anchor-QIB accounted for 35.7 per cent of total allotments. Retail accounted for 21.9 per cent of total allotments. NII accounted for 10.2 per cent of total allotments
Note: QIB means “exclusive QIB”; Anchor means “exclusive Anchor”.
The data shows that “Exclusive QIB” exited faster than the other categories (1 week exit – 65 per cent and 1 year exit – 88 per cent).
Note: For this chart- QIB means “exclusive QIB”; Anchor means “exclusive Anchor”.
*******
Notes:
1 NII – Refers to category of IPO investors other than a retail individual investor and qualified institutional buyer (QIB). QIB means institutional buyers as defined in the section 2(1)(ss) of SEBI ICDR Regulations, 2018, including Mutual Funds, FPIs, Scheduled Commercial Banks, Public Financial Institutions, etc.
2 Retail – Refers to category of IPO investors who apply for less than Rs 2 lakh worth of shares in a public issue.
3 The disposition effect refers to the tendency to prematurely sell assets that have made financial gains, while holding on to assets that are losing money.
4 Unless otherwise specified, FY24$ mentioned in the study would mean the period from April 2023 to December 2023.
5 The exiting or selling shareholders are out of successful allottees.
6 This is only for those who received allotment.
7 Anchor – QIB refers to the category of investors applying both in Anchor book (pre issue open) as well as QIB book (post issue open).
8 Offer for Sale IPOs, in this study, are defined as those IPOs having at least 90 per cent of issue size as Offer for Sale. Under OFS, if the majority is promoters who are selling then it is categorized as promoter selling IPOs, otherwise it is investor selling IPO.
9 Please refer to the circular RBI/2021-22/112DOR.CRE.REC.No.60/03.10.001/2021-22 dated October 22, 2021 (https://rbidocs.rbi.org.in/rdocs/Notification/PDFs/NT1127AD09AD866884557BD4DEEA150ACC91A.PDF )
10 For this study, “Big Ticket” investors are defined as those non institutional investors applying for more than ₹1 crore in IPOs.
11 Exclusive Anchor –the Anchor investors, who didn’t apply in QIB (Non-Anchor) quota. Exclusive anchorsreceived 21.4 per cent allotment during the study period.


