“The King (i.e., the State) shall promote trade and commerce by setting up trade routes by land and by water, and establishing market towns and ports” –
Kautilya’s Arthashastra, 4th century B.C.
Ease of doing business is key to entrepreneurship, innovation and wealth creation. India has risen significantly in the World Bank’s Doing Business rankings in recent years, but there are categories where it lags behind – Starting a Business, Registering Property, Paying Taxes and Enforcing Contracts. This chapter focuses on these parameters and compares India’s performance with both its peers and with the best-in-class. For example, registering property in Delhi and Mumbai takes 49 and 68 days respectively, while it takes 9 days in China and 3.5 days in New Zealand. These performance matrices provide a measure of the scope for improvement. The chapter then explores the density of laws, rules and other statutory compliance requirements faced by a manufacturing or services business (specifically the restaurants segment).
Export competitiveness depends not only on the cost of production but also on the efficiency of logistics. A series of case studies are used to analyse the time taken at each stage for specific merchandise items to travel from factory gate to the warehouse of the foreign customer. For instance, a study found that an apparels consignment going from Delhi to Maine (U.S.) takes roughly 41 days, but 19 of these are spent within India due to delays in transportation, customs clearance, ground handling and loading at sea-ports. A study of carpets exports from Uttar Pradesh to the United States also showed similar results. The process flow for imports, ironically, is more efficient than that for exports! In contrast, however, the imports and exports of electronics through Bengaluru airport was found to be world class. The processes of Indian airports should be adapted and replicated in sea-ports.
INTRODUCTION
6.1 As India leapfrogs towards a five trillion-dollar economy by 2024-25, simplifying and maintaining a business-friendly regulatory environment is essential. To ease the constraints and gaps in the regulatory processes involved in doing business, it is necessary to assess the country’s progress vis-à-vis other leading economies on various parameters.
6.2 India has made substantial gains in the World Bank’s Doing Business rankings from 142 in 2014 to 63 in 2019. It has progressed on seven out of the 10 parameters.The Goods and Service Tax (GST) and the Insolvency and Bankruptcy Code (IBC) top the list of reforms that have propelled India’s rise in rankings. The trajectory of India’s performance over the last decade is shown in Table 1.
6.3 However, India continues to trail in parameters such as Ease of Starting Business (rank 136), Registering Property (rank 154), Paying Taxes (rank 115), and Enforcing Contracts (rank 163). It takes roughly 58 days and costs on an average 7.8 per cent of a property’s value to register it, and 1,445 days for a company to resolve a commercial dispute through a local first-instance court. These figures are longer in time and often greater in cost than OECD high-income economies, and therefore, impede wealth creation.
6.4 This chapter analyses India’s performance in the parameters used in Doing Business reports, and compares it to its peers as well as to the best-in-class countries like New Zealand, which has been ranked number one over the past several years.
Table 1: Capturing India’s decade-long journey in the Doing Business Rankings
| Parameters | 2009 | 2010 | 2011 | 2012 | 2013 | 2014 | 2015 | 2016 | 2017 | 2018 | 2019 |
| Ease of starting a business | 169 | 165 | 166 | 173 | 179 | 158 | 155 | 155 | 156 | 137 | 136 |
| Dealing with construction permits | 175 | 177 | 181 | 182 | 182 | 184 | 183 | 185 | 181 | 52 | 27 |
| Getting electricity |
– | – | 98 | 105 | 111 | 137 | 70 | 26 | 29 | 24 | 22 |
| Registering your property | 93 | 94 | 97 | 94 | 92 | 121 | 138 | 138 | 154 | 166 | 154 |
| Getting credit for your business | 30 | 32 | 40 | 23 | 28 | 36 | 42 | 44 | 29 | 22 | 25 |
| Protecting minority investors |
41 | 44 | 46 | 49 | 34 | 7 | 8 | 13 | 4 | 7 | 13 |
| Paying taxes | 169 | 164 | 147 | 152 | 158 | 156 | 157 | 172 | 119 | 121 | 115 |
| Trading across borders | 94 | 100 | 109 | 127 | 132 | 126 | 133 | 143 | 146 | 80 | 68 |
| Enforcing contracts | 182 | 182 | 182 | 184 | 186 | 186 | 178 | 172 | 164 | 163 | 163 |
| Resolving insolvency | 138 | 134 | 128 | 116 | 121 | 137 | 136 | 136 | 103 | 108 | 52 |
| Overall Rank | 133 | 134 | 132 | 132 | 134 | 142 | 130 | 130 | 100 | 77 | 63 |
Source: Doing Business database, World Bank.
6.5 In addition, this chapter presents several case studies and surveys that were conducted to capture the on-ground experience of doing business in the country including the logistics of merchandise exports and imports, the number of permissions needed to set up a restaurant and so on. This allows a close look at the nuts-and-bolts of the business environment. Case studies of merchandise exports found that logistics is inordinately inefficient in Indian sea-ports. The process flow for imports, ironically, is more efficient than that for exports. Although one needs to be careful to directly generalise from specific case studies, it is clear that customs clearance, ground handling and loading in sea ports take days for what can be done in hours. A case study of electronics exports and imports through Bengaluru airport illustrates how Indian logistical processes can be world class. The main goal of the chapter, therefore, is to help the reader to identify the most crucial issues when evaluating Ease of Doing Business (EoDB) in India beyond the approach taken by the World Bank’s surveys.
GLOBAL COMPARISONS
6.6 In this section, India’s performance has been compared with its peers (China, Brazil & Indonesia) as well as the best-in-class economy in EoDB, i.e., New Zealand. In the interest of brevity, the comparisons are limited to how India fared over the decade from 2009 to 2019 across only those parameters of EoDB where India lags, namely- Starting a Business, Registering Property, Paying Taxes, and Enforcing Contracts. The comparisons demonstrate the gap that India needs to travel to achieve the best international standards.
6.7 The number of procedures required to set up a business in India, for example, has reduced from 13 to 10 over the past ten years (Table 2). Today, it takes an average of 18 days to set up a business in India, down from 30 days in 2009. On the other hand, New Zealand has a seamless process of business incorporation which takes place through a single window via one agency. It just takes half-a-day with a single form and minimal cost to set up a business in New Zealand. Although, India has significantly reduced the time and cost of starting a business, a lot more is needs to be done. Some further simplification of processes in India has been implemented very recently but it is too early to gauge its impact.
6.8 Property registration is another interesting example. It takes nine procedures, at least 49 days, and 7.4-8.1 per cent of the property value to register one’s property in India. Moreover, the number of procedures, time and cost have increased over the last 10 years. Meanwhile, New Zealand has only two procedures and a minimal cost of 0.1 per cent of the property value.
6.9 In the case of paying taxes, even though the number of payments per year has significantly reduced in India from 59 to 12 over the last decade, time spent on this activity has not reduced much. While India takes 250-254 hours per year to pay taxes, New Zealand spends just 140 hours a year. Interestingly, time spent to pay taxes in New Zealand has doubled from 2009 to 2019.
6.10 Enforcing contracts is one parameter in which India’s performance has been very poor over the years. While India takes 1,445 days to resolve an average dispute, New Zealand takes approximately one-seventh of it, i.e., 216 days. The previous Economic Survey1 had argued that the single biggest constraint to ease of doing business in India is its inability to enforce contracts and resolve disputes. Given the potential economic and social multipliers of a well-functioning legal system, this may well be the best investment India can make.
6.11 When compared to the performance of India’s peer nations, namely China, Brazil, and Indonesia, on the same parameters, it can be seen that China fares much better than India on virtually all parameters (Table 3).
6.12 The comparisons with other nations is not so one-sided. An entrepreneur has to go through 10 procedures to set up a business in India taking 17-18 days to do so. On the other hand, Indonesia and Brazil require one extra process than India to open a business.
Table 2: Mapping New Zealand across EODB parameters where India struggles
|
India |
New Zealand | |||
| 2009 | 2019 | 2009 | 2019 | |
|
Starting a Business |
||||
| Number of Procedures | 13 | 10 | 1 | 1 |
| Time–No. of days | 30 | 17/18* | 1 | 0.5 |
| Cost (% of income per capita) | 66.1 | 5.3/ 9.3* | 0.4 | 0.2 |
|
Registering Property |
||||
| Number of Procedures | 5 | 9 | 2 | 2 |
| Time–No. of days | 44 | 49/ 68* | 2 | 3.5 |
| Cost (% of property value) | 7.4 | 8.1/ 7.4* | 0.1 | 0.1 |
|
Paying Taxes |
||||
| Number of Payments | 59 | 10/ 12* | 8 | 7 |
| Time (hours per year) | 271 | 250/ 254* | 70 | 140 |
| Total tax payable (% of gross profit) | 64.7 | 49.7# | 32.8 | 34.6 |
|
Enforcing Contracts |
||||
| Time–No. of days | 1,420 | 1,445 | 216 | 216 |
| Cost (% of debt) | 39.6 | 31 | 22.4 | 27.2 |
Source: Doing Business database, World Bank.
*: Denotes values for Delhi/ Mumbai as these are the two centres covered by World Bank for India.
#: Before India reduced its Corporate tax rate from 30 to 25 per cent.
Table 3: India v/s Peers on EODB Parameters (2019)
| India | China | Brazil | Indonesia | |
| 2009 | 2019 | 2009 | 2019 | |
|
Starting a Business |
||||
| Number of Procedures | 10 | 4 | 11 | 11 |
| Time–No. of days | 17/18* | 9 | 17 | 13 |
| Cost (% of income per capita) | 5.3/ 9.3* | 1.1 | 4.2 | 5.7 |
|
Registering Your Property |
||||
| Number of Procedures | 9 | 4 | 14 | 6 |
| Time–No. of days | 49/ 68* | 9 | 31 | 31 |
| Cost (% of property value) | 8.1/ 7.4* | 4.6 | 3.6 | 8.3 |
|
Paying Taxes |
||||
| Number of Payments | 10/ 12* | 7 | 10 | 26 |
| Time (hours per year) | 250/ 254* | 138 | 1,501 | 191 |
| Total tax payable (% of gross profit) | 49.7# | 59.2 | 65.1 | 30.1 |
|
Enforcing Contracts |
||||
| Time–No. of days | 1,445 | 496 | 801 | 403 |
| Cost (% of debt) | 31 | 16.2 | 22 | 70.3 |
| Overall Doing Business Rank | 63 | 31 | 124 | 73 |
Source: World Bank Doing Business Report, 2020.
Note: India numbers are for Delhi/Mumbai respectively, as these are the two centres covered by World Bank for India.
#: Before India reduced its Corporate tax rate from 30 to 25 per cent.
While Indonesia takes four days less than India, Brazil takes almost the same time as India to do so. In fact, countries like Pakistan, Turkey and Sri Lanka (ranked 72, 77, and 85 respectively in Starting a Business parameter) have a less cumbersome process to start a business than India.
6.13 Similarly, while India has five less procedures than Brazil (14) to register one’s property, it takes much less time to do so in Brazil (31 days) than in India (49-68 days). Indonesia, on the other hand, has only six procedures and takes same time as Brazil to register property.
6.14 In case of paying taxes, although Indonesia (26) has more than double the number of payments per year than India (10-12), its citizens spend far less time in paying them than India. Brazil seems to fare particularly poor in this segment.
6.15 India’s performance in contract enforcement is poor even when compared to India’s peer nations. While it takes approximately four years to enforce a contract in India, Brazil and Indonesia spend 2.2 and 1.1 years, respectively to do so. With a rank of 163 out of 190 nations in Enforcing Contracts, only a few countries like Afghanistan, Mozambique, and Zimbabwe perform worse than India.
6.16 A holistic assessment and a sustained effort to ease business regulations and provide an environment for businesses to flourish would be a key structural reform that would enable India to grow at a sustained rate of 8-10 per cent per annum. This requires a nuts-and-bolts approach of feedback loops, monitoring and continuous adjustment. The next section, surveys some of areas where there is scope for significant efficiency gains.
DENSITY OF LEGISLATION AND STATUTORY COMPLIANCE REQUIREMENTS IN MANUFACTURING
6.17 A major challenge most companies face is the complex architecture of the Indian governance framework
Table 4: Applicable Rules and Statutory Laws for Manufacturing
| S. No. | Name of the Act (A) | No. of Sections (B) | No. of Rules, etc. (A+B) |
Total |
| 1. | Apprentices Act, 1961 | 37 | 14 | 51 |
| 2. | Air (Prevention & Control of Pollution) Act, 1981 | 54 | – | 54 |
| 4. | Central Excise Act, 1944 | 40 | 90 | 130 |
| 5. | Central Excise Tariff Act, 1985 | 5 | – | 5 |
| 6. | Central Sales Tax Act, 1956 | 26 | 9 | 35 |
| 7. | Companies Act, 2013 | 470 | 19 | 489 |
| 8. | Contract Labour (Regulation and Abolition) Act, 1970 | 35 | 83 | 118 |
| 9. | Customs Act, 1962 | 161 | 53 | 214 |
| 10. | Customs Tariff Act, 1975 | 13 | – | 13 |
| 11. | Depositories Act, 1996 | 31 | – | 31 |
| 12. | Employee Compensation Act, 1923 | 36 | 52 | 88 |
| 13. | Employee State Insurance Act, 1948 | 100 | 211 | 311 |
| 14. | Employment Exchanges (Compulsory Notification of Vacancies) Act, 1959 | 10 | 8 | 18 |
| 15 | Environment (Protection) Act, 1986 | 26 | 88 | 114 |
| 16. | Employee Provident Funds & Miscellaneous Provisions Act, 1952 | 22 | 156 | 178 |
| 17. | Equal Remuneration Act, 1976 | 18 | 6 | 24 |
| 19. | Factories Act, 1948 | 120 | 128 | 248 |
| 20. | Foreign Exchange Management Act, 1999 | 49 | 102 | 151 |
| 21. | Foreign Trade (Development & Regulation) Act, 1992 | 20 | 18 | 38 |
| 22. | Finance Act, 1994 | 36 | 43 | 79 |
| 23. | Guidelines of Department of Scientific and Industrial Research | – | 6 | 6 |
| 24. | Income Tax Act, 1961 | 298 | 125 | 423 |
| 25. | Indian Stamp Act,1899 | 78 | 22 | 100 |
| 26. | Indian Boiler Act,1923 | 34 | 626 | 660 |
| 27. | Indian Electricity Act, 2003 | 185 | – | 185 |
| 28. | Indian Wireless Telegraphy Act, 1933 | 11 | 13 | 24 |
| 29. | Indian Standard Code of Practice for Selection, Installation and Maintenance of Portable First Aid Fire Extinguishers | – | 16 | 16 |
| 30. | Industrial Disputes Act,1947 | 40 | 80 | 120 |
| 31. | Industrial Employment (Standing Orders) Act, 1946 | 15 | 22 | 37 |
| 32. | Legal Metrology Act, 2009 | 57 | 64 | 121 |
| 33. | Maternity Benefit Act, 1961 | 30 | – | 30 |
| 34. | Minimum Wages Act, 1948 | 31 | 32 | 63 |
| 35 | Motor Vehicles Act,1988 | 217 | 164 | 381 |
| 36. | Narcotic Drugs and Psychotropic Substances Act, 1985 | 51 | 68 | 119 |
| 37. | Payment of Gratuity Act, 1972 | 15 | 17 | 32 |
| 38. | Patents Act, 1970 | 161 | 139 | 300 |
| 39. | Payment of Wages Act,1936 | 26 | 13 | 39 |
| 40. | Payment of Bonus Act, 1965 | 40 | 5 | 45 |
| 41. | Petroleum Act,1934 | 31 | 202 | 233 |
| 42. | Poisons Act, 1919 | 9 | – | 9 |
| 43. | Securities and Exchange Board of India Act, 1992 | 31 | 334 | 365 |
| 44. | Securities Contract (Regulation) Act, 1956 | 31 | 21 | 52 |
| 45. | Special Economic Zones Act, 2005 | 58 | 6 | 64 |
| 46. | Water (Prevention and Control of Pollution) Act, 1974 | 64 | – | 64 |
| 48. | Water (Prevention and Control of Pollution) Cess Act, 1977 | 17 | 9 | 26 |
| 49. | Shops and Establishment Act | State-wise | State-wise | State-wise |
| 51. | Trade Marks Act,1999 | 159 | 185 | 344 |
| Total | 3,214 | 3,582 | 6,796 |
Source: Federation of Indian Chambers of Commerce and Industry (FICCI).
Note: This is not a comprehensive list and not every rule applies to every manufacturer. It is just an illustration of the wide range of rules that a manufacturer faces. including the density of legislation and statutory compliance requirements. A list containing the names of Acts applicable as well as number of Sections / Rules of such Acts required to be complied with by manufacturing units is given in Table 4. Manufacturing units have to conform with 6,796 compliance items, which is a tedious and time consuming task. It must be noted that this is not a comprehensive list and not every rule applies to every manufacturer. It is just an illustration of the bewilderingly wide range of rules that the sector faces.
STARTING A BUSINESS: REGULATORY HURDLES IN OPENING A RESTAURANT
6.18 The services sector too faces many regulatory hurdles even for routine businesses. The bars and restaurants sector is an important source of employment and growth everywhere in the world. It is also a business that, by its nature, faces a high frequency of starting new businesses and shutting old ones.
6.19 A survey showed that the number of licenses required to open a restaurant in India are significantly more than elsewhere. While China and Singapore require only four licenses, India requires several more mandatory licenses and approvals (the comparison is in Table 5 and some of Indian requirements are listed in Table 6).
6.20 According to the National Restaurants Association of India (NRAI), a total of 36 approvals are required to open a restaurant in Bengaluru, Delhi requires 26, and Mumbai 22. Moreover, Delhi and Kolkata also require a ‘Police Eating House License’. The number of documents needed to obtain this license from Delhi Police is 45 – far more than the number of documents required for a license to procure new arms and major fireworks, 19 and 12 respectively (Table 7).
6.21 Moreover, in India, only the list of licenses and permissions can be obtained from a government portal or information center. On the other hand, in New Zealand, the website of Auckland Council (operated by a private third-party agency) has all detailed guides and stepwise procedures about permissions, fees and timeline to open a restaurant. The website is also equipped with ready-to-use business plan templates and comprehensive information on different businesses irrespective of the scale of business. The contrast reflects a difference in approach – government control versus curation/ partnership.
Table 5: Licenses Required to Open a Restaurant
| Country | Market Size (US $ billion) | No. of licenses | Nature of licenses |
| India | 61 | 12-16* | As detailed in Table 6 |
| Singapore | 8.3 | 4 | Food shop License Liquor License Importing Food License Halal Certificate |
| China | 815 | 4 | Sanitation License
Environment License Fire License Sales License |
Source: National Restaurants Association of India (NRAI).
Note: * These are just key licenses. In practice, each city requires several more approvals as mentioned in the text.
Table 6: Key Mandatory Licenses required to open a Restaurant in India
| S. No. | License | Authority | Delhi | Mumbai | Bangalore | Kolkata |
| 1. | Food Safety | FSSAI | Yes | Yes | Yes | Yes |
| 2. | Heath/Trade | Municipal Corporation |
Yes | Yes | Yes | Yes |
| 3. | Police Eating House License | Police Commissioner Licensing | Yes | Yes | ||
| 4. | Fire NOC | Fire Department | Yes | Yes | Yes | Yes |
| 5. | Shops &
Establishment |
Labor Department | Yes | Yes | Yes | Yes |
| 6. | Liquor License (If serving Liquor) | Excise Department | Yes | Yes | Yes | Yes |
| 7. | Tourism License (for liquor service) | Tourism Department | Yes | |||
| 8. | Environment Clearance for Grease Trap/ETP (Water Pollution Act) | State Pollution Control Board |
Yes | Yes | ||
| 9. | Environment Clearance for Gen Sets (Air Pollution Act) | State Pollution Control Board |
Yes | Yes | ||
| 10. | Weights and Measures | Legal Metrology Department | Yes | Yes | Yes | Yes |
| 11. | Music License | Copyright Societies registered by Govt. of India | Yes | Yes | Yes | Yes |
| 12. | Signage License | Municipal Corporation |
Yes | Yes | Yes | Yes |
| 13. | GST/VAT Registration | GST/Tax Authorities | Yes | Yes | Yes | Yes |
| 14. | Employees State Insurance/ PF | Labor/ PF Commissioner | Yes | Yes | Yes | Yes |
| 15. | Lift License (if lift installed) | Electrical Inspector | Yes | Yes | Yes | Yes |
| 16. | Delivery Bikes (if employed) | FSSAI | Yes | Yes | Yes | Yes |
Source: National Restaurants Association of India (NRAI).
Table 7: Documents required for obtaining a license from Delhi Police
| Type of license | Number of documents required |
| Eating and Lodging Establishments License | 45
|
| New Arms license | 19 |
| Fireworks license | 12 |
Source: Delhi Police Licensing.
CONSTRUCTION PERMITS
6.22 Table 8 shows the procedures, time, and costs that businesses in Delhi have to undergo for building a factory/warehouse, including obtaining necessary licenses and permits, completing required notifications and inspections, and obtaining utility connections.
6.23 When compared to the best in class-Hong Kong, which tops the World Bank rankings for ease of obtaining construction permits, it can be seen that Hong Kong takes just over two months to obtain a construction permit, while Delhi takes almost four months. Moreover, it takes 35 days to get water and sewer connection in Delhi.
6.24 Nonetheless, it must be noted that India has considerably improved the process to obtain construction permits over the last five years. Compared to 2014, when it took approximately 186 days and 28.2 per cent of the warehouse cost; in 2019 it takes 98-113.5 days and 2.8-5.4 per cent of the warehouse cost (Figure 1).
Table 8: Construction Permits – Delhi vs Hong Kong
| DELHI, INIDA (RANK 27) | Days | Days | HONG KONG (RANK 1) |
| Submit online Common Application Form along with requisite building permit fees and drawings | 0.5 | 45 | Obtain approval by submitting applications to the One Stop Center |
| Request & obtain release of building sanction plans | 30 | 1 | Receive inspection by Building Dept. on foundation strata |
| Submit online notice of completion up to the plinth level and get inspection done | 15.5 | 1 | Request and receive inspection on the superstructure construction |
| Submit notice of completion, receive final inspection & obtain Fire NOC | 2.5 | 1 | Receive an audit inspection by the Building Department |
| Obtain completion/occupancy permit | 30 | 11 | Submit notification of project completion and relevant applications |
| Request water and sewer connection approval and inspection | 35 | 18 | Obtain relevant certificates through the One Stop Center |
| 1 | Receive joint & final inspection of licensing authorities; Obtain Water & Sewerage connection | ||
| 113.5 Days | Time Taken | 69 Days | |
| 2.8 | Cost (% of Warehouse) | 0.3 | |
Source: World Bank Doing Business Report, 2020.
Figure 1: Cost of Construction Permits in India
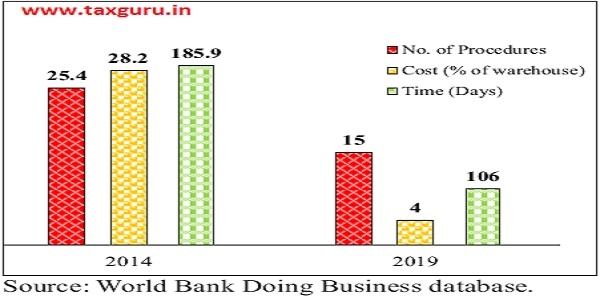
Source: World Bank Doing Business database.
ACHIEVING SCALE ACROSS BUSINESS
6.25 One issue that gets in the way of business efficiency in India is that of scale. Most of the manufacturing units in India have small capacities and consequently low manufacturing efficiencies which are a disadvantage in the global supply chain. Countries like Bangladesh, China, Vietnam are able to progress in the value chain by increasing their competitiveness in the international market by improving their delivery time and domestic production capacity.
6.26 Compared to Bangladesh, China, and Vietnam, which have more than 80 per cent of market value of exports by large enterprises, India has 80 per cent by small enterprises. Moreover, in India it can take 7-10 days to reach a port whereas in countries like China, Bangladesh and Vietnam it takes less than a day. Thus, the Indian supply chain ends up with a large number of small consignments clogging already inefficient logistics pathways. A comparison of turn-around time (i.e., order to deliver) is given in Table 9.
Table 9: Emerging Economies Comparison – Scale and Logistics
| Bangladesh | China | India | Vietnam | |
| Turn Around Time (in Days) (from order to delivery) | 50 | 31 | 63 | 46 |
| Time Taken to reach port (in Days) | 1 | 0.2 | 7-10 | 0.3 |
Source: High Level Advisory Group (HLAG) Report, 2019.
TRADING ACROSS BORDERS
6.27 The Trading Across Borders indicator records the time and cost associated with the logistical process of exporting and importing goods. Globally, transportation by ports is the most favored followed by railways and then roads, whereas in India it is the opposite.
6.28 Italy tops the EoDB rankings in Trading Across Borders. Table 10 tabulates its comparison with India. While India takes 60-68 and 88-82 hours in border and documentary compliance for exports and imports respectively, Italy takes only one hour for each. Moreover, the cost of compliance is zero in Italy. In India, it costs US$ 260-281 and US$ 360-373 for exports and imports respectively.
6.29 It must be noted that almost 70 per cent of the delays (both in exports and imports) occur on account of port or border handling processes which essentially pertain to procedural complexities (number and multiplicity of procedures required for trade), multiple documentations and involvement of multiple agencies for approvals and clearances. It is also observed that time delays and procedural inefficiencies end up pushing cost to trade.
6.30 While the government has already reduced procedural and documentation requirements considerably, increasing digitalization and seamlessly integrating multiple agencies onto a single digital platform can further reduce these procedural inefficiencies significantly and improve user experience substantially. The accompanying box discusses the Authorized Economic Operators scheme that is being used to smoothen the process for registered exporters/ importers.
Table 10: Trading across Borders- India vs Italy
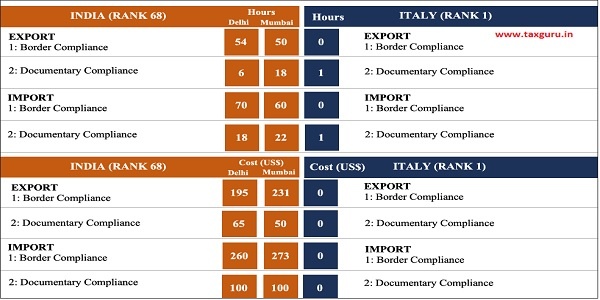
Source: World Bank Doing Business Report, 2020.
Note: India numbers are for Delhi/Mumbai respectively, as these are the two centres covered by World Bank for India.
BOX 1: Authorised Economic Operators (AEO)
Authorised Economic Operator (AEO) is a programme under the aegis of the World Customs Organization (WCO) SAFE Framework of Standards to secure and facilitate Global Trade. The programme aims to enhance international supply chain security and facilitate movement of goods. AEO encompasses various players in the international supply chain. Under this programme, an entity engaged in international trade is approved by Customs as compliant with supply chain security standards and granted AEO status. An entity with an AEO status is considered a ‘secure’ trader and a reliable trading partner. AEO is a voluntary programme. It enables Indian Customs to enhance and streamline cargo security through close cooperation with the principle stakeholders of the international supply chain viz. importers, exporters, logistics providers, custodians or terminal operators, custom brokers and warehouse operators, who benefit from preferential treatment from customs authorities. Benefits include expedited clearance times, fewer examinations, improved security and communication between supply chain partners, and more. The Circular 33/2016 – Customs dated July 22, 2016 provides the statutory framework for the AEO programme.
There are three tiers of certification in the new AEO Programme for importers and exporters:
1. AEO T1 – Verified on the basis of document submission only.
2. AEO T2 – In addition to document verification, onsite verification is also done.
3. AEO T3 – For AEO T2 holders who have enjoyed the status for two years only on the basis of document verification and for AEO T2 holders who have not enjoyed the status continuously or have introduced major changes in business, the applicant is subjected to physical verification.
For logistics providers, custodians or terminal operators, custom brokers and warehouse operators there is only one tier:
AEO LO – Here onsite verification is done in addition to document verification.
Who is entitled for AEO Certification
Anyone involved in the international supply chain that undertakes Customs related activity in India can apply for AEO status irrespective of size of the business. These may include exporters, importers, logistic providers (e.g. carriers, airlines, freight forwarders, etc.), custodians or terminal operators, customs house agents and warehouse owners. Others who may qualify include port operators, authorized couriers, stevedores. The list is not exhaustive.
Eligibility
Any legal entity that undertakes Customs related work can apply for the AEO Programme if they fulfil the following conditions:
1. They have handled 25 Import or Export documents in last Financial Year.
2. They have had their business activity for last three Financial Year (can be waived in deserving cases).
3. The applicant must have been Financially Solvent for the last three financial years.
4. The applicant must not be issued a show cause notice involving ‘fraud, forgery, outright smuggling, clandestine removal of excisable goods or cases where Service Tax has been collected from customers but not deposited to the Government during last three financial years.
An entity can apply for AEO-T1 certification online, by visiting: https://www.aeoindia.gov.in/. Table A lists the number of AEO compliant entities in India.
Table A: AEO Certified Entities in India as on January 17, 2019
| AEO Tier | Number of AEO status holders |
| AEO T1 | 2,842 |
| AEO T2 | 491 |
| AEO T3 | 8 |
| AEO LO | 745 |
| Total | 4.086 |
Source: Central Board of Indirect Taxes and Customs (CBIC).
CASE STUDIES OF INDIA’S PERFORMANCE IN LOGISTICS IN SPECIFIC SEGMENTS
6.31 This section presents the results of case studies and industry surveys conducted in October-December 2019 by the ‘Quality Council of India’ in order to understand the specific points in the supply-chain that experience inordinate delays and blockages.
I. Case Study of Exporting Apparels
6.32 This case study tracks consignments from an apparel factory in Delhi, which is a non-AEO (Box 1), that exports its products to Maine, U.S. via India’s largest sea port Nhava Sheva in Maharashtra, India’s largest sea port. Table 11 traces the logistics of the export consignment.
6.33 The study found that after the shipment leaves the factory gate in Delhi, it takes five days to reach Jawaharlal Nehru Port Trust (JNPT). However, six processes in Nhava Sheva can take up to 14 days, of which a day or two is spent just on ‘Unloading’ depending on space availability at the port. Three days are then used up in ‘Custom Clearance’, another three days in ‘Stuffing Containers’ and up to five days are taken up by ‘queue for entry into the ship’. This is partly due to insufficient port infrastructure to handle the inflow of containers, narrow roads and poor strength bearing capacity of the roads at the port.
Table 11: Tracing an Apparel Export Consignment from Delhi to Maine, United States
| Place | Action | Day | No. of Days | |
| INDIA | ||||
| 19 Days in India | Delhi | Shipment ready at factory | Day 1 | |
| Delhi Haryana Rajasthan Gujarat Maharashtra |
Transport of shipment via truck/ train to JNPT | Day 1 – 5 | 5 days | |
| Nhava Sheva, Maharashtra | Shipment reaches JNPT | Day 5 | Up to 14 days |
|
| a) Unloading | Day 5/6 | |||
| b) Custom clearance | Day 6/7 – 8 | |||
| c) Stuffing in container | Day 8/9 – 12 | |||
| d) Queue for entry into ship | Day 12/13 – 17 | |||
| e) Handover to shipping line | Day 17/18 | |||
| a) Departure of Ship | Day 18/19 | |||
| 19 Days at High Seas |
High seas | Ship traveling at seas | Day 18/19 – Day
38 |
19 days |
| UNITED STATES | ||||
| 3 Days in U.S. | Houston, U.S. | Reaches port | Day 38 | 3 days |
| Clears customs (considering all documentation is in place and inspections render safe results) | Day 38/39 | |||
| Loading & Departure | Day 39 | |||
| Maine, U.S. | Reaches buyer in US | Day 40/41 | ||
Source: QCI Calculations.
However, much of the delay is due to the misalignment of processes that do not allow for “just in time” protocols. The uncertainty of time needed to clear each step means that exporters have to pad up the time spent waiting. This adds to the clogging of port space.
6.34 Once the ship leaves the port, the consignment travels for 19 days by sea, reaching Houston, U.S. on day 38. Here, Customs take at most a day’s time to clear the consignment, provided all paper work and regulatory requirements are met. The consignment then reaches the buyer’s warehouse in Maine within two days.
6.35 In short, of the total 41 days taken by the consignment from factory in Delhi to warehouse in Maine, 19 days were spent in India, 19 days at sea and roughly three days in the United States. There is obvious scope for improvement.
Table 12: Tracing a Carpet Export Consignment from Mirzapur to New Jersey
| Place | Action | Day | No. of Days | |
| INDIA (AEO) | ||||
| 13 Days in India | Mirzapur, U.P. | Shipment ready at factory | Day 1 | 1 day |
| Mirzapur to Piyala, Haryana | Transport of shipment via truck to ICD Piyala | Day 1 – 3 | 2 days | |
| Piyala | Shipment reaches Piyala | Day 3 | 4 days | |
| Custom clearance | Day 3/4 | |||
| Stuffing in container | Day 4-7 | |||
| Departure to Mundra Sea Port by Train | Day 7 | |||
| Rail Travel | Transport of shipment via train to Mundra | Day 7 – 10/11 | 3-4 days | |
| Mundra Sea Port (Gujarat) | Queue with the truck to enter the port | Day 11 (6-7 hours) | 2 days | |
| Loading of vessel | Day 11-13 | |||
| Departure of Ship | Day 13 | |||
| 22 Days at High Seas |
High seas | Ship traveling at seas | Day 13 – Day 35/36 | 22/23 days |
| UNITED STATES | ||||
| 5 Days in U.S. | New York Sea Port | Reaches port | Day 36 | 4-5 days |
| Clears customs (considering all documentation is in place and inspections render safe results) | Day 36-39 | |||
| Road Travel | Transportation to New Jersey Warehouse | Day 39/40 | ||
| New Jersey | Reaches warehouse | Day 40 | ||
Source: QCI Calculations.
II. Case Study of Exporting Carpets
6.36 A similar exercise was done for a carpet manufacturer, who is an AEO, exporting products from Mirzapur in Uttar Pradesh to New Jersey in the U.S. (Table 12).
6.37 After the shipment leaves the factory in Mirzapur, it takes two days to reach the Inland Container Depot (ICD) in Piyala, Haryana. At the ICD, the consignment is cleared by Customs in a day’s time. In the next three days the consignment is stuffed in containers and sent to Mundra.
6.38 It takes three to four days to transport the shipment via train to Mundra sea port. Another 6-7 hours are used up in queue to enter the port. The vessel is loaded in the next two days and the ship departs on day 13. The ship takes around 23 days to reach New York sea port on day 36. Here, Customs takes two-three days to clear the consignment, provided all paper work and regulatory requirements are met. In the next two days the consignment is transported to the warehouse in New Jersey.
6.39 To sum up, of the 40 days, 13 days are spent in India, another 22 days at sea and 4-5 days in the U.S. before the consignment reaches the final buyer in New Jersey. Although, being an AEO significantly reduces the number of days a shipment takes to depart from India (compared to the previous case), it still takes an inordinate amount of time within the country.
III. Case Study of Importing Carpets
6.40 Another way to understand the process flow of logistics is to look at it in reverse. This case study tracks the timelines involved while importing carpets from Milan, Italy to a warehouse in Beawar, Rajasthan (Table 13).
6.41 Once the shipment is ready at the factory gate in Milan, it takes only 10 Hours to transport the shipment to Naples, 773 kms away. Just two hours are spent in custom clearances and then it takes only an hour’s time to load the ship. This means that the consignment spends less than a day from factory to ship. It is possible to do this because of well-oiled “just-in-time” processes. The ship then spends 23 days on high seas, reaching Mundra sea port in Gujarat on Day 24. The next six days are spent at Mundra port, of which, about two days are used up waiting outside the port for entry, followed by another two days in custom clearance and a queue of 6-7 hours to exit the port. Lastly, the shipment reaches its final destination- Beawar, Rajasthan on Day 31, including the two days of travel time by road. Thus, it takes 8 days in India to undergo border compliances and travel time before the consignment reaches the buyer.
6.42 To summarize, while it takes only one day in Italy to transport, and complete border compliance and documentation, India takes eight days to complete the import process (note that the importer for this study was an Authorised Economic Operator). Nonetheless, it is interesting to note that the imports process takes less time than the exports process.
6.43 The results of the case study approach, by definition, are limited by sample size, but the above results were cross verified by QCI by interacting with a wide cross section of importers and exporters in order to confirm that the collected data broadly fits their experience. The following were the outcomes (a) the inordinate delays in loading and customs processes in Indian sea-ports (b) the processes for imports, ironically, are better than those for exports (c) the large variance in process time means that exports are forced to account for the uncertainty by padding extra waiting time. This means that it is not good enough to simply improve the “average” without improving reliability.
6.44 It must be noted that the turnaround time of ships in India has been on a continuous decline, almost halving from 4.67 days in 2010-11 to 2.48 days in 2018-192. This shows that achieving significant efficiency gains in the case of sea ports is possible. Although, a full case study of Chennai port was not done, partial data suggests that its processes are smoother than those of the ports discussed above.
Table 13: Tracing a Carpet Import consignment from Milan to Beawar
| Place | Action | Time | No. of Days/ Hours | ||
| ITALY | |||||
| 13 Hours in Italy | Milan | Shipment ready at factory in Milan | |||
| Milan Bologna San Marino Rome Naples (773 km) | Transport of shipment to Naples | Day 1 | 10 Hours | ||
| Naples | Customs clearance Documentary compliances | Day 1 | 2 Hours | ||
| Loading Departure of ship | Day 1 | 1 Hour | |||
| 23 Days at High Seas | High seas | Ship traveling at seas | Day 2-24 | 23 days | |
| INDIA (AEO) | |||||
| 8 days in India | Mundra Sea Port (Gujarat) |
Shipment reaches Mundra Port at Sea Shore | Day 24 | 6 days | |
| Vessel waiting time outside the port before entry | Day 24-26 | ||||
| Unloading shipment at port | Day 26 | ||||
| Custom Clearance | Handling shipment at port | Day 27 | |||
| Clearing security inspections conducted by port authorities | Day 28 | ||||
| Queue with the truck to exit port | Day 29 (6-7 Hours) | ||||
| Road Travel | Transport of shipment via truck to Beawar Rajasthan | Day 29 | 2 days | ||
| Beawar (Rajasthan) | Shipment reaches factory at Beawar | Day 31 | |||
Source: QCI Calculations.
IV. Case Study of Electronics
6.45 Although, the processes at sea-ports remain very inefficient, those at airports have dramatically improved. Indeed, a case study of an electronics company based in Bangaluru, which is currently AEO-T2 certified, found that Indian systems can be world class. It also provides some insight into how the business environment has changed for some segments after the implementation of AEO policy in 2016.
6.46 Tables 14 (a) and (b) compare the time taken for exporting electronics from Bangaluru to Hong Kong, with and without AEO registration. Once the shipment is ready at the factory in Bangaluru, it takes three hours to transport it to Kempegowda Airport. At the airport, it takes one hour to enter exports terminal. So far, there is no difference between AEO and non-AEO. However, total time spent at the airport for Customs and examination process is just two hours for AEO-T2 operators. Non-AEO operators take 6 hours.
6.47 In fact, after AEO implementation, the total time spent in India (six hours) is less than that spent in Hong Kong (seven hours). This shows, with the help of right policies, India can achieve international standards, or even better them.
Table 14 (a): Tracing Electronics Export consignment from Bangaluru to Hong Kong (Non AEO)
| Place | Action | Time | |
| INDIA- (NON AEO) | |||
| 10 Hours in India | Bangaluru, Karnataka | Shipment ready at factory | |
| Warehouse to Kempegowda Airport, Bangaluru Distance – 70Km | Transport of shipment via truck to Airport | 3 Hours | |
| Shipment reaches Airport | Export Terminal Entry | 1 Hour | |
| Customs Registration | 2 Hours | ||
| Examination & Let Export of Shipping Bill | 4 Hours | ||
| 5 Hour Flight |
Air travel | 5 Hours | |
| HONG KONG | |||
| 7 Hours in Hong Kong |
Hong Kong | Reaches Hong Kong Airport | |
| Customs Clearance | Inspection & Pass out Order | 4 Hours | |
| Road Travel | Transportation from airport to warehouse | 3 Hours | |
Source: Survey Calculations.
Table 14 (b): Tracing Electronics Export consignment from Bangaluru to Hong Kong (AEO)
| Place | Action | Time | |
| INDIA (AEO T2) | |||
| 6 Hours in India | Bangaluru, Karnataka | Shipment ready at factory | |
| Warehouse to Kempegowda Airport, Bangaluru Distance – 70Km | Transport of shipment via truck to Airport | 3 Hours | |
| Shipment reaches Airport | Export Terminal Entry | 1 Hour | |
| Customs Registration | 1 Hour | ||
| Examination & Let Export of Shipping Bill | 1 Hour | ||
| 5 Hour Flight | Air travel | 5 Hours | |
| HONG KONG | |||
| 7 Hours in Hong Kong | Hong Kong | Reaches Hong Kong Airport | |
| Customs Clearance | Inspection & Pass out Order | 4 Hours | |
| Road Travel | Transportation from airport to warehouse | 3 Hours | |
Source: Survey Calculations.
6.48 Again, the process flow was studied in reverse. Tables 15 (a) and (b) compare the time taken in importing electronics from China to Bangaluru, with and without AEO. After the shipment is ready in factory at Shenzhen, it takes two days to transport it to Hong Kong airport.
6.49 At the airport, an hour is spent on export declaration, two hours on customs clearance and another four hours in loading the aircraft at the terminal. After a five hour air travel, the consignment reaches Kempegowda Airport, Bangaluru. It then takes 14 and 11 hours respectively for a Non-AEO and AEO consignment to reach the warehouse in Bangaluru.
6.50 The case study suggests the following conclusions: (a) the processes in Indian airports is vastly superior to those at sea ports for both imports and exports; (b) AEO did significantly improve the process but it is reasonably smooth even for non-AEO operators importing/ exporting electronics (c) Indian processes can beat international standards.
Table 15 (a): Tracing Electronics Import consignment from China to Bangaluru (Non AEO)
| Place | Action | Time | |
| CHINA | |||
| 2 days & 7 Hours in China |
Shenzhen, China | Shipment ready at factory | |
| From warehouse in Shenzhen to Hong Kong Airport | Transport of shipment via truck to Airport | 2 days | |
| Shipment reaches Airport | Export Declaration | 1 Hour | |
| Customs Clearance | 2 Hours | ||
| Acceptance to flight at Terminal | 4 Hours | ||
| 5 Hour Flight | Air travel | 5 Hours | |
| INDIA- (NON AEO) | |||
| 14 Hours in India | Shipment reaches Airport in Bangaluru | Bonding/ Manifest of Cargo | 3 Hours |
| Customs Clearance | 6 Hours | ||
| Cargo Delivery process | 1 Hours | ||
| Road Travel | Transportation from airport to warehouse | 4 Hours | |
Source: Survey Calculations.
Table 15 (b): Tracing Electronics Import consignment from China to Bangaluru (AEO)
| Place | Action | Time | |
| CHINA | |||
| 2 days & 7 Hours in China | Shenzhen, China | Shipment ready at factory | |
| From warehouse in Shenzhen to Hong Kong Airport | Transport of shipment via truck to Airport | 2 days | |
| Shipment reaches Airport | Export Declaration | 1 Hour | |
| Customs Clearance | 2 Hours | ||
| Acceptance to flight at Terminal | 4 Hours | ||
| 5 Hour Flight | Air travel | 5 Hours | |
| INDIA- (AEO T2) | |||
| 11 Hours in India | Shipment reaches Airport in Bangaluru | Bonding/ Manifest of Cargo | 3 Hours |
| Customs Clearance | 3 Hours | ||
| Cargo Delivery process | 1 Hours | ||
| Road Travel | Transportation from airport to warehouse | 4 Hours | |
Source: Survey Calculations.
CONCLUSION
6.51 This chapter looked at the Ease of Doing Business in India from various aspects. First, it compared India’s performance on World Bank’s EoDB rankings with its peers as well as the best-in-class. The analysis focused on the four parameters where India lags behind viz– Starting Business Registering Property, Paying Taxes, and Enforcing Contracts. The findings clearly show the large scope for improvement in all categories. While it takes approximately four years to enforce a contract in India; New Zealand, Indonesia, China and Brazil require 0.6, 1.2, 1.4 and 2.2 years respectively. With a rank of 163 out of 190 nations in Enforcing Contracts, only a few countries like Afghanistan, Mozambique, and Zimbabwe perform worse than India. Similar comparisons have been shown for other categories.
6.52 Secondly, the chapter throws light on the maze of laws, rules and regulations in manufacturing and services (particularly restaurants) sector. While China and Singapore require only four licenses to open a restaurant, India requires several more mandatory licenses and approvals: Delhi requires 26, Bangaluru 36, and Mumbai requires 22. In addition, Delhi requires a ‘Police Eating House License’ from Delhi Police that asks for 45 documents compared to just 19 needed to buy a gun. The scope for streamlining is clear.
6.53 Lastly, a series of case studies and industry surveys are used to analyse the time taken at each stage of the supply chain for specific merchandise items to travel from factory gate to the warehouse of the foreign customer. These confirmed the following (a) the inordinate delays in loading and customs processes in Indian sea-ports (b) the processes for imports, ironically, are better than those for exports (c) the large variance in process time means that exports are forced to account for the uncertainty by padding extra waiting time. In contrast, however, the imports and exports of electronics through Bengaluru airport was found to be world class. The processes of Indian airports should be adapted and replicated in sea-ports.
CHAPTER AT A GLANCE
> India has jumped up 79 positions in World Bank’s Doing Business rankings, improving from 142 in 2014 to 63 in 2019. However, it continues to trail in parameters such as Ease of Starting Business (rank 136), Registering Property (rank 154), Paying Taxes (rank 115), and Enforcing Contracts (rank 163).
> Enforcing a contract in India takes on average 1,445 days in India compared to just 216 days in New Zealand, and 496 days in China. Paying taxes takes up more than 250 hours in India compared to 140 hours in New Zealand, 138 in China and 191 in Indonesia. These parameters provide a measure of the scope for improvement.
> Setting up and operating a services or manufacturing business in India faces a maze of laws, rules and regulations. Many of these are local requirements, such as burdensome documentation for police clearance to open a restaurant. This must be cleaned up and rationalized one segment at a time.
> Case studies of merchandise exports found that logistics is inordinately inefficient in Indian sea-ports. The process flow for imports, ironically, is more efficient than that for exports. Although one needs to be careful to directly generalize from specific case studies, it is clear that customs clearance, ground handling and loading in sea ports take days for what can be done in hours. A case study of electronics exports and imports through Bengaluru airport illustrates how Indian logistical processes can be world class.
> It must be noted that the turnaround time of ships in India has been on a continuous decline, almost halving from 4.67 days in 2010-11 to 2.48 days in 2018-19. This shows that achieving significant efficiency gains in the case of sea ports is possible. Although, a full case study of Chennai port was not done, partial data suggests that its processes are smoother than those of the ports discussed above.
> The streamlining of the logistics process at sea-ports requires close coordination between the Logistics division of the Ministry of Commerce and Industry, the Central Board of Indirect Taxes and Customs, Ministry of Shipping and the different port authorities. The simplification of the Ease of Doing Business landscape of individual sectors such as tourism or manufacturing, however, requires a more targeted approach that maps out the regulatory and process bottlenecks for each segment. Once the process map has been done, the correction can be done at the appropriate level of government – central, state or municipal.
REFERENCES
World Bank. “Doing Business.” The World Bank Group. (Various Editions). https:// www.doingbusiness.org/en/doingbusiness
Department of Commerce. “Logistics Ease Across Different States (LEADS Index).” New Delhi, 2019. https://commerce. gov.in/writereaddata/UploadedFile/ MOC_637051086790146385_LEAD_ Report.pdf
Department of Commerce. “High-Level Advisory Group (HLAG).” New Delhi, 2019. https://commerce. gov.in/writereaddata/uploadedfile/ MOC_637084607407371826_HLAG%20 Report%20.pdf
Niti Aayog. “Ease of Doing Business: An Enterprise Survey of Indian States.” New Delhi, 2017. https://niti.gov.in/ writereaddata/files/document_publication/ EoDB_Single.pdf
Notes:-
1 See Economic Survey 2018-19 Chapter 5, Volume I.
2 See Economic Survey 2019-20 Chapter 9, Volume II.


