“It is not by augmenting the capital of the country, but by rendering a greater part of that capital active and productive than would otherwise be so, that the most judicious operations of banking can increase the industry of the country.”
– Adam Smith
In 2019, India completed the 50th anniversary of bank nationalization. It is, therefore, apt to celebrate the accomplishments of the 3,89,956 officers, 2,95,380 clerks, and 1,21,647 sub-staff who work in Public Sector Banks (PSBs). At the same time, an objective assessment of PSBs is apposite. Since 1969, India has grown significantly to become the 5th largest economy in the world. Yet, India’s banking sector is disproportionately under-developed given the size of its economy. For instance, India has only one bank in the global top 100 – same as countries that are a fraction of its size: Finland (about 1/11th), Denmark (1/8th), Norway (1/7th), Austria (about 1/7th), and Belgium (about 1/6th). Countries like Sweden (1/6th) and Singapore (1/8th) have thrice the number of global banks. A large economy needs an efficient banking sector to support its growth. Historically, in the last 50 years, the top-five economies have always been ably supported by their banks. Should India’s banks play a role proportionate to its economic size, India should have six banks in the top 100. As PSBs account for 70 per cent of the market share in Indian banking, the onus of supporting the Indian economy and fostering its economic development falls on them. Yet, on every performance parameter, PSBs are inefficient compared to their peer groups. Previously, the Narasimhan Committee (1991, 1997), Rajan Committee (2007) and P J Nayak Committee (2014) have provided several suggestions to enhance the efficiency of PSBs. The survey suggests use of FinTech (Financial Technology) across all banking functions and employee stock ownership across all levels to enhance efficiencies in PSBs. These will make PSBs more efficient so that they are able to adeptly support the nation in its march towards being a $5 trillion economy. All these recommendations need to be seriously considered and a definite, time-bound plan of action drawn up. With the cleaning up of the banking system and the necessary legal framework such as the Insolvency and Bankruptcy Code (IBC), the banking system must focus on scaling up efficiently to support the economy.
7.1 In 2019, India completed the 50th anniversary of the bank nationalization programme undertaken in 1969. It is, therefore, apt to celebrate the accomplishments of the 389,956 officers, 295,380 clerks, and 121,647 sub-staff who work in public sector banks (PSBs). As PSBs account for 70 per cent of the market share in banking, an assessment of the state of India’s public sector banks (PSBs) is apposite. Even though PSBs are the dominant players in the banking sector, they lag considerably in performance metrics when compared to their peers.
7.2 Figure 1 shows that India’s banks are disproportionately small compared to the size of its economy. In 2019, when Indian economy is the fifth largest in the world, our highest ranked bank—State Bank of India— is ranked a lowly 55th in the world and is the only bank to be ranked in the Global top 100. India has only one bank in the global top 100 and gets grouped on this characteristic with countries that are a fraction of its size: Finland (about 1/11th), Denmark (1/8th), Norway (1/7th), Austria (about 1/7th), and Belgium (about 1/6th). Countries like Sweden and Singapore, which are respectively about 1/6th and 1/8th the economic size of India, have thrice the number of global banks as India does.
Figure 1: Number of banks in the Global Top 100 (2019)

Source: Wikipedia
7.3 Figure 2 clearly highlights this disproportionate dwarfism of the Indian banks when compared to the size of the Indian economy. A fit of the number of banks in the global top 100 and the size of the economy shows clearly that India is a significant outlier on the negative side. All the largest economies have proportionately large banks with China being an outlier on the positive side with 18 banks in the global top 100. Figure 3, similarly, shows India as an outlier when the penetration of credit to the private sector is plotted against the GDP per capita of a country; as credit in India is provided primarily by banks, this measure proxies the penetration of credit by banks in India.
Figure 4 shows that the disproportionately lower penetration is not just because of our greater population. While greater population does lower penetration of credit, such penetration is disproportionately lower in India when compared to our population. In sum, Figures 1-4 clearly show the dwarfism of our banking sector when compared to the country’s characteristics: size of the economy (GDP), development of the economy (GDP per capita) and population.
Figure 2: Country’s GDP and number of banks in the Global Top 100

Source: Wikipedia for banks in the top 100 and GDP 2019 estimates from IMF.
Figure 3: Country’s GDP per capita and penetration of credit in the country
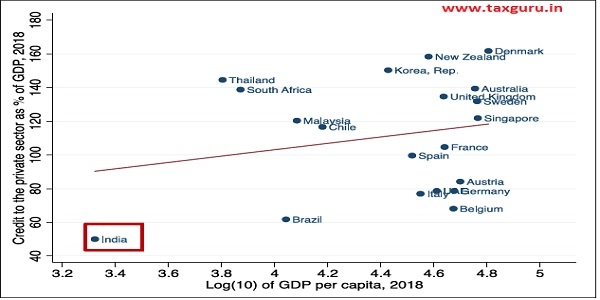
Source: World Bank WDI Database.
Figure 4: Country’s population and penetration of credit in the country
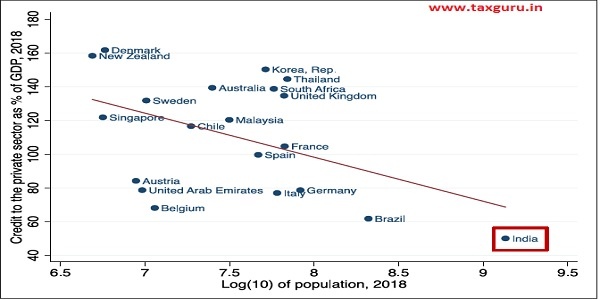
Source: World Bank WDI database
7.4 A large economy needs an efficient banking sector to support its growth. Yet, Figure 5 shows that credit growth among PSBs has declined significantly since 2013 and has also been anaemic since 2016. Even as NPBs grew credit at between 15 per cent and 29 per cent per year between 2010 and 2019, PSB credit growth essentially stalled to the single digits after 2014, ending up at a 4.03 per cent growth in 2019 compared 15
per cent to 28 per cent from 2010 to 2013. As Section 2 in Chapter 1 of Volume 2 of this Survey clearly demonstrates, anaemic credit growth has impacted economic growth. This needs to be remedied because the economy needs PSBs to perform to their fullest potential and support economic growth rather than pullback lending, which has a detrimental effect on growth and welfare.
Figure 5: Bank Credit Growth ( per cent)
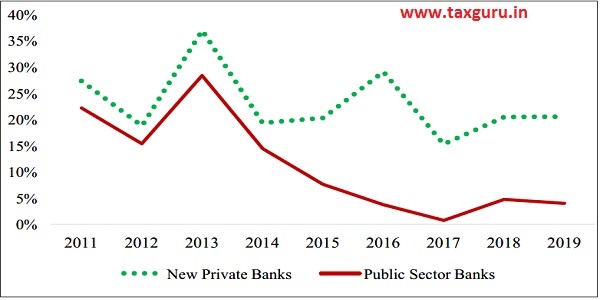
Source: RBI Data and Survey Calculations
7.5 Historically, in the last 50 years, the top-five economies have always been ably supported by their banks. The support of the U.S. Banking system in making the U.S. an economic superpower is well documented. Similarly, in the eighties during the heydays of the Japanese economy, Japan had 15 of the top 25 largest banks then. In recent times, as China has emerged as an economic superpower, it has been ably supported by its banks—the top four largest banks globally are all Chinese banks. The largest bank in the world—Industrial and Commercial Bank of China—is nearly two times as big as the 5th or 6th largest bank, which are Japanese and American banks respectively. Using the above relationship, we estimate that if Indian banks were proportionately large in relation to the size of the Indian economy, we should have at least six banks in the global top 100. Similarly, India becoming a $ 5 trillion economy will require at least eight Indian banks to be large enough to belong in the top 100 globally. The state of the banking sector in India, therefore, needs urgent attention.
7.6 As PSBs account for 70 per cent of the market share in Indian banking, the onus of supporting the Indian economy and fostering its economic development falls on them. However, in 2019, PSBs’ collective loss— largely due to bad loans—amounted to over ` 66,000 crores, an amount that could nearly double the nation’s budgetary allocation for education. PSBs account for 85 per cent of reported bank frauds while their gross nonperforming assets (NPAs) equal ` 7.4 lakh crores which is more than 150 per cent of the total infrastructure spend in 2019. Estimate of return on equity in 2019 highlights that every rupee of taxpayer money invested in PSBs as equity by the Government loses 23 paise. The market-to-book ratio, which indicates the quality of a bank’s governance, is 0.8 as on 20th January, 2020 for PSBs while that of the average NPB is close to 4. To enable PSBs to become efficient and thereby catalyse the banking sector and stimulate economic growth, structural solutions are necessary.
7.7 Over ` 4,30,000 crores of taxpayer money is invested as Government’s equity in PSBs. In 2019, every rupee of taxpayer money invested in PSBs, on average, lost 23 paise. In contrast, every rupee of investor money invested in “New Private Banks” (NPBs)—banks licensed after India’s 1991 liberalization—on average gained 9.6 paise. As PSBs and NPBs operate in the same domestic market, there is a case for enhancing the efficiency of PSBs.
7.8 To understand the scale of inefficiencies in PSBs, we estimate the potential gain only from changes in the return on the taxpayer’s investment in PSBs. The return earned by an investor in an average NPB represents the benchmark that must be employed to estimate the losses that the taxpayer bears from her investment in PSBs. Using this benchmark, Figure 6 shows that the foregone return on the taxpayer’s investment in PSBs must rank as one of the largest subsidies as the foregone amount of over ` 1.4 lakh crores compares similarly to the amount provided for the food subsidy.
7.9 Another way to understand the scale of inefficiencies is to ask the following question: What is the overall value that the taxpayer derives from her investment in PSBs? For this purpose, we use the ratio of stock market-to-book value of PSBs on average vis-à-vis that of new private sector banks (NPBs). As on 20th January 2020, we note that every rupee of this taxpayer money fetches a market value of 71 paise. In stark contrast, every rupee invested in NPBs fetches a market value of ` 3.70 i.e., more than five times as much value as that of a rupee invested in PSBs. This leads to the natural question: What if the market-to-book ratio of each PSB doubled, which envisages an extremely modest and unambitious increase, as the average PSB will still generate about one-third the value that a NPB generates on average? Figure 7 shows that the gain would be ` 5.2 lakh crores, an amount that is about five times the budgeted estimate for disinvestment for 2019 (` 1.05 lakh crores). A more realistic, but not desperately modest, scenario would be to assume that the market-to-book ratio of each PSB becomes equal to that of the second worst performing NPB; this is a realistic scenario as the worst performing NPB has a market-to-book ratio that is greater than the average for PSBs. Thus, we assume here that the taxpayer investment in each PSB would at least equal the market-to-book ratio of the NPBs that are at the bottom of their heap. This change would gain the Government about `9.1 lakh crores, which is more than about 8.5 times budgeted estimate for disinvestment for 2019. A change in the market-to-book ratio of each PSB to the median for the NPBs would gain the Government ` 10.2 lakh crores, which is over nine times the disinvestment target for 2019. Finally, a change in the market-to-book ratio of each PSB to the median for the NPBs would gain the Government ` 11.8 lakh crores, which is about 11 times the disinvestment target for 2019. As argued above, the primary difference between PSBs and NPBs stems from the difference in efficiencies and all the consequent differences that result from the same. This scenario analysis clearly suggests that the costs stemming from inefficiency of PSBs are enormous.
Figure 6: Comparison of the foregone return on taxpayer money investment in PSBs with large subsidy heads (2019)
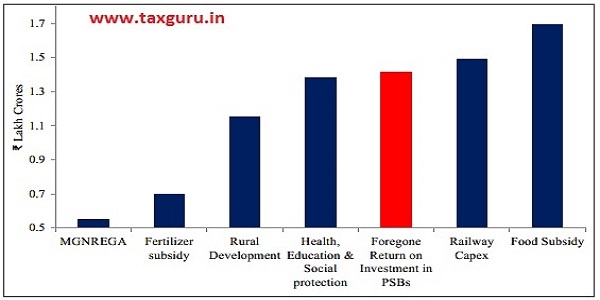
Source: Budget documents, RBI Data and Survey Calculations
Figure 7: Potential gains to the taxpayer from enhanced efficiency in PSBs

Source: Survey Calculations
Note: M2B denotes the market-to-book ratio of a listed bank
7.10 India needs to recognise that the fulfilment of social goals can happen at scale through financial intermediation. The exponential growth of microfinance and its impact illustrates this point (see Box 1). Also, as is clarified later, highlighting the odd weakness in other business models – NPBs or in microfinance institutions (MFIs) – to make the case for continuing status quo in PSBs suffers from the fallacy of an apples-to-oranges comparison. As with any economic activity, heterogeneity in performance is inevitable. Just as there is a wide variation within PSBs in their performance with some PSBs performing better than others, similarly, there has to be some variation in the performance of NPBs and MFIs. However, to compare the performance of the average PSB with either the best performing NPB/MFI or the worst performing one is incorrect as that mixes up two statistical measures – averages and outliers – and leads to an apples-to-oranges comparison. In sum, the case for enabling efficiencies in PSBs is compelling.
7.11 India is at a critical inflection point in her growth trajectory due to a unique confluence of factors, which (i) a positive demographic dividend; (ii) a modern digital infrastructure supported by the JAM “trinity” ofnear-100 per cent financial inclusion, a biometrics-based unique identity system, and a mobile network structure, and (iii) a de novo GST network with uniform, electronic indirect taxation system across India. These investments set the stage for a modern economy in which tens of crores of individuals and businesses are entering the formal financial system.
7.12 Given India’s demographics and the growth opportunities on hand, we need a thriving banking sector now. A vibrant banking system can support and unleash a multiplier effect and permanently alter India’s growth trajectory in a positive way. Conversely, inefficient PSBs can severely handicap the country’s ability to exploit the unique opportunities she can utilize today. The result could be a generational setback to the country’s economic growth. As mentioned earlier, no country has been a dominating global economy without the support of an efficient banking system. So for India to march in its goal of becoming a $5 trillion economy, PSBs—the dominant banks in our banking system—need to become efficient.
Box 1: Financial intermediation in the private sector for social impact:
The case of microfinance
The microfinance sector, especially given its transformation since 2000, provides a good illustration of how social goals can be achieved at scale using business models that are different from that of PSBs. Most microfinance institutions (MFIs) started as not-for-profit institutions. Post 2000, while their objective remained poverty alleviation via inclusive growth and financial inclusion, MFIs moved from purely pursuing social goals to the double bottom-line approach of achieving social and financial returns. The emphasis on social impact at the “bottom of the pyramid” combined with good financial returns of some of the leading MFIs, brought many mainstream commercial entities into the sector. For instance, some banks partnered with MFIs by lending to MFIs for on-lending the money to this segment and thereby fulfil their priority lending obligations. The United Nation’s declaration of Microfinance year in 2005 highlighted the role of MFIs in poverty alleviation. Some MFIs have transformed themselves into banks as well. Figure A shows the exponential growth in the impact that MFIs have had since 2000. As of 2016, 97 per cent of the borrowers were women with SC/ST and minorities accounting for around 30 per cent and 29 per cent of the borrowers. This shows that the loans given by these MFIs primarily cater to the marginal sections of the society.
Figure A: Exponential growth in customer reach by MFIs

BANKING STRUCTURE: NATIONALIZATION TO TODAY
7.13 Banking in India dates back to thousands of years. Several of India’s ancient texts including those in the Vedic period mention bank lending functions. The modern banking system in India has its roots in the colonial era starting in the 1800s. India’s public sector banks (PSBs) are essentially legacy banks from the colonial period that were subsequently nationalized. For example, India’s largest PSB which is currently the 55th largest bank globally, State Bank of India (SBI), was founded as Bank of Calcutta in 1806, took the name Imperial Bank of India in 1921 and became state-owned in 1955. The remaining PSBs in India were formed through two waves of nationalizations, one in 1969 and the other in 1980. After the 1980 nationalization, PSBs had a 91 per cent share in the national banking market with the remaining 9 per cent held by “old private banks” (OPBs) that were not nationalized.
7.14 The market structure of the banking sector has evolved in the 50 years since the 1969 nationalization. As of March 2019, PSBs had ` 80 lakh crore in deposits, held ` 20 lakh crore in government bonds, and made loans and advances of ` 58 lakh crore, representing between 65 per cent and 70 per cent of the aggregates for all scheduled commercial banks operating in India.2 They also hold about ` 20 lakh crore of the government debt, a large part of it driven by the requirements for a minimum “statutory liquidity” ratio. PSBs thus continue to have a significant footprint today albeit with a market share that is less than the 91 per cent share after the 1980 nationalization. The decline in PSB market share has been largely absorbed by “new private banks” (NPBs), which were licensed in the early 1990s after a liberalization of licensing rules that earlier regulated bank entry.
7.15 PSBs, OPBs, and NPBs are currently subject to similar banking regulations on virtually all aspects of their functioning including branching and priority sector lending. The key difference between the state-owned PSBs and private banks is that PSBs enjoy less strategic and operating freedom because of majority government ownership. The government exercises significant control over all aspects of PSB operations ranging from policies on recruitment and pay to investments and financing and bank governance including board and top management appointments. The majority ownership of the government and its writ on bank functioning also results in an implicit promise of the bailout of bank liabilities which is an implicit cost to the taxpayer. The majority ownership by the government also subjects PSB officers to scrutiny of their decisions by the central vigilance commission and the comptroller auditor general. With no real restrictions on what can be investigated and under what circumstances, officers of state-run banks are wary of taking risks in lending or in renegotiating bad debt, due to fears of harassment under the veil of vigilance investigations.
BENEFITS OF NATIONALIZATION
7.16 What did nationalization achieve? The allocations of banking resources to rural areas, agriculture, and priority sectors increased. Consider some of the raw statistics in the first decade after the 1969 nationalization. The number of rural bank branches increased ten-fold from about 1,443 in 1969 to 15,105 in 1980 compared to a two-fold increase in urban and semi-urban areas from 5,248 to 13,300 branches. Credit to rural areas increased from ` 115 crore to ` 3,000 crore, a twenty-fold increase and deposits in rural areas increased from ` 306 crore to ` 5,939 crore, again a twenty-fold increase. Between 1969 and 1980, credit to agriculture expanded forty-fold from ` 67 crore to ` 2,767 crore, reaching 13 per cent of GDP from a starting point of 2 per cent. This growth represents a significant correction to the undersupply of credit to farmers that drove nationalization. Both rural bank deposit mobilization and rural credit increased significantly after the 1969 nationalization.
7.17 However, some caution is necessary in interpreting the above trends as being entirely caused by nationalisation. A key confounder in such an interpretation is the role played by other interventions around bank nationalization. For instance, the government initiated a “green revolution” between 1967 and 1977. In addition, multiple anti-poverty programmes mark India’s 4th and 5th five-year plans that bookend its nationalization. Confounding effects are introduced by the policies pursued by RBI after nationalization. Its directed lending programmes set lending targets for priority sectors, using a complex mix of pricing formulas that determined the rates of interest to be charged by banks on different types of credit, in styles reminiscent of central planning rather than market economies. RBI used both formal means and moral suasion to persuade banks to achieve the targets it set. These tools carried special force given that banks were essentially operating in a marketplace sheltered from entry.
Box 2: Research based evidence on the impact of Nationalisation
Conclusions about what nationalisation has achieved must consider the counter-factual situation of what could have been achieved had there been no nationalization. The benefits of nationalization can only be estimated using this counterfactual. There have been some careful studies that have looked at the impact of bank nationalization using this careful lens. The findings are mixed.
Burgess and Pande (2005) study the RBI’s 4:1 formula where a bank was required to open 4 rural branches to obtain a license to open an urban branch between years 1977 and 1991. They find that the policy led to significant reduction in poverty in financially less developed states. However, Kochar (2005) argues that integrated rural development program (IRDP), the Government’s flagship poverty alleviation program, was actively implemented during this period with greater intensity in financially less developed states. Therefore, it is almost impossible to conclude that government bank branch expansion caused reduction in poverty. Panagariya (2006) also rejects the findings in Burgess and Pande (2005) by arguing that the branch expansion program of similar intensity existed even before nationalization and hence the 1977-1991 period is not special in terms of branch expansion. In other words, differential impact on poverty seen during 1977-1991 cannot be attributed to nationalization.
Finally, Cole (2009) carefully examines the impact of the second wave of bank nationalization undertaken in the year 1980. He exploits the fact that banks above certain threshold size were nationalized and compares regions having higher proportion of banks that marginally crossed the nationalization threshold and regions having higher proportion of banks that narrowly missed the threshold. The study finds no significant benefit of nationalization on the real economy. In fact, he shows that employment in trade and services declines and the quality of financial intermediation deteriorated. There was increase only in the quantity of credit.
Over and above these studies, we also know that despite nationalization a significant portion of the poor remained unbanked till 2014. Financial inclusion, in large part, happened in August 2014 through the Pradhan Mantri Jan Dhan Yojana (PMJDY), the first week of which saw more than 18 million bank accounts—a record in the Guinness Book of World Records.
THE WEAKENING OF PUBLIC SECTOR BANKS
7.18 The 2019 performance statistics concerning PSBs are sobering. In 2019 public sector banks reported gross and net NPAs of ` 7.4 lakh crore and ` 4.4 lakh crore respectively, amounting to about 80 per cent of the NPAs of India’s banking system. The gross NPAs of PSBs amount to a significant 11.59 per cent of their gross advances, although a slightly encouraging trend is that the NPA ratio is below the 14.58 per cent ratio in 2018, raising hopes that the nonperforming asset problem has peaked and is now coming down. Moreover, in 2019, PSBs suffered losses of ` 661 billion compared to profits of ` 421 billion of other scheduled commercial banks or profits of `390 billion of the NPBs. Besides the NPAs leading to losses, frauds are another source of concern in PSBs. The Reserve Bank of India (RBI)’s supervisory returns reveal that PSBs account for 92.9 per cent of the 5,835 cases of fraud and 85 per cent of the fraud amounts of about ` 41,000 crore reported in 2017-2018.3 Despite the past accomplishments of PSBs, of which plenty are noted later in this chapter, PSBs are clearly not efficient today.
Comparing averages
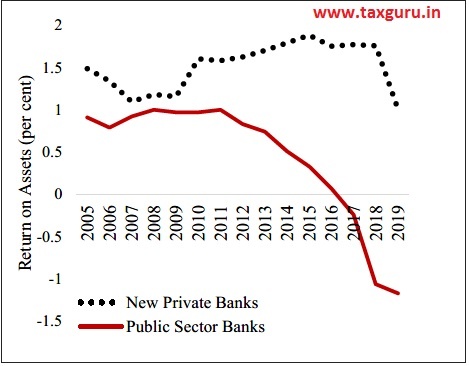
7.19 Trends over time that contrast PSBs and NPBs in a “difference-in-difference” sense reveal that the PSB weaknesses did not develop suddenly. Figure 8 reports the return on assets (ROA) for PSBs and NPBs from 2005 to 2019. While both PSBs and NPBs have similar ROAs prior to 2009, PSB ROAs decline starting in 2009 and continue through 2019. ROA of NPBs increases till 2013 and declines thereafter, which reflects common trends in all banks since 2013. However, the decline in ROA for PSB is far steeper.
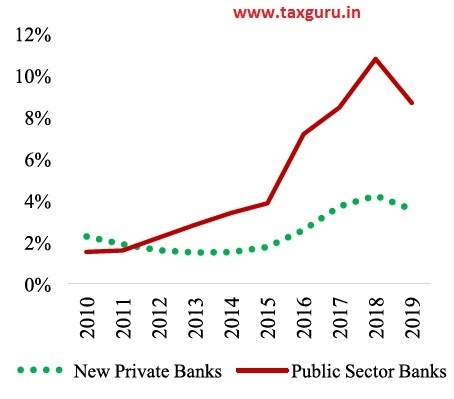
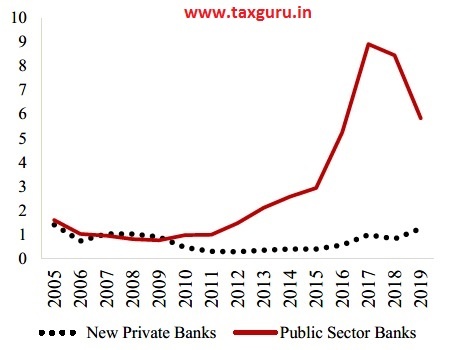
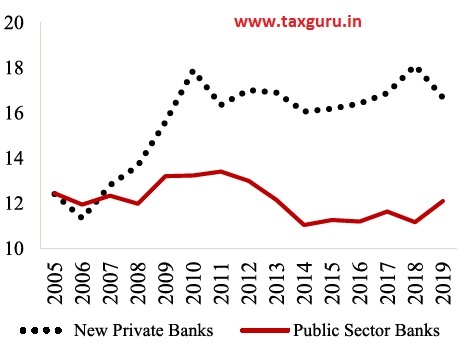
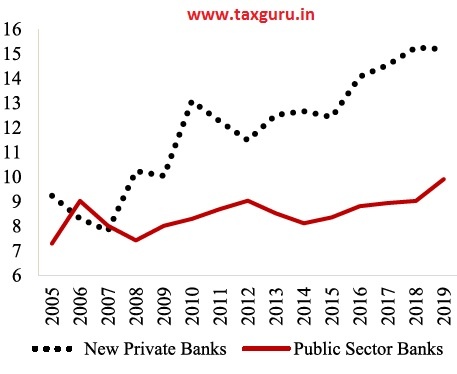
7.20 Figure 9 shows a similar trend in the Return on Equity (ROE). Figures 10 and 11 display the ratio of the gross and net NPAs to gross advances. Both ratios increase sharply after 2010 for PSBs but the trend lines are far less step or even flat until recently for the NPBs. Figures 10 and 11 clearly suggest that asset quality problems developing over a few years are at the root of the PSB performance slide. Figure 12 displays the total capital adequacy ratio for the two types of banks while Figure 13 depicts the core “Tier 1” capital ratio. These ratios show that the bank losses have impaired the capital bases of the PSBs relative to their private peers.
7.21 A plausible explanation for the NPA problems of PSBs is that in the Indian economy’s growth phase between 2004 and 2011, PSBs grew their loan portfolios but this credit growth was of suspect quality. When the economy slowed, the banking system saw a dramatic increase in NPAs.
Figure 8: Return on Assets of Banks ( per cent)
Source: RBI Data and Survey Calculations
Figure 9: Return on Equity of Banks ( per cent)

Source: RBI Data and Survey Calculations
Figure 10: Gross Non-Performing Assets to Advances ( per cent)
Source: RBI Data and Survey Calculations
Figure 11: Net Non-Performing Assets to Advances (per cent)
Source: RBI Data and Survey Calculations
Figure 12: Total Capital Adequacy Ratio ( per cent)
Source: RBI Data and Survey Calculations
Figure 13: Tier-1 Capital Adequacy Ratio ( per cent)
 Source: RBI Data and Survey Calculations
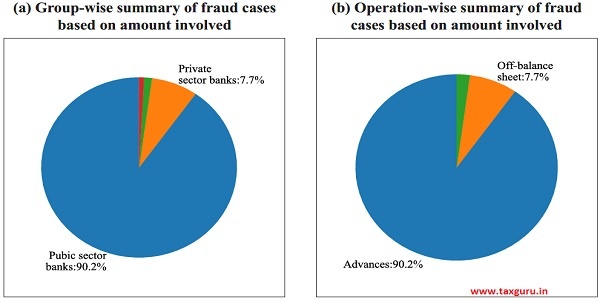
7.22 Figure 14a shows clearly that over 90 per cent of the cases of bank frauds based on the amount involved occurred in PSBs with private sector banks accounting for less than 8 per cent. A large majority (90.2 per cent) of these frauds related to advances (Figure 14b). Chakrabarty (2013) highlights that about 90 per cent of advances above ` 1 crore occur in PSBs. Therefore, the quality of screening and monitoring processes for corporate lending adopted by PSBs needs urgent attention.
Figure 14: Frauds in banks ( per cent)
Source: RBI and Survey Calculations
7.23 The poor performance of PSBs across the range of metrics is also reflected in their equity values. Figure 15 shows the ratio of the market value of equity to the book value of equity for the two types of banks. The median market-to-book ratio of PSBs equals 0.64, which is less than 1/5th the median of 3.33 for the NPBs.
Figure 15: Distribution of Market-to-book ratios of Banks

Source: Data from Money control
Comparison accounting for heterogeneity among PSBs and within NPBs
7.24 It must be carefully noted why a comparison between the average performance of PSBs and average performance in NPBs is an appropriate, apples-to-apples comparison. As with any economic activity, heterogeneity in performance is inevitable. Just as there is a wide variation within PSBs in their performance with some PSBs performing better than others, similarly, there is some variation in the performance of NPBs as well. However, to compare the performance of the average PSB with either the best performing NPB or the worst performing one is incorrect as that mixes up two statistical measures – averages and outliers – and leads to an apples-to-oranges comparison.
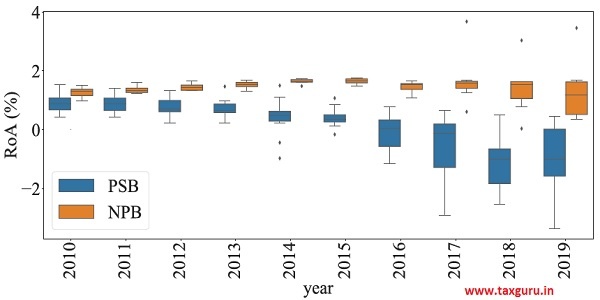
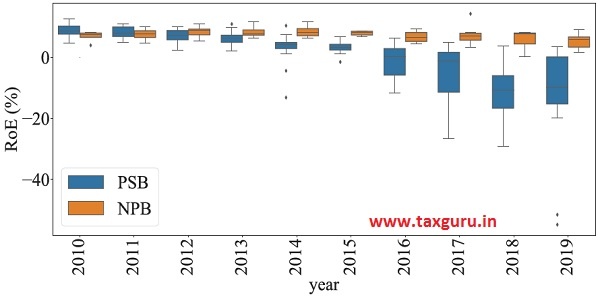
7.25 To undertake a comparison by accounting for the heterogeneity in performance, we examine the distribution of ROA for PSBs and NPBs in Figure 16 using box plots (see box 3 to understand the box plot). It is clear from this figure that for every year since 2013 the ROA of the best performing PSB has been lower than the ROA of the worst performing NPB. A similar, albeit less stark, pattern is observed for the ROE as well.
Figure 16a: Heterogeneity in Return-on-assets
Source: RBI Data and Survey Calculations
Figure 16b: Heterogeneity in Return-on-equity
 Source: RBI Data and Survey Calculations
Box 3 – Box plot explained
The boxplot displays: (a) the minimum denoted by the lowest horizontal line, (b) first quartile denoted by the bottom line of the rectangle (c) median denoted by the line inside the rectangle, (d) third quartile denoted by the top line of the rectangle, and (e) the maximum denoted by the top most horizontal line.
7.26 These statistics are particularly telling because both the NPBs and PSBs operate in the same domestic market. Yet, we see an asymmetry in bank performance which has cleaved significantly over the last decade. It is important to note that the pictures do not necessarily denote worse decision-making by banks in the last decade. The history of financial crises across the world shows that the effect of bad governance shows up only in bad times, never in good times. As the 2014 P. J. Nayak Committee report shows, the structural weaknesses in PSBs explains their poor performance.
7.27 Some may contend that the poor performance over the last few years represents a passing phase. However, this interpretation essentially ignores the considerable body of knowledge about the histories of banking crises, which tells us that poor banking sector performance inevitably stems from a set of known systemic factors. As Laven (2011) points out, banking crises are due to some combination ofunsustainable macroeconomic policies, market failures, regulatory distortions, and government interference in the allocation of capital. Moreover, crises that are not resolved effectively and swiftly impose enormous costs on society.
ENHANCING EFFICIENCY OF PSBs: THE WAY FORWARD
7.28 The key drivers of India’s growth prospects are now (a) highly favourable demographics – with 35 per cent of its population between 15 and 29 years of age; (b) a modern and modernizing digital infrastructure that encompasses the “JAM” trinity of financial inclusion, the Aadhaar unique identification system, and a well- developed mobile phone network, and (c) a uniform indirect taxation system (GST) to replace a fragmented, complex state-level system.4 India’s growth path depends on how quickly and productively these growth levers are deployed using a well-developed financial system.
7.29 Previously, the Narasimhan Committee (1991, 1997), Rajan Committee (2007) and P J Nayak Committee (2014) have provided several suggestions to enhance the efficiency of PSBs. The Survey, therefore, focuses on two ideas for enhancing the efficiency of PSBs that have hitherto not been explored.
Credit Analytics using Artificial Intelligence and Machine Learning
7.30 India’s growth opportunities today, which stem from a unique confluence of several positives, position PSBs well to utilise FinTech. One is India’s demographic dividend. 62 per cent of India’s population is between 15 and 60 and a further 30 per cent of the population is under 15. Thus, India is poised to enjoy the benefits of a substantial working age population for a long period of time. The second force driving India’s growth opportunities is the JAM “trinity,” viz., the PMJDY bank account programme, the Aadhaar unique identity programme, and the mobile phone infrastructure, each of which has been implemented to cover practically the entire country. The growth in digital transactions as a result of these two factors has been significant (Figure 17). The use of direct benefit transfers, which increased from has increased exponentially over the last five years (Figure 18), has helped to bring both credit and deposits into the banking system (Figure 19) across all geographies (rural, semi-urban, urban and metropolitan). The high elasticities shown in Figure 19 across all geographies clearly demonstrate the opportunity that exists for Indian banks to benefit from the greater use of DBT by the Government.
Figure 17: Total Value of Digital Transactions between March 2016 and January 2019
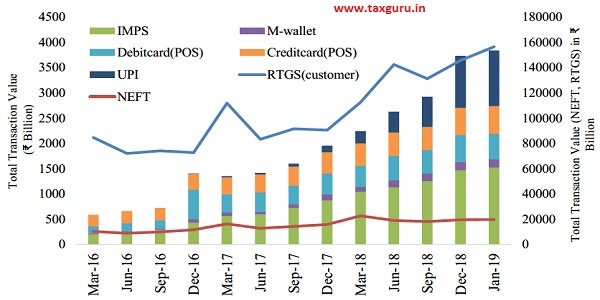
Source: Payment System Indicators, RBI
Figure 18: Trends in Amount Transferred and the Number of DBT Schemes
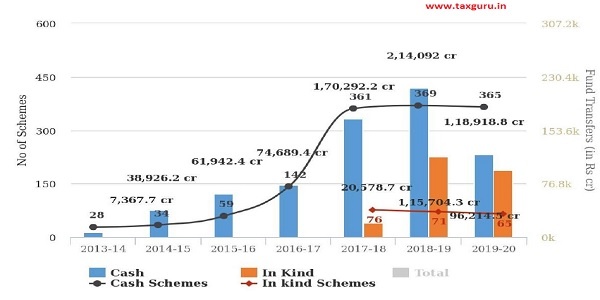
Source: DBT
Figure 19: Benefits of DBT to the Banking System
(a): Credit (b) Deposits

Source: DBT, RBI and Survey Calculations
7.31 All the above indicates the possibilities that exist for the Indian banking sector to grow proportionate to the scale of the Indian economy. The new programmes have resulted in a surge of individuals and businesses being brought into the formal economy. Perhaps more important is that the inclusion is backed by state-of-art digital infrastructure that generates and stores an abundance of high quality structured data on the all aspects of the economic lives of firms and individuals. Such data are, of course, the gold mine for economic growth in the 21st century. They offer essentially unlimited and uncharted possibilities, especially for firms and individuals who have been traditionally excluded from the financial system.
7.32 PSBs have many important ingredients in place to cater to this new demand. For example, they have local market insights and relationships based on operating histories spanning many decades. Their geographic footprint is vast. PSBs, however, need significant investments are in the capabilities to exploit the coming data-rich environment in India. Analytics based on market data are quite capable of providing accurate predictions of corporate distress. Variants of such approaches appear to hold promise for both consumer loans and commercial and industrial loans.
7.33 The data that can be employed for credit analytics is available in both structured and unstructured form. Data in a structured form include credit information and credit scores based on loan grants and repayments held in the credit registries or credit bureaus. The richer, though unstructured, micro-data is available in text, images, geo-tagged data, social network data, mobile apps, as well as other shallow or deep digital footprints of current and potential customers. Leveraging these data requires new data, analytics, and modelling skills. Likewise, banks need to invest in credit recovery infrastructure. The adoption of these new technologies to exploit a data rich environment will require complementary investments such as specialist human capital with an orientation towards analytics. The barriers to such technologies are not insurmountable. While there are some instances in which PSBs have been lax, technology aversion does not seem to be an intrinsic characteristic of PSBs. For example, when credit bureaus were introduced in India, PSBs in the aggregate were relatively quick to adopt scoring for their new clients (Mishra, Rajan, and Prabhala, 2019).
The benefits of credit analytics
7.34 A large proportion of NPAs of Indian banks, especially PSBs, could have been prevented if data and analytics were employed in corporate lending. Figure 20 shows that the rates of default were the highest with larger loans (above INR 100 crores). Figure 21-24 demonstrate clearly the several leading indicators that data and analytics could have clearly highlighted about wilful defaulters. Figure 21 shows the systematic differences in the disclosure of related party transactions, pledging of promoter shares, and large loans to related parties between wilful defaulters and non-defaulters, on the one hand, and wilful defaulters and distressed defaulters, on the other hand. These are easily quantifiable measures that a robust credit analytics platform could have easily picked up and provided warning signals.
Figure 20: Non-Performing Asset (NPA) Rate by Size of the Loan
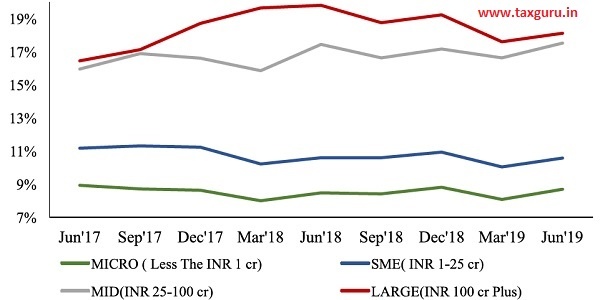
Source: TransUnion Cibil-Sidbi
7.35 In June 2017, the Reserve Bank of India (RBI) identified twelve companies constituting 25 per cent of India’s total Non-Performing Assets (NPAs). As shown in Figure 22, the accounting quality of these large defaulters is much below the median accounting quality of other similar listed corporates in 2012, 2013 and 2014. As accounting quality is easily quantifiable, a robust credit analytics platform could have easily picked up and provided warning signals.
Figure 21: Leading indicators of wilful default using disclosure of related party transactions, pledging of promoter shares, and large loans to related parties
Panel A: Comparing Wilful Defaulters and Non-Defaulters
Panel B: Comparing Wilful Defaulters and Distress Defaulters
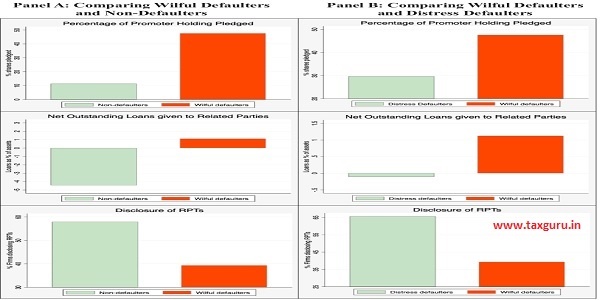
Source: CMIE Prowess, TransUnion CIBIL Suits Filed database. Notes: A firm is said to have made an RPT disclosure if its annual filing contains an RPT section (even if the firm states it had no transactions that year). Net outstanding loans refers to the total balance of loans given by firms to their related parties, net of loans taken from them. It is expressed as a percentage of the firm’s total assets. Wilful defaulters are those classified as such in the CIBIL Suits Filed database, while distress defaulters are those with a default credit rating at least once in the sample period but those who have not been classified as ‘wilful defaulters’. Non-defaulters are all other firms. Data spans 2002-18
Figure 22: Leading indicators using accounting quality measures for large defaulters
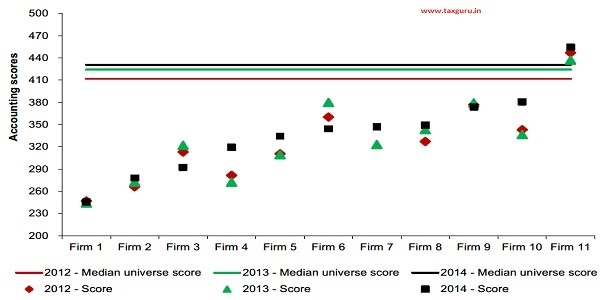
Source: Company Financials, Insolvency and Bankruptcy Board of India, RBI
7.36 Similarly, an analysis of the annual reports of the large defaulters suggests that the quality of audit disclosure in these firms was very poor. As can be seen from Figure 23, out of the twelve large defaulters, one of them had just one indicator disclosed with most others having three to four indicators disclosed of the eight leading indicators. Again, this is an easily detectable characteristic that a robust credit analytics platform could easily flag.
Figure 23: Leading Indicators using quality of financial statement disclosures by large defaulters

Source: Company Financial Reports and Survey calculations
7.37 Figure 24 shows that the information sharing among lenders on NPAs was minimal as of 2014. While this information sharing was better among PSBs than NPBs, about a quarter of accounts that were declared as NPAs by other banks were classified as NPA in the bank’s account. This proportion has increased dramatically to reach 95 per cent in just a few years.
Figure 24: Proportion of Lenders Tagging an already tagged NPA (by another bank) as NPA in their books
Box 4: A note on leveraging data to protect creditors’ collateral
Most corporate term loans are secured and lenders have recourse to pledged assets in the event of default. However, when dealing with wilful defaulters, lenders find their hands tied even when they have a contractual lien on pledged assets. Wilful defaulters have a natural incentive to misrepresent the value of collateral. In more egregious cases, they may pledge fictitious collateral. If they pledge genuine collateral, they have an incentive to dispose of these assets without the lender’s knowledge, lest they lose control of valuable assets after they default.
Data can come to lenders’ rescue in such cases. For example, geo-tagging – the process of adding geographical identification such as latitude and longitude to photos, videos or other media – can help lenders keep track of the location of assets. If borrowers are mandated to periodically share geo-tagged evidence of collateralized assets with their lenders, it would be difficult for them to remove these assets by stealth. Several government departments have already taken the lead in geo-tagging; the Ministry of Rural Development geo-tags MGNREGA assets and the Department of Land Resources geo-tags watershed projects. Lenders may learn from these examples to monitor their collateral. Geo-tagging can also help verify the value of pledged land or property. Armed with the exact location of land, lenders are better placed to evaluate the market value of these assets, the bulk of whose value derives from their location.
GPS systems can confer even more monitoring power. GPS devices, when affixed to collateralized equipment or machinery, can alert lenders if these assets are moved out of the plant. Such tracking systems ensure that the asset never leaves the lender’s sight. For instance, renting companies that lease laptops, appliances etc. have demonstrated a powerful use of remote monitoring using GPS. These electronic items often come with remote kill switches that disable all functions if the renter attempts to tamper with the asset, dispose of it, or delay rent payments. It may similarly serve lenders well if they could, say, disable a vehicular asset remotely if the borrower attempts to dispose of it or wilfully defaults on the loan. Kingfisher Airlines pledged a few helicopters (among other assets) to obtain loans. Only when the lenders attempted to take possession of these assets did they realize that the helicopters had fallen into disrepair and could fetch little more than scrap value. Therein lies a strong application of low-cost technology to track the presence, use and quality of assets.
Integrated data on collateral across all lenders in a geography may be particularly useful in curbing double-pledging of collateral. For example, a party may pledge the same collateral to multiple lenders to obtain multiple lines of credit for the same project, or a buyer and his seller may both separately obtain credit for the same trade by presenting the same invoice to their respective lenders. As long as lenders rely on human control processes and paper-based documentation to verify trades, such double-pledging easily escapes notice. SWIFT India – the messaging platform that PNB used to transmit messages in the Nirav Modi case – recently announced a pilot blockchain effort that allows lenders to log invoices and e-bills submitted to them online, allowing other lenders to verify whether a trade they are looking to finance has already been funded or the underlying collateral already pledged. Such integrated data systems are essential to protect lenders.
While these technologies are powerful, they carry an important risk, i.e., the risk of infringing upon the borrower’s privacy and dignity. Enforcement of debt obligations should not encroach into the borrower’s private sphere, as much as a lender may suspect an impending case of wilful default. Therefore, strong and clear policy guidelines are needed on what data may be collected, how, by whom and for how long.
In sum, wilful default would not be as much of a drain on an economy’s wealth if lenders could fully recover their dues from selling pledged assets. Technology and data can be put to powerful use to keep these assets secure and saleable, thus keeping intact an important recourse for lenders. In fact, the threat of losing valuable assets may itself be a deterrent to wilful default in the first place, as these firms often wilfully default only when they are unafraid of losing control of other valuable pledged assets.
Learning on use of credit analytics for corporate lending from retail loans
7.38 Retail lending in India passed through a painful and steep learning curve after 20072008. The NPAs in retail loans primarily impacted the unsecured loans originated by NPBs. While the size of the NPAs was insignificant from a systemic perspective, the sector took its learning from the same. As seen in Figure 25, the NPA levels across various retail products has been less than 5 per cent during 2016-19. The use of credit analytics and the resultant reduction in defaults offers important lessons that can be implemented in corporate lending in India.
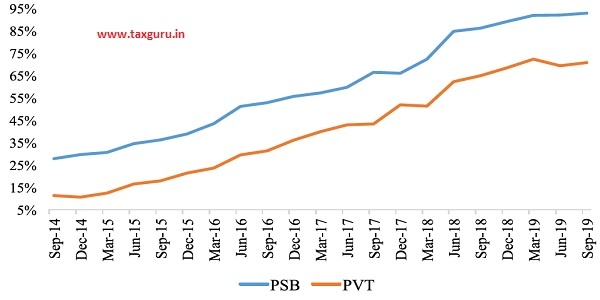
7.39 In fact, the use of data and credit analytics, such as consumer credit bureau data, has significantly enhanced growth in retail lending. As Figure 26 shows, India has now caught up the OECD economies in the proportion of population covered using credit bureau data. NPBs, in fact, expanded the use of consumer credit bureau data significantly since 2006 (Figure 27).
Creation of a FinTech Hub for PSBs: The Public Sector Banking Network (PSBN)
7.40 PSBs were quick to adopt credit score by bureaus (Mishra, Rajan, and Prabhala, 2019).
Figure 25: NPA Levels in Retail Loans by Major Products (2016-19)
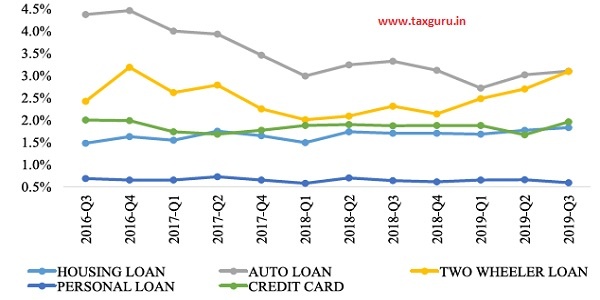
Source: CIBIL Data
Figure 26: India caught up with OECD Credit Bureau Coverage ( per cent of Adult Population)

Source: World Bank –Ease of Doing Business Report 2019
Figure 27: Usage of Credit Bureau Data in New Private Sector Banks
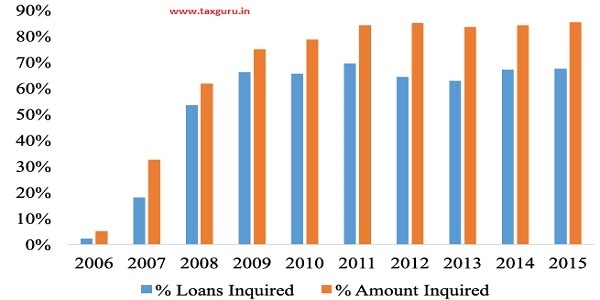
Source : Mishra, Prabhala, Rajan 2019
Similarly, they need to embrace FinTech, which is revolutionising the global financial landscape. FinTech is forcing traditional banks to review their outdated business paradigms to come up with effective, low-cost, banking solutions. PSBs have the maximum to gain from FinTech as their use of even conventional information technology is not all-pervasive, except in the use of core banking solutions. As of now, PSBs employ technology mostly for MIS and reporting while most information processing on loans happens manually which causes inefficiency, frauds and loan defaults. Information processing includes all activities related with the ex-ante screening of potential borrowers and the ex-post monitoring of their behaviour.
7.41 FinTech has radically changed the way information is processed by banks. In corporate lending, for instance, a huge mass of quantitative data such as company financials and qualitative data such as company filings and analyst call reports are machine-analysed using both supervised and unsupervised learning algorithms. Tools such as Machine Learning (ML), Artificial Intelligence (AI) as well as Big Data and matching provide banks the ability to recognize patterns quickly by analysing vast datasets, an activity that would be virtually impossible for humans, even using conventional information technology. The idea is not new as even standard econometric models are but tools for pattern recognition. The novelty lies in analysing extremely large sets of data using algorithms that explore, learn and identify patterns. As Figure 28 shows, investments in FinTech in India are significant. Therefore, PSBs can benefit from the expertise that already resides in India in this area.
Figure 28: VC, PE and M&A Investment Activity in FinTech in India, 2013-18
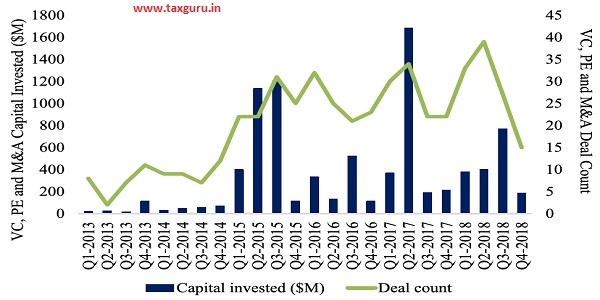
Source: Pulse of Fintech 2018, Biannual Global Analysis of Investment in Fintech, KPMG International.
7.42 Currently, PSBs face many challenges such as high operating costs, disjointed process flows from manual operations and subjective decision making. These challenges hinder PSB’s ability to rigorously screen corporate borrowers ex-ante by evaluating the prospects of the potential borrowers and the value of the collateral that they may be posting. They also need to monitor the borrower ex-post along the whole duration of the lending relationship, possibly enforcing covenants capable of limiting losses in case of default. Using FinTech allows banks to better screen borrowers and set interest rates that better predict ex-post loan performances (Rajan, 2015).
7.43 PSBs will be able to enhance their efficiency by fulfilling their role of delegated monitors if all the PSBs can pool their data into one entity. Private information held by their corporate borrowers leads to contracting problems, because it is costly to assess the solvency of a borrower or to monitor her actions after lending has taken place (Stigliz and Weiss, 1981). Moreover, the delegation of screening and monitoring to banks has been shown to be an efficient mechanism (Diamond, 1984). This efficiency can be enhanced further by packaging all the information held by various PSBs into a common entity. This would have the additional benefit of reducing the costs of screening and monitoring.
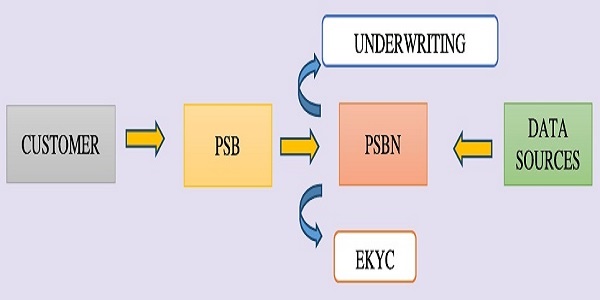
7.44 As the Government is the owner of all the PSBs, it can mandate the PSBs to share this data so that economies of scale can be utilized to make the necessary investments in undertaking analytics using Artificial Intelligence and Machine Learning (AI-ML). The survey proposes establishment of a GSTN like entity, called PSBN (PSB Network), to use technology to screen and monitor borrowers comprehensively and at length. Apart from utilizing data from all PSBs, which would provide a significant information advantage, PSBN would utilize other Government sources and service providers to develop AI-ML ratings models for corporates. The AI-ML models can not only be employed when screening the corporate for a fresh loan but also for constantly monitoring the corporate borrower so that PSBs can truly act as delegated monitors. Box 3 provides the architecture and solution flow for the proposed PSBN for all types of bank customers including individuals, SMEs and large corporations.
Box 5: Suggested Architecture and Solution Flow for FinTech in PSBs
Schematic Architecture:
Solution Flow:
1. Customer contact: Customer approaches the PSB and indicates the amount and type of loan she wishes to borrow.
2. KYC verification: PSB transfers the above information to the entity. The entity will complete KYC process for customer based on data provided by identity verification agencies e.g., Aadhaar based EKYC. As per norms, KYC must be confirmed by Banks for loan provision through PSBs. So, engine will collate data and pass on to PSBs for KYC confirmation.
3. Data Collections: Engine will further collate data from various data sources based on customer profile. Data will be collected from:
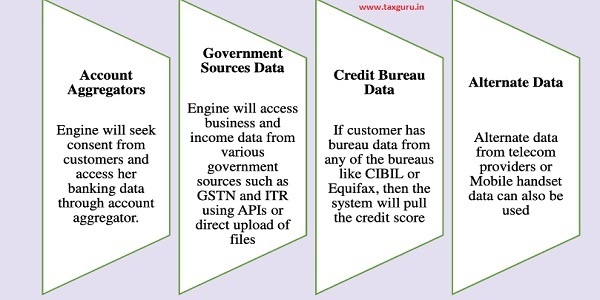
System will have complete credit underwriting, which refers to generating credit profile of the customer after analysing all available data, based on the model built into it. Different AI-ML underwriting models will be built for different types of customers such as individuals, SMEs and large corporations.
4. Loan provision: Based on KYC and underwriting, system will assess customer eligibility of loans and transfer all the information to the PSB. On the basis of the information provided, PSB can take the decision on the amount and the rate at which the loan is to be given.
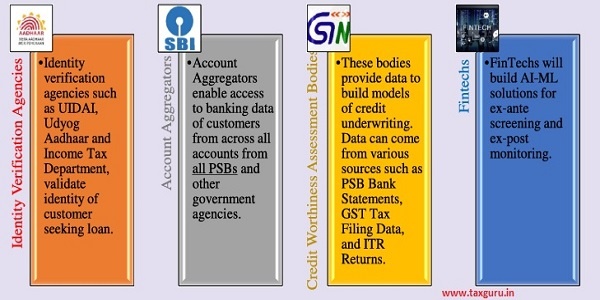
Key Participants:
7.45 The benefit of PSBN would be that it would take advantage of the data that all PSBs have of the last 50 years to create better underwriting solutions. Using PSBN, they would be able to do better underwriting of loans to their corporate clients. Better decision making on credit underwriting would reduce the burden of NPAs, apart from helping them in fraud prevention. The high operating costs of each PSB would decrease by helping them automate the end-to-end process of lending. PSBs would be able to make quicker decisions, process loan applications faster, and reduce turn-around-times (TAT). These would, in turn, help PSBs to compete better with NPBs. In fact, PSBN can provide informational advantages that NPBs are unlikely to be able to match.
The case for employee stakes in PSBs
7.46 Employees paid largely in salaries— as PSBs employees currently are—have claims that resemble debt contracts in the sense that they are fixed pay-outs made by banks. Employees paid through such fixed compensation contracts rely on implicit promise by the state to make good on their salaries (and post-retirement pensions) in the event of bank distress. In the parlance of financial economists, such employees have “inside debt,” which induces conservatism and preference for safety over risk-taking even among senior executives (e.g., Edmans and Liu, 2011). Given the current flat compensation contracts of employees and the pressures from ex-post monitoring by the vigilance agencies, it is hardly surprising that bank employees of state-owned banks prefer safety and conservatism over risk-taking and innovation. A long-term solution to this problem is enabling employees to own stakes in the PSBs.
7.47 To enable employees to become owners in the banks and thereby incentivise them to embrace risk-taking and innovation continually, a portion of the government stakes can be transferred to employees exhibiting good performance across all levels of the organization through Employee Stock Option Plans (ESOPs).
7.48 Part-ownership of PSBs by employees will reduce agency problems. This is because employees who own shares are incentivized to increase market value of equity, since their direct compensation depends on share values.
Other benefits include the possible change of the mind-set from that of an employee to that of an owner. Employees can constitute one of the blocks of new owners of PSBs through an employee stock ownership plan (ESOP) that is conditioned on employee performance. Ownership by motivated, capable employees across all levels in the organization could give such employees tangible financial rewards for value enhancement, align their incentives with what is beneficial to the PSB, and create a mind-set of enterprise ownership for employees.
The need for best talent and organizational verticals based on technology
7.49 A related issue pertains to the process for recruitment of bank officials. PSBs cannot, for instance, recruit professional MBAs directly from the campuses. Given the FinTech disruptions described above, PSBs need to enable cutting-edge recruitment practices that allow lateral entry of professionals and recruitment of professionally trained talent at the entry level. For example, the possibilities generated by FinTech call for recruitment of professionals with domain skills in technology, data science, finance, and economics. With a large ownership stake available for employees, attracting the best talent in the industry may not be a constraint, as it is currently. The advances in FinTech and data science may even call for entirely new verticals such as innovation labs, accelerators, venture arms, and sandboxes for experimentation, that take stakes in and empower smaller entrepreneurial ventures, much as in the collaborations between big pharma and the biotech sectors.
7.50 Embracing disruptive innovations through disruptive processes is difficult. It requires a degree of risk-taking, a more flexible human capital acquisition strategies at all levels, and complementary incentive structures that may, for instance, offer more high-powered incentives that offer greater pay for success. A generous ownership offer by the Government to PSBs employees would help them provide the incentive structures to attract high-quality banking professionals and thereby improve their human capital acquisition strategies.
CONCLUSION
7.51 The Indian banking system is currently sub-scale compared to the size of the economy. A large economy needs an efficient banking sector to support its growth. Historically, in the last 50 years, the top-five economies have always been ably supported by their banks. Should India’s banks play a role proportionate to its economic size, India should have six banks in the top 100. As PSBs account for 70 per cent of the market share in Indian banking, the onus of supporting the Indian economy and fostering its economic development falls on them. Yet, on every performance parameter, PSBs are inefficient compared to their peer groups. Previously, the Narasimhan Committee (1991, 1997), Rajan Committee (2007) and P J Nayak Committee (2014) have provided several suggestions to enhance the efficiency of PSBs. The survey suggests use of FinTech (Financial Technology) across all banking functions and employee stock ownership across all levels to enhance efficiencies in PSBs. These will make PSBs more efficient so that they are able to adeptly support the nation in its march towards being a $5 trillion economy. All these recommendations need to be seriously considered and a definite, time-bound plan of action drawn up. With the cleaning up of the banking system and the necessary legal framework such as the IBC, the banking system must focus on scaling up efficiently to support the economy.
CHAPTER AT A GLANCE
> In 2019, India completed the 50th anniversary of bank nationalization. It is, therefore, apt to celebrate the accomplishments of the 389,956 officers, 295,380 clerks, and 121,647 sub-staff who work in Public Sector Banks (PSBs). At the same time, an objective assessment of PSBs is apposite.
> Since 1969, India has grown leaps and bounds to become the 5th largest economy in the world. Yet, India’s banking sector is disproportionately under-developed given the size of its economy. For instance, India has only one bank in the global top 100 – same as countries that are a fraction of its size: Finland (about 1/11th), Denmark (1/8th), Norway (1/7th), Austria (about 1/7th), and Belgium (about 1/6th). Countries like Sweden (1/6th) and Singapore (1/8th) India’s size have thrice the number of global banks as India does.
> A large economy needs an efficient banking sector to support its growth. Historically, in the last 50 years, the top-five economies have always been ably supported by their banks.
> As PSBs account for 70 per cent of the market share in Indian banking, the onus of supporting the Indian economy and fostering its economic development falls on them. Yet, on every performance parameter, PSBs are inefficient compared to their peer groups. In 2019, every rupee of taxpayer money invested in PSBs, on average, lost 23 paise. In contrast, every rupee of investor money invested NPBs on average gained 9.6 paise. Also, credit growth in PSBs has been much lower than NPBs for the last several years.
> The survey suggests solutions that can make PSBs more efficient so that they are able to adepsly support the nation in its march towards being a $5 trillion economy.
> To incentivize employees and align their interests with that of all shareholders of banks, bank employees should be given stakes through an employee stock ownership plan (ESOP) together with proportionate representation on boards proportionate to the blocks held by employees.
> A GSTN type of entity should be setup to enable the use of big data, artificial intelligence and machine learning in credit decisions, especially those pertaining to large borrowers. As Government is the owner of all the PSBs, Government has the right to use the data that PSBs generate during their business. Therefore, the Government as the promoter must set up this entity that will aggregate data from all PSBs to enable decision making using big data techniques. The patterns in default that such powerful techniques can unearth are far beyond the capacity of any unscrupulous promoter to escape. Therefore, such investments are critical to ensuring better screening and monitoring of borrowers, especially the large ones.
> With the cleaning up of the banking system and the necessary legal framework such as the Insolvency and Bankruptcy Code (IBC), the banking system must focus on scaling up efficiently to support the economy.
REFERENCES
Chakrabarty, K.C., (2013), Two decades of credit management in banks: Looking back and moving ahead (Address by Dr. K. C. Chakrabarty, Deputy Governor, Reserve Bank of India).
Diamond, Douglas W. “Financial Intermediation and Delegated Monitoring.” The Review of Economic Studies 51, no. 3 (1984): 393-414. Accessed January 25, 2020. www.jstor.org/stable/2297430.
Edmans, Alex and Liu, Qi, Inside Debt (June 29, 2011). Review of Finance, Vol. 15, No. 1, pp. 75-102, January 2011; EFA 2007 Ljubljana Meetings Paper. Available at SSRN: https://ssrn.com/abstract=758508.
Mishra, Prachi and Prabhala, Nagpurnanand and Rajan, Raghuram G., The Relationship Dilemma: Organizational Culture and the Adoption of Credit Scoring Technology in Indian Banking (March 5, 2019). Johns Hopkins Carey Business School Research Paper No. 19-03. Available at SSRN: https:// Ssrn.com/Abstract=3347299.
Narasimhan Committee I (1991), Report of the Committee on Financial Systems, Reserve Bank of India.
Narasimhan Committee II (1998), Report of the Committee on Banking Sector Reforms, Reserve Bank of India.
Nayak Committee (2014), Report of the Committee to Review Governance of Boards of Banks in India, Reserve Bank of India.
Rajan Committee (2007), Report of the Committee on Financial Sector Reforms, Government of India.
Rajan, U., Seru, A., and Vig, V. (2015). The Failure of Models That Predict Failure: Distance, Incentives, and Defaults. Journal of Financial Economics, 115, 237-260.
Stiglitz, Joseph E., and Andrew Weiss. “Credit Rationing in Markets with Imperfect Information.” The American Economic Review 71, no. 3 (1981): 393-410. Accessed January 25, 2020. www.jstor.org/ stable/1802787.
Post Link:-
1 Source: RBI data
2 Aggregate banking statistics are from the Database on the Indian Economy (DBIE) maintained by the Reserve Bank of India. See https://dbie.rbi.org.in/
3 Statistics from chapter VI of the RBI Annual Report released on August 29, 2018, accessed at https://rbi.org.in/scripts/AnnualReportPublications.aspx?Id=1233
4 The “JAM” trinity underpins the digital infrastructure. The “PMJDY” bank account programme enrolled 37.8 crore beneficiaries whose balances have crossed ` 1.11 lakh crore. Over 120 crore unique identification cards have been issued. More than 128 crore mobile phones and a unified payments interface serve India’s population of 137 crore.


