The invention of the wheel set in motion the necessity of travelable paths, and since then the saga of infrastructure has expanded from canals to modern capital structures such as railways, roads etc. depending on the necessities of the region. In the last 75 years in India since Independence, infrastructure development has moved on a consistent growth curve building the assets required by the nation across sectors such as transportation, housing, commercial development, telecom and most recently, sanitation. As a key enabler of socioeconomic enhancement of a region, the government has used ‘social overhead capital’ to push development in the remotest areas of the country through dedicated budgetary allocation, cross-subsidising revenue-generating infrastructure and focussed programme delivery. This has helped in expanding physical transportation and connectivity, providing services at point-of-use and deepening digital penetration.
Infrastructure, being a melange of numerous sectors, its multiplier effects in the economy cannot be realised if it operates in silos. Thus, in 2019, Government of India adopted a forward-looking programmatic approach towards infrastructure. The National Infrastructure Pipeline was born with a projected investment of around ₹111 lakh crore for FY20-25 for developing a comprehensive view of infrastructure development in the country, monitoring its progress at the highest levels in the government for timely completion, and enabling a pipeline view for investors for them to plan infrastructure investments. The funding for infrastructure comes from a variety of sources, from government to private sector to multilateral. However, given the quantum of funding involved, a creative financing option such as asset monetisation was also envisaged through the 5 lakh crore National Monetisation Pipeline. Apart from generating critical financial resources, private participation in running risk-free brownfield assets will also help in ushering in operational efficiencies and better management of public assets.
The programmatic approach to infrastructure is complemented by structural and financial reforms such as infrastructure financing options of InvITs and REITs, creation of Dedicated Financing Institution (NaBFID), recapitalisation of other sectoral DFIs, push to PPP ecosystem through Model Concession Agreements by line ministries and enabling social infrastructure development through the revamped Viability Gap Funding scheme.
To bring in further convergence with comprehensive planning across centre and states, PM GatiShakti has sectoral complementarity of logistics facilitation through the National Logistics Policy launched in Sept 2022. All of this is expected to tighten the nuts and bolts for the arduous infrastructure journey that our country has undertaken together by the participation of centre, state, local governments and the private sector.
This story has seen many successes. While roads, railways, and waterways have seen unprecedented expansion in the last eight years, ports and airports have been substantially upgraded. This has also helped the country move from unimodal to multi-modal transportation, providing a window of opportunity to the private sector to invest and reinvest in these assets, which has already been facilitated by the policy of asset monetisation. Extending infrastructural facilities is only part of the story; modernisation is the other important principle that has been attempted with verve and achieved with commendable speed.
In keeping with the winds of change around the globe, we have placed a great emphasis on digital and communications development, but, have taken the principle to new heights in terms of usability, interoperability and accessibility. The country has come a long way from a time when a basic telephone connection was viewed as a luxury, to a stage where most individuals now have a mobile connection. It is not a hyperbole to state that with the thrust on Digital India, the story of digital infrastructure and services in India will always be seen by the world with a certain regard and appreciation. In a very short time, the country has seen a great multiplier effect on social and economic growth through the different uses of digital enablement led by the humble mobile phone and the Aadhar number– targeted beneficiary identification for various benefits, provision of healthcare and education services and financial inclusion. Close on this, arrived the success story of India’s sui-generis payment infrastructure (UPI), which travelled internationally with select adoption and global acclaim. The bouquet of digital public infrastructure products like e-rupi,e-way bill, TReDS for MSMEs etc have ensured real value for money to consumers while reducing the compliance burden for producers. And now, with the vision of $1 trillion digital economy by 2025, the government is marching towards providing more and more e-governance based services.
All of these developments are a testament to the fact that India has been one of the few countries where innovation in technology and digital connectivity has been and continues to be led by the public sector. The success of UPI, a common platform that serves as the backbone for diverse developments, has prompted government to task itself with another innovative attempt towards democratising digital commerce through the ONDC which could potentially transform how businesses and consumers interact at present. Empowering the end-users with control over their data is an essential ongoing task that is guided by the Account Aggregator framework.
As the developments would indicate, the world has moved seamlessly from the focus on physical infrastructure to investing in digital infrastructure. Moving forward, it is almost a certainty that most of the future real-world applications are going to marry the two, something akin to that attempted under Smart Cities, that interlocks area-based development with digital assets and digital services.
In the context of unique challenges, which only a country with a billion people can face, India’s infrastructure journey has been global in outlook, but domestic in innovation and implementation.
Introduction
12.1 As India completes 75 years of Independence, the nation is evolving into a prominent force in the global economic order. India is the world’s fifth largest economy and the prospect of steady progress in the coming years is bright. Here, the critical role played by infrastructure in economic growth cannot be overemphasised. Investing in high-quality infrastructure1 is crucial for accelerating economic growth and sustaining it in the long run. As the empirical evidence states, this has a salutary effect on the productivity and efficiency of Indian manufacturing firms2. It further plays a significant role in poverty reduction3 and promotes both rural and agricultural development4,5. Empirical evidence also points to the positive effect of infrastructure towards bringing overall economic growth in India6.
Figure XII.1: Quantity and quality of infrastructure and level of economic development across countries are strongly correlated
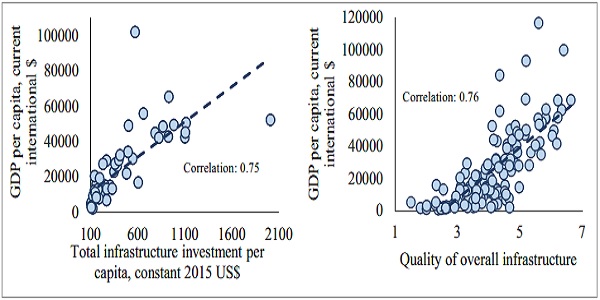
Note: The left graph pertains to 2019, and the right graph pertains to 2018.
Quality of overall infrastructure: 1=worst and 7=best.
Source: World Bank, Global Infrastructure Hub, and World Economic Forum Global Competitiveness Index
12.2 The above correlation between infrastructure and development brings us to the present scenario when during the times of pandemic and geo-political crisis, the government kept its focus on reforms in areas of physical, digital and regulatory infrastructure. In order to increase the private sector participation in creation of new infrastructure and development of existing ones, the government took initiatives like Public-Private Partnership (PPP), National Infrastructure Pipeline (NIP) and National Monetisation Pipeline (NMP). In addition to this, as part of the structural reforms with the objective to enhance efficiencies and cost competitiveness, Gati Shakti and National Logistics Policy (NLP) were also launched. This buffet of reforms on all aspects related to infrastructure investment and project execution not just ensures economic growth and economic efficiency but also generates confidence among various stakeholders in the economy towards government functioning.
12.3 Building upon it, the government has also kept its focus towards developing the traditional infrastructure like roads, railways, airports, ports, mass transport and waterways. These play a vital role in national integration and regional development. The mechanisms like multi-modal transport system have also been put in place. The multi-modal connectivity will provide integrated and seamless connectivity for movement of people and goods from one mode of transport to another. It will facilitate the last mile connectivity and also reduce travel time for people, further reducing the logistics cost and promoting export competitiveness. These measures collectively can bring out the untapped potential of underutilised modes of infrastructure.
12.4 With increasing financialisation of the economy and penetration of digital services, growth in physical infrastructure alone could not be the answer for development. Though India’s digital journey predates the pandemic, it would be rational to say that the testing times of the pandemic have accelerated its acceptance, application and coverage in many ways. The adaptability displayed by the citizens towards technology-driven changes was very encouraging. This confluence of digitisation and innovation acted as a game changer for India.
12.5 Reflecting on the journey of digital infrastructure growth and its global adoption, it is pertinent to mention that in 2009, only 17 per cent of adults in India had bank accounts, 15 per cent used digital payments, 1 in 25 had a unique ID document, and about 37 per cent had mobile phones. Today, these numbers have seen a meteoric rise — tele density has reached up to 93 per cent, over a billion people have a digital ID document, more than 80 per cent have bank accounts, and as of 2022, over 600 crore of digital payment transactions are completed per month. A Bank for International Settlements (BIS) working paper7 has estimated that progress towards financial inclusion, which would have taken almost half a century had India followed traditional growth processes, was achieved in India in just about ten years.
12.6 Today, India is able to offer many best practices, particularly with respect to its digital infrastructure innovations, that can be emulated globally. Successful vaccination drive through the one-stop Co-WIN portal, DigiLocker, Open Network for Digital Commerce (ONDC), Open Credit Enablement Network (OCEN), Goods and Services Tax (GST) Sahay are a few success stories among many. The National Payments Corporation of India International (NPCIL) led Unified Payment Interface (UPI) is another such innovation which transformed the payment landscape. UPI based transactions grew both in value and volume terms, paving the way for its international adoption.
12.7 Capitalising on the digital infrastructure support, India has also emerged as one of the world’s most vibrant destinations for start-up ecosystems. Start-ups are being envisioned as the spine of new India, as they encourage the youth to become job creators rather than job seekers. With the highest FinTech adoption rate of 87 per cent among the public compared to the global average of 64 per cent, India has gained the 3rd place in digital payments8 only after US and China, signifying that India has an untapped market. These untapped opportunities, along with the favourable ecosystem, creates a large growth potential for FinTechs in India. Taking this vision forward, under the government’s policy initiative, a world-class FinTech Hub at Gujarat International Finance Tec-City (GIFT) International Financial Services Centre (IFSC) has been developed.
12.8 This is just an illustration of the opportunities that exist. The massive wave of digitisation, increased penetration of smartphones, and adoption of technology have opened the doors for both traditional and new-age sectors. The rollout of 5G services can unleash new economic opportunities and help the country leapfrog the traditional barriers to development, spur innovations by start-ups and business enterprises, and advance the ‘Digital India’ vision. The journey is far from complete, and a lot remains to be accomplished to realise our true potential.
12.9 To summarise, this chapter covers the recent and past experiences of the government in transforming and inter-locking the potential of physical, regulatory and digital infrastructure. In doing so, the chapter looks to answer the following: How have the various infrastructural sectors fared after the Covid-19 shock? How has the government leveraged digital technologies in the service of the public? How far has the government been able to determine the role of co-ordination and efficiency in infrastructure projects and what is the government’s vision towards infrastructure development? In doing so, we will cover the government’s plans to place India among the top three global economies and inch closer to the status of a developed nation by the 100th year of its Independence.
Government’s Vision and Approaches to Infrastructure Development in India
12.10 Increase in infrastructure investment provides a critical push to the potential growth of the economy. The government, in recent years, provided an increased impetus for infrastructure development and investment through the enhancement of capital expenditure. This push has happened at a time of crisis when the capital expenditure by the private sector has been subdued. The outlay (target) for capital expenditure in 2022-23 (BE) was increased sharply by 35.4 per cent from ₹ 5.5 lakh crore in the previous year (2021-22) to ₹ 7.5 lakh crore, of which approximately 67 per cent has been spent from April to December 2022.
Figure XII.2: Central Government has sharply increased Capital
Expenditure in the last two consecutive years*
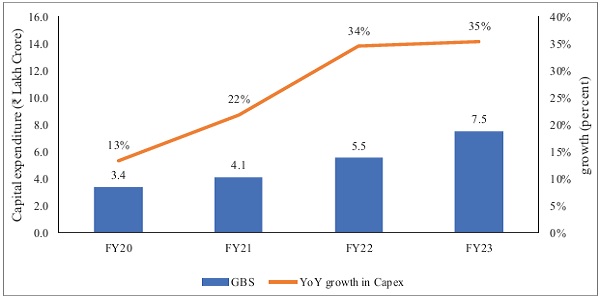
* All figures are representative of Budgeted Estimates for the respective Financial Year Source: Union Budget of India
12.11 The result of the efforts is visible in Ministries’/ Departments’ Capex spending till December 2022, which has been ₹5 lakh crore (around 67 per cent has been achieved against the Budgeted Capex of 7.5 lakh crore) as against ₹3.9 lakh crore for the same period in FY22 (i.e., till December 2021). The actual expenditure in FY23 is also 28 per cent higher than the expenditure in FY22 for the corresponding period.
12.12 The steady increase in public capital expenditure has helped support economic growth while laying the foundation for future growth as capital assets boost economic efficiency and potential growth. It could also crowd in private investment, as the IMF observed in the case of India9. This is evident from the fact that capacity utilisation in the private sector has been recovering.
12.13 While the NIP and the NMP would provide the much-needed impetus for stepping up infrastructure investment, the NLP will address the gaps in services, digital infrastructure and skills in the logistics workforce. PM GatiShakti, with a multimodal approach, is designed to fill the gaps in physical infrastructure and to integrate existing and proposed infrastructure development initiatives of different agencies. As physical infrastructure requires continuous support over its long gestation period, the government has also set up National Bank for Financing Infrastructure and Development (NaBFID) as development financial institution to set in motion a virtuous investment cycle. An institutional mechanism to fast-track investments has been put in place, in the form of Project Development Cells (PDCs) in all concerned Ministries/ Departments of Government of India.
12.14 The government’s vision for infrastructure does not stop here. As India has already submitted its Long-Term Low Emission Development Strategy at COP27, the next leap would be towards advanced infrastructure, which is more energy efficient, incorporates the idea of a circular economy and transitions towards low carbon development. The amount of investment that may be needed for putting in place climate resilient and climate resistant infrastructure might be too vast to be provided for by either the public sector or the private sector alone. Both financing and the creation of such infrastructure are likely to require Public-Private Partnership, a topic to which we turn next.
Public-Private Partnerships (PPPs)
12.15 Private investment in infrastructure is mainly in the form ofPPPs. PPPs are vital instruments for governments in channelling the strength of private sector in critical areas of infrastructure. It helps to address infrastructure gap and improve efficiency in infrastructure service delivery. The very success of PPPs lies in the robustness of institutional structure, financial support, and use and availability of standardised documents, such as Model Request for Qualification (RFQ), Model Request for Proposal (RFP) and Model Concession Agreements (MCAs).
12.16 In India, private participation in infrastructure programmes supports several PPP models, including management contracts like Build-Operate-Transfer (BOT), Design-Build-Finance-Operate-Transfer (DBFOT), Rehabilitate-Operate-Transfer (ROT), Hybrid Annuity Model (HAM), and Toll-Operate-Transfer (TOT) model. Under the BOT model, there are two variants – BOT (Toll) and BOT (Annuity) depending on who bears the traffic risk. In the case of BOT (Toll), the traffic risk is borne by the PPP concessionaire, while in the case of BOT (Annuity), it is borne by the public authority.
12.17 The Public Private Partnership Appraisal Committee (PPPAC), the apex body for appraisal of PPP projects in the Central Sector has streamlined appraisal mechanism to ensure speedy appraisal of projects, eliminate delays, adopt international best practices and have uniformity in appraisal mechanism and guidelines. The PPPAC is chaired by Secretary, Department of Economic Affairs (DEA) with Secretaries of Department of Expenditure, Department of Legal Affairs, the Sponsoring Ministry/Department and CEO, NITI Aayog as members to consider and appraise the proposals for Central Sector PPP Projects. The Public Private Partnership Appraisal Committee has cleared 79 projects with a total project cost of ₹2,27,268.1 crore from FY15 to FY23.
12.18 To provide financial assistance to financially unviable but socially/ economically desirable PPP projects, DEA launched the Viability Gap Funding (VGF) scheme in 2006. Under this scheme, economic sector projects may get up to 40 per cent of Capex as VGF grant. The Scheme includes higher provisions of VGF grant for social sectors. Social sectors may get up to 80 per cent of the Capex and up to 50 per cent of the Operating Expenditure (Opex) for five years after Commercial Operation Date (CoD) as VGF grant.
12.19 Social Sector projects get VGF under two categories: Sub Scheme-1 and Sub-Scheme-2. Sub-Scheme-1 caters to social sectors such as wastewater treatment, water supply, solid waste management etc. The projects under this category should have at least 100 per cent Operational Cost recovery. The Government of India (GoI) will provide a maximum of 30 per cent of Capex and the State Government concerned may provide an additional support of up to 30 per cent of Capex. Sub-scheme 2 supports demonstration/pilot projects from Health & Education sectors. The projects eligible under this category should have at least 50 per cent Operational Cost recovery. The GoI will provide a maximum of 40 per cent of the Capex of the project and a maximum of 25 per cent of the Opex of the project for the first five years of commercial operations as VGF.
12.20 From 2014-15 to 2022-23, under the VGF Scheme, 56 projects with TPC of ₹57870.1 crore were granted In-Principle Approval and 27 projects with TPC of ₹25263.8 crore were granted final approval with a Total Viability Gap Funding approval of ₹5813.6 crore (Both GoI & State Share). The GoI share of approved VGF is ₹3102.6 crore and the State Share of Total VGF approved is ₹2710.9 crore. The total VGF amount disbursed by DEA under the scheme from FY15 to FY23 is ₹2982.4 crore.
12.21 A scheme for financial support for project development expenses of PPP Projects – the ‘India Infrastructure Project Development Fund Scheme’ (IIPDF) – was notified by the government on 3 November 2022. The aim of the scheme is to develop quality PPP projects by providing necessary funding support to the project-sponsoring authorities, both in the Central and State Governments, for creating a shelf of bankable, viable PPP projects by on-boarding transaction advisers.
12.22 IIPDF Scheme has a total outlay of ₹150 crore for a period of 3 years from FY23 to FY25. Under the scheme, a maximum amount of ₹5 crore for a single proposal, inclusive of any tax implications, can be funded, which can include the cost of consultants/transaction advisers of a PPP project. Any funding requirement over and above ₹5 crore may be borne by the project sponsoring authority itself, and funding under IIPDF shall not be recovered.
National Infrastructure Pipeline (NIP)
12.23 A developing economy such as ours requires a continued stepping up of infrastructure investment to sustain a high rate of growth, which in turn is a pre-requisite for achieving wide-ranging social objectives. In view of this, the government launched the National Infrastructure Pipeline (NIP) with a forward-looking approach and with a projected infrastructure investment of around ₹111 lakh crore during FY20-25 to provide high quality infrastructure across the country. It also envisages improving project preparation and attracting domestic and foreign investment in infrastructure. The NIP includes infrastructure projects of more than ₹100 crore covering greenfield and brownfield investments. The NIP currently has 8,964 projects with a total investment of more than ₹108 lakh crore under different stages of implementation. Regarding sectoral composition, the transport sector constituted more than half of the projects.
Figure XII.3: Status of Projects under NIP
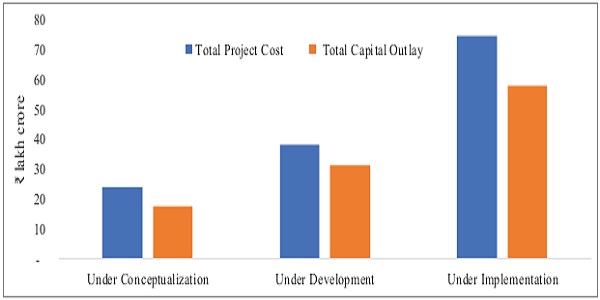
Source: Department of Economic Affairs.
Note: Data as of 13 January 2023
Figure XII.4: Transportation sector dominates the NIP

Source: Department of Economic Affairs.
Note: Data as of 13 January 2023
12.24 NIP is hosted on the Invest India Grid (IIG) platform and provides opportunities for States/UTs and Ministries to collate all major infrastructure projects at a single location. IIG thus acts as a centralised portal to track and review project progress across all economic and social infrastructure sub-sectors. The portal also enables project-sponsoring authorities to showcase investment opportunities to national and international investors. Project Monitoring Group (PMG) is an institutional mechanism put in place by the government for resolution of issues related to large-scale projects. PMG is also involved in the fast-tracking of approvals/clearances for projects with an anticipated investment of ₹500 crore and above. Now, it has been proposed to integrate NIP and PMG portals. When implemented, NIP will become the first entry point (database) for all infrastructure projects (costing ₹100 crore or more). PMG portal will pick up data, as per requirements (project cost of ₹500 crore or more), from the NIP database. This will save substantial time and effort by Ministries and States/UTs and ease the monitoring of large infrastructure projects.
National Monetisation Pipeline – Creation through monetisation
12.25 The need for scaling up infrastructure investment despite fiscal pressures from Covid-19 pandemic required unlocking of capital from various projects across sectors. The National Monetisation Pipeline (NMP), was thus announced on 23 August 2021. Based on the principle of ‘asset creation through monetisation’, it taps private sector investment for new infrastructure creation.
12.26 It is expected that private players would operate and maintain the assets. The NMP provides an opportunity for deleveraging balance sheets and providing fiscal space for investment in new infrastructure assets. The estimated aggregate monetisation potential under NMP is ₹6.0 lakh crore through core assets of the Central Government, over a four-year period, from FY20-25.
12.27 The process of monetisation entails a limited period license/ lease of an asset, owned by the government or a public authority, to a private sector entity for upfront or periodic consideration. Funds so received by the public authority are reinvested in new infrastructure or deployed for other public purposes. Such contracts include provisions for the transfer of assets back to the authority at the end of the contract period. It includes a selection of de-risked and brownfield assets with a stable revenue generation profile (or long-term revenue rights) that can be clearly ring-fenced. It contains 20+ asset classes across 12+ line ministries/ departments. In addition, the top 5 sectors (by estimated value) capture around 83 per cent of the aggregate pipeline value: roads (27 per cent) followed by railways (25 per cent), power (15 per cent), oil & gas pipelines (8 per cent), and telecom (6 per cent). Roads and railways together contribute around 52 per cent of the total NMP value.
12.28 Against the monetisation target of ₹0.9 lakh crore in FY22, ₹0.97 lakh crore have been achieved during the period under roads, power, coal and mines. The cumulative investment potential over the years of transactions completed is estimated at ₹9.0 lakh crore (value captured in the form of accruals, receipts, and/or private investment). NMP’s 2nd year, i.e., FY23, target envisaged is ₹1.6 lakh crore (27 per cent of overall NMP Target) under Core-Asset Monetisation. This is an indicative value while the actual realization for public assets may differ depending on the timing, transaction structuring, investor interest, etc.
National Logistics Policy: Reducing the cost of logistics
12.29 Given that India aims to increase its exports manifold, it is important that the logistics aspects, that will facilitate this goal, be addressed. Logistics costs in India have been in the range of 14-18 per cent of GDP against the global benchmark of 8 per cent. Key dimensions to be addressed to improve logistics for trade include: ensuring efficiency of the clearance process (i.e., speed, simplicity, and predictability of formalities) by border control agencies, including customs; improving the quality of trade and transport-related infrastructure (e.g., ports, railroads, roads, information technology); easing of arranging competitively priced shipments; enhancing the competence and quality of logistics services (e.g., transport operators, customs brokers); providing for tracking and tracing of consignments and ensuring timeliness of shipments in reaching destinations within the scheduled or expected delivery time. These aspects have been captured by the World Bank in the form of a Logistics Performance Index (LPI).
12.30 Many efforts have already been made by the Government of India to improve the logistics ecosystem through ‘infrastructure initiatives’ such as Ude Desh ka Aam Nagrik (UDAN), Bharatmala, Sagarmala, Parvatamala, National Rail Plan, and through ‘process reforms’ GST, e-Sanchit, Single Window Interface for Trade (SWIFT), Indian Customs Electronic Data Interchange Gateway (ICEGATE), Turant Customs, and others.
12.31 However, a need was felt to integrate all these efforts by different government agencies and lay an overarching interdisciplinary, cross-sectoral, and multi-jurisdictional framework for the logistics sector. To realise this idea, NLP was launched on 17 September 2022, addressing the components of improving efficiency in logistics through streamlining processes, regulatory framework, skill development, and mainstreaming logistics among others.
12.32 The vision of the NLP is “to develop a technologically enabled, integrated, cost-efficient, resilient, sustainable and trusted logistics ecosystem in the country for accelerated and inclusive growth.” The policy is an endeavour to improve the competitiveness of Indian goods, enhance economic growth and increase employment opportunities. It is aimed at bringing global standards to warehousing, multimodal digital integration, ease of logistics services, human resources, and skill enhancement.
12.33 The targets for achieving the vision of the NLP are to (i) reduce the cost of logistics in India to be comparable to global benchmarks by 2030; (ii) improve the Logistics Performance Index ranking – endeavour is to be among the top 25 countries by 2030, and (iii) create a data-driven decision support mechanism for an efficient logistics ecosystem.
12.34 The Policy will be implemented through a Comprehensive Logistics Action Plan (CLAP). The interventions under the CLAP are divided into specific key action areas, including Integrated Digital Logistics Systems, standardisation of physical assets & benchmarking service quality standards, Logistics Human Resources Development and Capacity Building, State Engagement, EXIM (Export-Import) Logistics, Service Improvement framework, Sectoral Plan for Efficient Logistics and Facilitation of Development of Logistics Parks.
12.35 Among other steps taken to enhance logistics performance in the country, there has been an initiative to undertake a sub-national view of the state of logistics in the country through the Logistics Ease Across Different States (LEADS) index. The following Box provides some details of this initiative.
Box Xii.1: Logistics Ease Across Different States
The Government undertook a survey-based assessment of logistics ease in various States and UTs in the form of the LEADS index in 2018 to gauge their logistics ecosystem. It was followed by surveys in 2019, 2021, and 202210. Each of these surveys has been aimed at analysing the business environment at the State level relating to the logistics infrastructure, policy framework, and regulatory regime, across States and UTs.
It is based on a stakeholders’ survey and uses the World Bank’s Logistics Performance Index (LPI) methodology. The State LPI is arrived at using a ranking methodology for stakeholder engagement based on a series of meetings and online surveys in the key areas of logistics- infrastructure, services timelines, traceability, competitiveness, security, operating environments, and efficiency of regulation. Following the LEADS initiative, 13 States/UTs have prepared and notified their logistic policies.
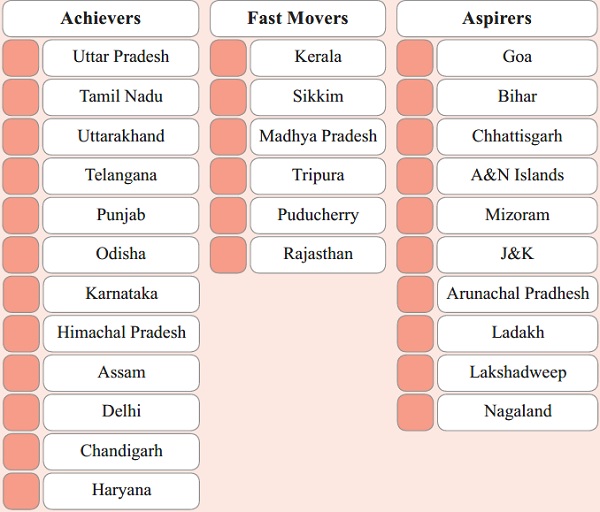
The LEADS 2022 survey report was released on 13 October 2022, which considered the PM GatiShakti NMP and current developments in the logistics sector in the wake of the COVID-19 pandemic. The survey has garnered more than 6500 responses from more than 2100 respondents across the country. Unlike the previous versions of LEADS which were based on ranking systems for all states, LEADS 2022 has adopted a classification-based grading, and States have been now classified under four categories viz., coastal States, hinterland/ landlocked States, North-Eastern States, and UTs for the assessment of how well a State or UT has performed in comparison to the top State/UT within the specific cluster.
Taking a break from the past, states have not been ranked in order. This time, they have been allotted three performance categories, namely, Achievers: States/UTs achieving a percentage score of 90 per cent or more, Fast Movers: States/UTs achieving percentage scores between 80 to 90 per cent, and Aspirers: States/UTs achieving percentage scores below 80 per cent. The results are indicated below.
PM GatiShakti: A master plan for integrated project planning
12.36 The growth experience of advanced economies has highlighted the importance of having a multimodal transport network approach. Introducing the holistic planning in the case of infrastructure projects, the government launched PM GatiShakti, charting a transformative approach to infrastructure development. The PM GatiShakti National Master Plan entails creation of a common umbrella platform with all infrastructure projects pertaining to various ministries/ departments incorporated within a comprehensive database for efficient planning and implementation on a real-time basis. The projects pertaining to seven engines (roads, railways, airports, ports, mass transport, waterways, and logistic infrastructure) in the NIP will be aligned with PM GatiShakti framework. The touchstone of the Master Plan will be high quality modern infrastructure and logistics synergy among different modes of movement – both of people and of goods – and location of projects. This will help raise productivity, and accelerate economic growth and development.
12.37 The focus is on integrated planning and synchronised implementation across ministries/ departments, with innovative use of technology. The aim is to improve multimodal connectivity and logistics efficiency while addressing the critical gaps for the seamless movement of people and goods, with a focus on minimising disruptions and timely completion of infrastructure projects.
12.38 In order to facilitate integrated planning and coordinated implementation, a GIS-based and data-driven decision support platform called PM GatiShakti National Master Plan has been introduced. Around 1950 data layers of 22 ministries/departments and 36 States/UTs were mapped up to the village, district, and taluka levels on the national master plan. It can be integrated with various applications of different ministries/agencies to prevent duplication of work and create a single window system for infrastructure planning. Data layers on important assets pertaining to health, education, culture, tourism, gram panchayats, municipal corporation, social welfare housing etc. are being mapped and data validation is being done for optimum use of PM GatiShakti principles in planning of both physical and social infrastructures. Use cases of GatiShakti National Master Plan include connectivity to model schools and disaster management planning etc.
Developments in Physical Infrastructure Sectors
Road Transport: Increased budgetary support by the government augmented road connectivity
12.39 Road infrastructure in the form of a network of national highways, state highways, district roads, rural roads, and urban roads acts as a major mode of transportation and connectivity for the country’s diverse population of consumers and businesses. Roads supplement the other modes of transport through last-mile connectivity to the far-flung regions of the country.
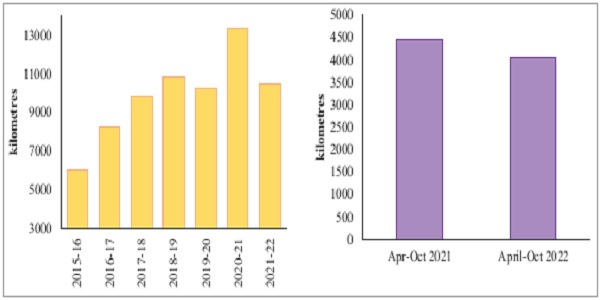
12.40 There has been an increase in the construction of National Highways (NHs)/roads over time, with 10,457 km of roads constructed in FY22 as compared to 6,061 km in FY16. In FY23 (until October 2022), 4,060 km of NHs/roads were constructed, which was around 91 per cent of the achievement in the corresponding period of the previous financial year. Total budgetary support for investment in the sector has been increasing rapidly in the last four years and stood at around ₹1.4 lakh crore during FY23 (as of 31 October 2022).
12.41 In line with the vision of monetisation of public sector assets, National Highways Authority of India (NHAI) launched its InvIT in FY22 not only to facilitate monetisation of roads but also to attract foreign and domestic institutional investors to invest in the roads sector. So far, NHAI InvIT has raised more than ₹10,200 crore from high quality foreign and Indian institutional investors (up to December 2022).
Figure Xii.5: National Highways/Road construction has increased
since 2015-16, hitting unprecedented levels in 2020-21
Source: Ministry of Road Transport and Highways
Figure Xii.6: Tremendous increase in total budgetary support for investment in the road sector
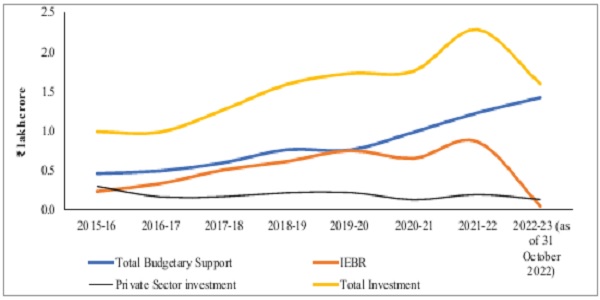
Source: Ministry of Road Transport and Highways
Railways: Expansion and modernisation, a continuous process
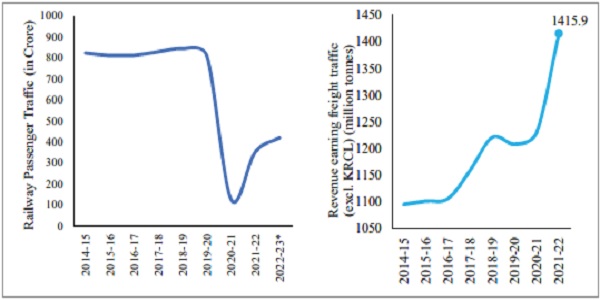
12.42 A major transport infrastructure, that can very well be called India’s lifeline, and which had a huge role to play in national integration and regional development, is the railways. The Indian Railways (IR), with over 68,031 route kms, is the fourth largest network in the world under single management. Passenger traffic originating in IR was 809 crore during pre-Covid-19 period (2019-20), but dipped to 125 crore in 2020-21. It has since recovered to 351.9 crore in 2021-22. During the current financial year, passenger traffic has seen further strong growth with the number of originating passengers already hitting 418.4 crore (up to November 2022). Enhanced mobility across the country and demand for faster and competitive trains will assist the growth in passenger traffic in the coming years.
12.43 In the case of revenue-earning, freight traffic was sustained by IR despite the Covid-19 shock. Between FY20-21 and FY21-22, there was a sharp increase in the freight traffic, reflecting the strong revival in the economic activity in the domestic economy. During FY22-23 (up to November 2022), Indian Railways (IR) carried 976.8 million tonnes of revenue-earning freight traffic (excluding KRCL11), as against 901.7 million tonnes during the corresponding period in FY21-22 (excluding KRCL), which translated into an increase of 8.3 per cent.
Figure XII.7: Railways passenger as well as freight traffic have seen strong growth post Covid-19 period
Note: * For FY23 the data is from April-November, 2022
Source: Ministry of Railways
12.44 The capital expenditure (Capex) on infrastructure in railways has received tremendous boost since 2014. It has seen a continuous increase in the last four years with Capex (B.E.) of ₹2.5 lakh crore in FY23, up by around 29 per cent compared to the previous year. During the current financial year (till 12 December 2022), IR has already completed 2022 Track Kilometres (TKM) which includes 109 TKM of New Line, 102 TKM of Gauge Conversion and 1811 TKM of multi-tracking projects. To understand the pace of progress, it may be noted that during last financial year this figure was reached only during the first week of March. From FY2014-22, across IR, 20,628 km sections (3,970 km New Line, 5,507 km Gauge Conversion and 11,151 km doubling) have been commissioned at an average of 2,579 km/year, which is 70 per cent more than the average commissioning during 2009-14 (1,520 km/year). Further, during the last eight years (2014-22), 30,446 Route Kilometres (RKM) have been electrified compared to an electrification of 4,698 RKM during the previous eight-year period, a more than six-fold increase.
Table XII.1: Infrastructure Capital Expenditure on Railways has seen a tremendous boost
|
Description |
Average during 2009-14 | Average during 2014-19 | 2019-0 | 2020-1 | 2021-2 | 2022-3(BE) |
| (₹ crore) | ||||||
| NL, GC & Doubling | 10,623 | 40,389 | 52,446 | 43,597 | 66,690 | 78,576 |
| Rolling stock | 16,029 | 20,878 | 37,339 | 32,627 | 41,406 | 39,853 |
| Railway Electrification | 884 | 3,258 | 7,145 | 6,148 | 6,961 | 7,700 |
| Track renewals | 4,958 | 7,186 | 9,391 | 13,523 | 14,082 | 13,335 |
| ROB/RUB | 916 | 3,178 | 3,522 | 4,139 | 4,222 | 8,750 |
| Bridge Works | 351 | 488 | 782 | 772 | 1,297 | 940 |
| Other Plan Heads | 12,219 | 23,801 | 37,440 | 54,375 | 55,609 | 96,646 |
| Total Capex | 45,980 | 99,178 | 1,48,064 | 1,55,181 | 1,90,267 | 2,45,800 |
Source: Ministry of Railways
Note: NL: New lines, GC: Gauge Conversion
12.45 The fast pace of infrastructure augmentation by IR has been a result of substantial increase in allocation of funds and various steps being taken by the government. This includes delegation of powers at the field level which has helped in commissioning of doubling projects, close monitoring of the progress of projects at various levels, regular follow-up with State Governments and relevant authorities for expeditious land acquisition, forestry and wildlife clearances and resolving other issues pertaining to the projects.
Box XII.2: Major initiatives of the Indian Railways
√ Mumbai-Ahmedabad High Speed Rail (MAHSR) Project: The MAHSR project, which was sanctioned by the government in 2015, with technical and financial cooperation from Government of Japan, is under execution and survey & design aspects of it have been finalised.
√ Dedicated Freight Corridor (DFC) Project: One of the most ambitious and biggest ever infrastructure project in the railways, which comprises construction of two dedicated freight corridors, i.e., Eastern and Western DFCs along the golden quadrilateral, will offer higher transport output in the country with reduced transit time and cost.
√ GatiShakti Multi-Modal Cargo Terminal (GCT): GCTs are being developed by private players on non-railway land as well as fully/ partially on railway land, based on demand from industry and potential of cargo traffic. 21 GCTs have been commissioned and more than 90 more locations have been provisionally identified for development of GCTs (as of 31 October 2022). This will boost investment from industry in the development of additional terminals for handling rail cargos.
√ Induction of semi-high-speed Vande Bharat Trainsets: Semi High-Speed Self-Propelled Vande Bharat Trainsets were manufactured by Integral Coach Factory, Chennai, with indigenous efforts. These trains have ultra-modern features like quick acceleration, substantial reduction in travel time, having maximum speed of 160 kmph, on-board infotainment and Global Positioning System (GPS) based passenger information system, etc.
√ Electrical/Electronic Interlocking System: envisages centralized operation of points and signals to enhance safety in train operations. These systems have been provided at 6,322 stations covering 99 per cent stations of Indian Railways (as of 30 September 2022).
√ Development ofHyperloop technology: Hyperloop is an emerging transportation technology that can be faster and greener than airplanes and railways. In this system, vehicles run in the levitating state (with the help of Linear Induction Motors/Electromagnets) and in vacuum environment. The technology is still in the development phase. Indian Railways intends to develop a demonstrative project on Hyperloop Technology. Indian Railways has collaborated with IIT Madras for developing Hyperloop Technology by setting up Centre of Excellence for Hyperloop Technology at IIT Madras at the cost of ₹8.34 crore.
√ Kisan Rail trains were introduced in FY21 to enable speedy movement of perishables from production or surplus regions to consumption or deficient regions. Up to 31 October 2022, Indian Railways have operated 2,359 Kisan Rail services, transporting approximately 7.91 lakh tonnes of perishables including fruits and vegetables.
Civil Aviation: Revival backed by domestic demand
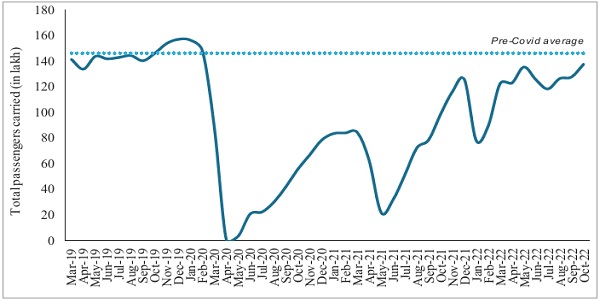
12.46 With the containment of Covid-19 infections and the lifting of travel restrictions worldwide, air travel has rebounded. While in FY21, there was a considerable decline in the air-traffic (a decline of 54 per cent) as well as passenger traffic handled (a decline of 66 per cent), FY22 saw a recovery, mainly led by the domestic sector. The current financial year has further shown a rebound, with both passenger and cargo movement close to the pre-Covid-19 levels. The total number of passengers carried in December 2022 stood at 150.1 lakh, which was 106.4 per cent of the pre-Covid level (average for 11 months from April 2019 to February 2020). During November 2022, total air cargo tonnage stood at 2.5 lakh MT, which is 89 per cent of the pre-Covid levels.
Figure XII.8: Performance of the Indian aviation sector
Source: Ministry of Civil Aviation
12.47 The civil aviation sector in India has great potential owing to growing demand from the middle class, growth in population and tourism, higher disposable incomes, favourable demographics, and greater penetration of aviation infrastructure. This is further supported by the government through schemes such as UDAN, which has considerably enhanced regional connectivity through the opening of airports in India’s hinterland. Under this scheme, the government has approved a budget of ₹4500 crore for revival of existing unserved/ underserved airports/airstrips of the State governments, Airports Authority of India (AAI), public sector undertakings and civil enclaves. The government has also accorded ‘in-principle’ approval for the setting up of 21 greenfield airports across the country. More than one crore air passengers have availed themselves of the benefit of the UDAN scheme since its inception. The scheme focuses on the connectivity between the Tier-2 and 3 cities in the country and the number of beneficiaries will increase manifold as the connectivity improves between unserved and underserved airports.
Ports: Handling higher capacity with governance reforms
12.48 For ages, the sea has been the source of opportunity and seashores have acted as the gateways to prosperity for India. The development of ports is crucial for the economy, given that most of the international trade is handled through ports (around 90 per cent of international trade cargo by volume and 79.9 per cent by value). The capacity of major ports, which was 871.5 Million Tonnes Per Annum (MTPA) at the end of March 2014, has increased to 1534.9 MTPA by the end of March 2022. Cumulatively they handled 720.1 MT traffic during FY22.
12.49 To meet the ever-increasing trade requirements, the expansion of port capacity has been accorded the highest priority by the government through the implementation of well-conceived infrastructure development projects. To further enhance their efficiency, the government is focusing on improving port governance, addressing low-capacity utilisation, modernising berths with techno efficient loading/unloading equipment, and creating new channels for port connectivity. For streamlining the port compliances and for reducing the Turn Around Time for (TAT) for vessels, long strides have been taken at the major ports towards the digitisation of key EXIM processes. The Port Community System (PCS 1x) has digitised processes such as Electronic Invoice (e-Invoice), Electronic Payment (e-Payment) and Electronic Delivery Order (e-DO) for the physical release of cargo by custodians, in addition to the processes of generating electronic Bill of Lading (e-BL) and Letter of Credit (LC). Further, the Radio Frequency Identification Device (RFID) solution has been implemented at all major ports to enable seamless movement of traffic across port gates, including substantial reductions in documentation checks. Additionally, the process to bootstrap PCS 1x into National Logistics Portal-Marine (NLP-Marine) is already under way which will act as a Unified Digital Platform for all maritime stakeholders.
Inland Water Transport: Tapping the potential of navigable waterways
12.50 Inland water transport holds great untapped potential as a means for the transportation of goods and passengers. India has a large endowment of rivers, canals, and other waterways. The total navigable length of waterways in India is around 14,850 kilometres.
Figure XII.9: Navigable Length of Waterways in Different States
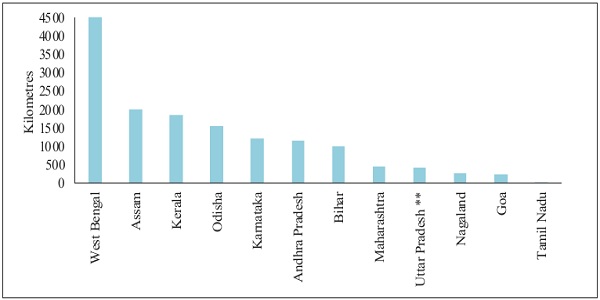
Source: Statistics of Inland Water Transport 2020-21, Ministry of Port, Shipping and Waterways Note: Data pertains to 2020-21. **Data for Uttar Pradesh pertains to 2016-17
12.51 Under the National Waterways Act 2016, 106 new waterways have been declared as National Waterways (NWs), taking the total number of NWs in the country to 111. Based on the outcome of techno-economic feasibility and Detailed Project Reports (DPRs), 26 NWs viable for cargo movement have been prioritised, out of which developmental activities have been initiated in the 14 most viable NWs. Further, to promote the use of inland waterways, waterway usage charges levied by the Inland Waterways Authority of India (IWAI) on vessels moving on NWs were waived in July 2020, initially for a period of three years. The cargo movement on National Waterways achieved an all-time high of 108.8 million tons during FY22, recording 30.1 per cent growth compared to the previous year.
12.52 The Inland Vessels Bill 2021, which replaced the over 100 year-old Inland Vessels Act, 1917 (Act No.1 of 1917), was passed by the Parliament in August 2021. This will usher in a new era for inland water transport sector and fulfil the vision to utilise the potential of multi-modal transport ecosystem while making the legislative framework user-friendly and promoting ease of doing business. The uniform application of rules and regulations will ensure seamless, quick, and cost-efficient trade and transportation by inland vessels using the inland waterways. Various sections of this Act as detailed in the box below have come into force in 2022.
Box XII.3: Inland Vessels Act 2021
√ The Inland Vessels Act of 1917, which had undergone several amendments, had provisions for the restrictive movement of mechanically propelled vessels and non-uniform standards and regulations across different states. The Inland Vessels Act 2021, which replaced the erstwhile Act, aims to bring uniformity in the application of the law relating to inland waterways and navigation within the country. Some salient features of the Act include:
√ State governments may declare by notification any inland water area as a “Zone” depending on the maximum significant wave height criteria as prescribed in the Act. Any mechanically propelled vessel would have to obtain a certificate, which would indicate the zone in which the vessel is to be operated.
√ A central database of inland vessels would be maintained by the government.
√ The standards for qualification, training, training institutes, examination, and grant of certificate of competency would be prescribed by the Central Government.
√ Standards for prevention of environmental pollution.
√ Constitution of a Development Fund by the State Government to be utilised for meeting emergency preparedness, containment of pollution, removal of unidentified wrecks or obstruction, boosting development works of inland water navigation, etc.
Overall, the new Act would lead to uniformity of rules across states ensuring unhindered and safe movement of vessels within and across states. This is likely to promote inland water transport as a potential mode for large-scale movement of cargo as well as passengers across the country owing to its relative cost effectiveness.
Electricity: Installed capacity growth driven by renewables
12.53 The total installed power capacity of utilities and captive power plants (industries having demand of 1 Mega Watt (MW) and above) was 482.2 GW on 31 March 2022 as compared to 460.7 GW on 31 March 2021, up by 4.7 per cent. Installed capacity in utilities was 399.5 GW on 31 March 2022 as against 382.1 GW a year back (higher by 4.5 per cent). Thermal sources of energy make up the largest (59.1 per cent) share of total installed capacity in utilities, followed by renewable energy resources with 27.5 per cent and hydro with 11.7 per cent.
Table XII.2: All India Installed Capacity Mode-Wise (GW)
| Hydro | Thermal | Nuclear | Renewables | Total | |
| 2020-21 | 46.3 | 307.4 | 6.8 | 100.1 | 460.7 |
| 2021-22@ | 46.9 | 312.2 | 6.8 | 116.4 | 482.2 |
| Growth (in per cent) |
1.1 | 1.6 | 0 | 16.2 | 4.7 |
Source: Ministry of Power.
Note: @ Estimated
12.54 The total electricity generated, including that from captive plants during the year FY22 was 17.2 lakh GWh as compared to 15.9 lakh GWh during the FY21, of which 14.8 lakh GWh was generated by utilities and 2.3 lakh GWh in captive plants. Between FY22 and FY21, the maximum rise in electricity generation was recorded in renewable energy resources for utilities and for captive plants. There has been a gradual transition in India’s energy sector from the conventional sources to the non-fossil fuel sources. India is steadfast in its commitments towards non-fossil fuel-based energy resources. India has put in place a target of achieving 50 per cent cumulative installed capacity for generating electric power from non-fossil fuel-based energy resources by 2030. India is well on its way to fulfilling its commitments with the share of renewables in overall installed capacity growing at a fast pace. This is a result of the various government initiatives aimed at supporting the renewable energy sector.
Table XII.3: All India Gross Electricity Generation Mode-Wise (GWh)
| Hydro | Thermal | Nuclear | Renewables | Total | |
| 2020-21 | 1.5 | 12.5 | 0.4 | 1.5 | 15.9 |
| 2021-22@ | 1.5 | 13.4 | 0.4 | 1.7 | 17.2 |
| Growth (in per cent) |
0.9 | 7.3 | 9.5 | 16.2 | 7.6 |
Source: Ministry of Power.
Note: @ Estimated
12.55 Government of India has been driving a vibrant renewable energy programme aimed at achieving energy security and energy access, and reducing the carbon footprints of the national economy. In order to reduce the carbon footprint of the farm sector, Pradhan Mantri Kisan Urja Suraksha evam Utthaan Mahabhiyan (PM-KUSUM) aims to provide energy and water security, de-dieselise the farm sector and generate additional income for farmers by producing solar power. In addition, the government has introduced the Solar Park Scheme to facilitate necessary infrastructure like land, power evacuation facilities, road connectivity, water facility, etc. along with all statutory clearances. As on 30 September 2022, the government has sanctioned the entire target capacity of 40 GW for the development of 59 Solar Parks in 16 states.
12.56 Indian Railways, which is a major user of electricity in the country, has announced its intention to achieve net zero carbon emission by 2030. In this regard, Indian Railways has reoriented its energy demand towards greater use of renewable sources. As of November 2022, plants generating about 143 MW of solar power (both on rooftops and on land) and about 103 MW of wind power have been commissioned.
12.57 Other important incentives for renewable power generation include Hydropower Purchase Obligation (HPO) within Non-Solar Renewable Purchase Obligation (RPO). With the government support, the private sector has actively participated in boosting the overall generation capacity and bringing down unit costs over a short period.
Developments in Digital Infrastructure
12.58 While the role of traditional infrastructure has been well recognised, in recent years, the role of digital infrastructure in socio-economic development of the country has assumed an increased importance. This was especially true during the Covid-19 period when the curtailment of physical interactions necessitated the utilisation of digital infrastructure already available for service delivery and remote work. In the coming years, the availability and spread of digital infrastructure will contribute significantly to economic growth. Recognising this, the government’s Digital India programme, which aims to transform India into a digitally empowered society and knowledge economy, envisions digital infrastructure as a core utility to every citizen. The focus areas include the availability of high-speed internet as a core utility for delivery of services to citizens, unique digital identity, enabling citizen participation in digital and financial space, shareable private space on a public cloud (citizens can digitally store their documents, certificates, etc. and share them with public agencies or others without the need to physically submit them), and a safe and secure cyber-space. Some developments in the digital infrastructure sphere are detailed below.
Telecommunications: Accelerating provision of affordable services
12.59 As a result of the persistent efforts made by the government towards promoting technological development, telecommunications services have penetrated the remotest corners of the nation. The country has come a long way from the days when a telephone connection was seen as a luxury to the present where a majority of people have a mobile connection. This was due to a cumulative effort of telecom players who widened their network bandwidth, government’s enabling environment and consumers’ outreach for smartphones. Today, the total telephone subscriber base in India stands at 117 crore (as of November 2022). While more than 97 per cent of the total subscribers are connected wirelessly (114.3 crore at the end of November 2022), 83.7 crore have internet connections as of June 2022. The overall tele-density in India stood at 84.8 per cent, with wide differences across states. It ranged from 55.4 per cent in Bihar to 270.6 per cent in Delhi. Eight license service areas, namely, Delhi, Mumbai, Kolkata, Himachal Pradesh, Kerala, Punjab, Tamil Nadu, and Karnataka had a tele-density of above 100 per cent.
Figure XII.10: Overall tele density, license service area wise
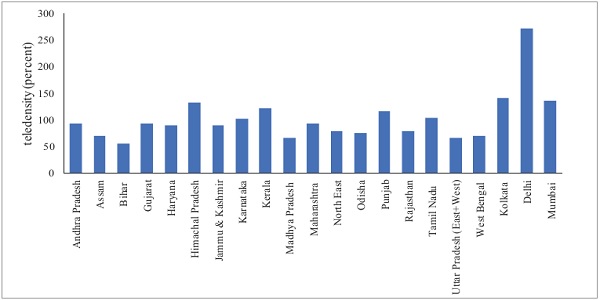
Source: Department of Telecommunications
12.60 Apart from the interstate disparity in tele-density, in rural areas the tele-density continues to be at much lower levels compared to urban areas. However, the catch-up by the rural areas is heartening as the YoY change in internet subscribers is greater in rural (for the majority of the states) than in urban areas. This provided a cushion to the rural economy during the initial phase of the Covid-19 as many people went back to rural India for their livelihood. The digital infrastructure created over the years ensured not just the continuous transmission of information but also added economic value when businesses went digital.
Box XII.4: Lessening the Rural-Urban Digital Divide
Converting the crisis into opportunity, India, through its resilient measures, has been able to contain the impact of the pandemic through structural reforms in several sectors, telecom being one of them. During the challenging times of Covid-19 pandemic, the telecommunication sector continued to provide seamless connectivity for the smooth functioning of critical activities and services such as ‘work from home’, ‘study from home’ etc. This was supported by the significant increase in affordable smartphones, which became more than a communication device. It emerged as the key enabler of Digital India initiative with various new services and applications like digital payments, e-governance, e-commerce, e-health, and e-education. Acting as the backbone, these services have boosted the overall economic growth of the country.
Before 2014, access to digital services was perceived as a prerogative of urban households.
This was substantiated by the then-existing digital divide seen from tele density (number of subscribers per 100 inhabitants) in rural and urban areas being 44.01 and 145.46 respectively in 2014. However, with the vision of developing digital infrastructure as a core utility for every citizen, Digital India as an umbrella programme was launched in 2015. Service delivery through digital tools has travelled a long way since then. We have added more internet subscribers in rural areas in the last 3 years (2019-21) than in their urban counterparts (95.76 million vis-a-vis 92.81 million in rural and urban areas respectively). This has been a result of dedicated digital drives across rural areas through ambitious government schemes, like the flagship BharatNet Project Scheme, Telecom Development Plan, Aspirational District Scheme, initiatives in North-Eastern Region through Comprehensive Telecom Development Plan (CTDP) and initiatives towards areas affected by Left Wing Extremism (LWE)etc.
Figure: ISA wise difference in rural growth (per cent) over Urban growth (per cent) in
Internet Subscribers
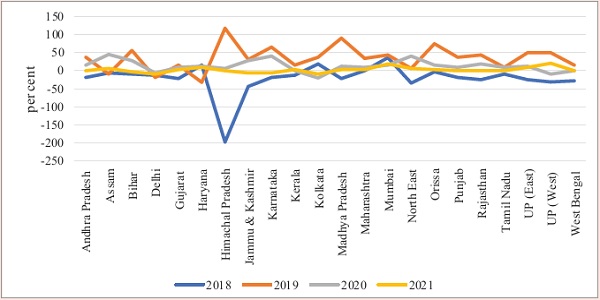
This concrete focus on bridging the gap between rural and urban internet penetration has borne positive results. The plot of the difference in the growth rates (per cent) of internet subscribers in rural over urban areas is somewhat volatile across states and years. The steep transition from a negative gap in 2018 for most LSAs to above 50 per cent in positive territory (for a majority of LSAs) in 2019 reflects the demand side growth in digital services, which was backed by the availability of budget smartphones and affordable data usage. The difference has been positive since then.
This significant growth in rural India was the major shock absorber during the COVID-19 pandemic when both businesses and consumer demand were impacted. When majority of the workforce reverse-migrated to rural areas in search of livelihoods, agriculture (3.4 per cent growth in FY20-21) as well as the world’s largest employment scheme MNREGA supported the domestic economy. The digital infrastructure created over the years in rural areas ensured transparent and timely payments to the beneficiaries directly into their account thus limiting their exposure to the virus. With affordability and accessibility to private education restricted, the digital support system in government schools absorbed the then much-needed enrolment to counter the learning gap. As schooling went online for a considerable period even post-pandemic, the increase in internet subscriptions in rural areas helped mitigate learning loss significantly. This even facilitated the successful rollout of mass vaccination in rural areas.
The 200 per cent increase in rural internet subscriptions between 2015 and 2021 vis-a-vis 158 per cent in urban areas, reflects the increased impetus the government is putting to bring rural and urban digital connectivity to the same level. For further widening the net, to include unconnected areas and populations, dedicated long-term efforts by the government have been taken. Government Schemes like Production Linked Incentive (PLI) for telecom and networking products will promote domestic mobile manufacturing as well as network installation. Continuous proliferation of measures such as Bharat Net Project shall continue to improve accessibility, affordability, connectivity, and inclusivity pan-India. This in turn will help in realizing the vision of our Hon’ble Prime Minister to digitally empower every Indian, as we march towards India’s ‘Techade’.
12.61 To further create digital linkages at the grassroots level and increase the consumer experience like the one in urban centres, a project for the saturation of 4G mobile services in uncovered villages across the country has been approved. The project will provide 4G mobile services in 24,680 uncovered villages in remote and difficult areas, and 6,279 villages having only 2G/3G connectivity shall be upgraded to 4G.
12.62 With a special focus on the states in the North-Eastern Region, the government is implementing a Comprehensive Telecom Development Plan (CTDP). Under CTDP for NER, mobile connectivity on 2G is to be provided by setting up 2004 towers in the uncovered villages and along National Highways of Assam, Manipur, Mizoram, Nagaland, Tripura, Sikkim, and Arunachal Pradesh (National Highways only). As of 25 October 2021, 1,358 towers have been installed and they are operational. In addition, other projects on providing 4G mobile coverage to uncovered villages in Meghalaya, Arunachal Pradesh and two districts of Assam (Karbi Anglong & Dima Hasao) are under way. Furthermore, to make available high-quality and highspeed internet access to the states of the North-Eastern Region of the country, Universal Service Obligation Fund (USOF) signed an Agreement with Bharat Sanchar Nigam Limited (BSNL) on 18 August 2021 for the hiring of 10 Gigabits per second (Gbps) International Bandwidth for Internet Connectivity to Agartala from Bangladesh Submarine Cable Company Limited (BSCCL), Bangladesh. The first 10 Gbps link was commissioned on 26 November 2021, and the second 10 Gbps link on 21 April 2022.
12.63 When telecom is spanning coastlines, forests, and even deserts why should islands be left behind? A comprehensive initiative to connect our islands to the mainland has been realised through the government’s initiative of the Comprehensive Telecom Development Plan for Islands. The Submarine OFC connectivity from Chennai to Andaman & Nicobar Islands (CANI) project was launched to connect Port Blair and seven other islands of Andaman & Nicobar Islands with Chennai through 2,313 km of underwater OFC. There has been an immense proliferation of bandwidth utilisation, almost 30 times, from 2.7Gbps to 75.7Gbps. The project has led to an FTTH speed of 100 Mbps, and up to 15 times more data volume is available now. The Submarine OFC connectivity from Kochi to Lakshadweep Islands (KLI) project was launched to connect Kochi with Kavaratti and ten other islands of Lakshadweep through 1869 kms of underwater OFC project, and the project is likely to be completed by May 2023. The project is currently under way and will ensure digital inclusion across the islands and is expected to trigger significant transformation across all sectors, including agriculture, tourism, health, and education.
12.64 A landmark achievement in telecommunications in India was the launch of 5G services. 5G could impact consumers directly through higher data transfer speeds and lower latency. 5G use cases developed by Telecom Service Providers and start-ups in education, health, worker safety, smart agriculture etc., are now being deployed across the country. Telecom reforms and clear policy direction led to the spectrum auction of 2022 garnering the highest-ever bids.
12.65 As a major reform measure, the Indian Telegraph Right of Way (Amendment) Rules, 2022, will facilitate faster and easier deployment of telegraph infrastructure to enable speedy 5G rollout. The government has brought in procedural reforms in Wireless Licensing, including delicensing of various frequency bands to promote innovation, manufacturing and export. The National Frequency Allocation Plan 2022 (NFAP) provides a broad regulatory framework, identifying which frequency bands are available for cellular mobile services, Wi-fi, sound and television broadcasting, radio navigation for aircraft and ships, and other wireless communications. NFAP will give guidance to the users of the spectrum to plan their networks in accordance with the relevant frequency and parameters provided therein. Given that spectrum is a scarce resource, NFAP is useful in aligning spectrum usage with demands from emerging technologies in an efficient manner.
12.66 To propel growth and to accelerate the provisioning of affordable services to the citizens in the fast-emerging area of satellite-based services, reforms have been undertaken to promote ease of doing business by limiting the multiplicity of charges at different stages of rolling out satellite-based communication services. To simplify the existing processes, vital changes have also been carried out to streamline satellite-related clearance processes.
12.67 Universal and equitable access to broadband services across the country, especially in rural areas, is an important part of the government’s vision for national digital connectivity. Toward realising that vision, the GatiShakti Sanchar portal was launched on 14 May 2022. This portal will streamline the process of Right of Way (RoW) applications and permissions across the country. The portal has been developed keeping in view the vision areas of the National Broadband Mission at the core, which are providing broadband infrastructure as a core utility to every citizen, governance and services on demand and in particular, digital empowerment of the citizens of our country.
12.68 Now, having discussed telecom at length, the next digital story which rings in our ears is radio which has been one of the best media to reach all residents of the country.
Box Xii.5: Radio – the waves that connected ..!!
In today’s fast-moving social media age, it is noteworthy how one of the components of mass media, namely the radio has not only persisted as the bulwark for outreach during the times of pandemic and beyond but in this fast-evolving digital era has also embossed a separate identity of its own in the hearts of many. Radio continues to be the most affordable and popular medium of mass communication in India and has been a tool that has consistently helped in empowerment and social development of the people of our country. The accessibility, wide coverage, variety of programmes, mobility and vernacularity have continued to be reasons for its popularity. For instance, the popular ‘Mann ki Baat’ programme where the Prime Minister establishes a dialogue with the citizens on issues of day-to-day governance reached the milestone of completing its 96th episode on 25th December 2022, with more to follow this year.
The iconic line “This is All India Radio. The news read by…” rings in our ears as we reminisce how Prasar Bharati, India’s autonomous public service broadcaster, has not only been witness to the history and landmark events of the country, but has also been the proverbial story-teller for all citizens across the country, standing by its motto ‘Bahujan Hitaya: Bahujan Sukhaya’, meaning ‘for the happiness of many, for the welfare of many’. It broadcasts in 23 languages, 179 dialects from 479 stations across the country, reaching nearly 92 per cent of the area and 99.2 per cent of the total population of the country. Prasar Bharati marked its silver jubilee on 23 November 2022, and it is notable how it has embraced technology, reflected in the fact that over 240 radio services of All India Radio are live-streamed on NewsOnAir App, Prasar Bharati’s official App. These streams have a large number of listeners not just in India, but globally, in more than 85 countries across the world.
Along with the public broadcaster, private commercial radio stations (FM Radio) and Community Radio Stations (CRS) each serve as platforms for a variety of programmes. FM Radio has flourished in the last few years, as observed in the quarterly growth in private FM Radio stations, with their number increasing from 243 in the quarter ending December 2015 to 388 in quarter ending June 202213.
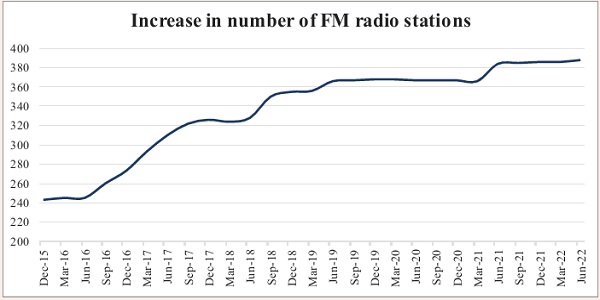
The rising number of FM radio stations depicts how radio as mass media has satisfactorily delivered on their mandate of public service and stood strong with the people during the time of the pandemic. While FM increased its outreach to even far-flung rural areas, CRS targeted local and well-defined communities. The daunting task of spreading awareness on the pandemic, and that too in vernacular, with innumerable dialects, was made possible, as CRS channelized the community partnerships. In times when the reach of centralized media to every nook and corner of the country was a gargantuan task, these radio waves travelled without interruption for the larger public cause. They not only became a medium for information dissemination but also functioned as a channel for empowerment as virtual education also took the recourse of radio.
With this, we see the radio as being significantly important through good and tough times. As we operate in a new normal and as things settle down with time, these small boxes requiring manual tuning may again find their place in some household cupboards. However, their identity will remain intact. It will once again come to the fore to speak for itself with the iconic line “This is All India Radio. The news read by…”.
Growth Story of Digital Public Infrastructure
12.69 The emergence of Digital Public Infrastructure (DPI), aimed at improving financial literacy, innovation, entrepreneurship, employment generation, and empowering beneficiaries has played a critical role in uplifting the economy and bringing it to the stature where it stands today. The journey of DPI has been remarkably memorable, dating to 2009, when Aadhaar was first launched. It is fourteen years now, and the digital journey since then has taken the country quite far. The three growth drivers that acted as catalysts for DPI growth were favourable demographics, vast expansion of the middle-class, and digital behaviour patterns. By leveraging these growth drivers, India has built a competitive digital economy that empowers every individual and business to transact paperless and cashless.
12.70 With Aadhaar establishing the authentication framework for verifying the identity of beneficiaries of welfare schemes, the next logical step was to make major government services available digitally. However, a lack of knowledge about the existing schemes was seen as a primary reason behind the beneficiaries’ inability to access the schemes’ benefits. ‘MyScheme’ is an e-Marketplace for schemes where users can look for suitable schemes based on their eligibility. It helps reduce users’ time and effort by doing away with the requirement of searching multiple websites of government departments and studying multiple scheme guidelines to check their eligibility. The scheme also acts as the single national platform for launching any government scheme. As on 16 January, 2023, more than 181 Central and State/UT government schemes across 14 diverse categories have been hosted on the portal.
Figure XII.11: Myscheme portal provides information on schemes in three easy steps

Source: https://www.myscheme.gov.in/, accessed on 3rd January 2023.
12.71 To reduce the search cost for the commoners, the government launched Unified Mobile Application for New-Age Governance (UMANG), which enables citizens to access e-Government services offered by the Central and State Government in various sectors such as agriculture, education, health, housing, employees, pensioners, and students’ welfare, the Public Distribution System, and others. Until 16 January 2023, UMANG catered to about 21,869 services (1,672 Central and State Govt. services and 20197 Bill Payment services) under 310+ departments of Central Government and departments of 34 States/UTs. Over 4.9 crore users are registered and benefiting from services on UMANG. Four hundred and eighty-nine DBT (Direct Benefit Transfer) schemes were made live on UMANG until September 2022. During the trying times of Covid-19, UMANG was instrumental in making available the services of EPFO for claims related to Covid-19. Around 4.9 lakh advance claims in EPFO have been raised via the UMANG Platform until September 2022.
12.72 While the initiatives mentioned above focused on bringing the government to the doorsteps of the citizens, a unique initiative that deserves special mention is the Open Network for Digital Commerce (ONDC). ONDC aims to go beyond the current platform-centric digital commerce model where the buyer and seller can use the same platform or application for transactions. ONDC is a network-based open protocol that would connect all the buyers and sellers on the network thus bringing better visibility across the Business-to-Consumer (B2C) & Business-to-Business (B2B) landscape. In the ONDC framework, consumers can potentially discover any seller, product, or service by using any compatible application or platform. This will increase the freedom of choice for the consumers and will enable them to match demand with the nearest available supply, allowing them to choose their preferred local businesses. ONDC’s beta test in the city of Bengaluru is a major first step in operationalising a network approach to e-commerce as an alternative to a platform-centric approach. The open network system will make the e-Commerce landscape more inclusive, accessible, and experience-driven for all consumers and sellers, especially for small businesses that will exercise more freedom in business decision-making.
12.73 The government is also cognizant of the need to improve the productivity of human capital. In order to promote open collaborative software development of e-governance applications, a platform called OpenForge has been developed. Through OpenForge, the use of open-source software and sharing and reuse of e-governance-related source code is promoted. As on 16 January 2023, there are 10,328 users on the platform, with 2,205 projects 14.
12.74 Another important domain that the government has emphasised is the availability of open resources on Artificial Intelligence (AI). The national AI portal has been developed with a view to strengthening the AI ecosystem in the country by pooling together and highlighting the latest developments happening in Central and State Governments, industry, academia, NGOs, and civil societies. As on 16 January 2023, it has published 1724 articles, 829 news items, 276 videos, 127 research reports, and 120 government initiatives, all related to AI.
12.75 In a country such as India, with its unmatched linguistic and cultural diversity, AI has great potential as a tool for overcoming the language barrier. ‘Bhashini’, the National Language Translation Mission, aiming at nurturing Indian language technologies and solutions as a public good, was launched in July 2022. The Digital India Bhashini portal15 is a public digital platform on which 260 open-source API-based AI models are available for speech-to-text conversion, machine translation, and text-to-speech conversion in 11 Indian languages and English for various purposes. Bhashini has great potential to bring access to the internet and other digital resources to millions of Indians in their own languages.
12.76 The digital landscape is a fast-changing one with overarching technologies arriving at the doorstep of consumers and businesses. The third generation in web technologies, ‘Web 3.0’ is one such example where in the entire experience of the internet is changing in the way how it will be used, how websites are managed, and how internet services are provided. The horizons of internet use have broadened, and so has their deployment of better standards. The Open Credit Enablement Network (OCEN) is one such set of standards that is being hailed as a major shift in how lending and borrowing will be conducted in the future. This is another good initiative towards democratising lending operations and thus ensuring that small borrowers are able to avail themselves of the best terms under which credit is available.
12.77 Today, we have a powerful story on digital public infrastructure that is finding global resonance. The increasing digital adoption during covid-19 in areas like healthcare, agriculture, FinTech, education, and skilling indicates that the digital delivery of services in India has a massive potential across economic sectors. It is usually suggested that developing countries must follow global best practices. However, how India has created and harnessed its DPI is capturing the attention of many nations globally. Low-cost accessibility (Aadhaar), the success of citizen-centric services like Unified Payments Interface (UPI), large-scale adoption and reach (DigiLocker, MyGov), and the vaccine journey through Co-Win are important and successful milestones in India’s public digital infrastructure journey.
Box XII.6: Unified Payments Interface – The game changer in real-time payments!
‘I like how you’ve brought out the rising popularity of UPI. I laud my fellow Indians for embracing digital payments! They’ve shown remarkable adaptability to tech and innovation’
shri Narendra Modi, Hon’ble PM
Unified Payments Interface (UPI) is a system that empowers and knits multiple bank accounts into a single mobile application (of any participating bank), merging several banking features, seamless fund routing and merchant payments into one hood. It also caters to the “Peer to Peer” collection request, which can be scheduled and paid as per requirement and convenience.
Introduced in 2016 to revolutionize the payment landscape through universal operability, single payment address, and low-cost mobile-first payment system, UPI has acted as a positive disruption towards enabling greater digital payments adoption in the country. UPI is a single mobile application for accessing different bank accounts. It can be accessed on all major platforms, such as Android and iOS. As the application is user-friendly and fast, consumers and merchants have displayed a great affinity to digital technology, leading to rapid growth in this digital payment infrastructure. The journey of UPI has been fascinating. The number of banks that became part of the real-time payment system increased from 35 in December 2017 to more than 380 in December 2022. Though pre-existing payment modes such as debit cards, credit cards, National Electronic Funds Transfer (NEFT) and Real-Time Gross Settlement (RTGS) have grown over time, UPI has shown a quantum jump comparatively to become one of the preferred modes of payment. In this sense, the progress of UPI has been remarkable.
In FY19, UPI accounted for 17 per cent of the country’s total 3,100 crore digital transactions. The next fiscal year saw UPI’s share rise to more than 27 per cent as it processed 1,250 crore transactions out of 4,600 crore digital transactions. In FY22, UPI accounted for 52 per cent of the total 8,840 crore financial digital transactions.
On average, between FY19-22 (calendar year), growth in UPI-based transactions in value and volume terms have been 121 per cent and 115 per cent, respectively. Recently, in Dec 2022, UPI touched its highest-ever mark with 782 crore transactions worth ₹12.8 lakh crore.
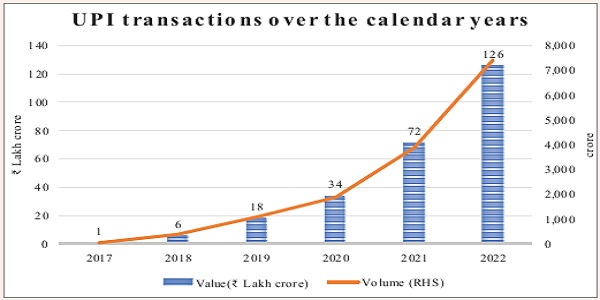
Source: NPCI
UPI also allows for multiple methods for integrating payments—QR based payments being the most popular. In just 5 years, over 23 crore UPI QRs have been deployed in the market for accepting merchant payments, from only 25 lakhs devices that were accepting merchant payments before this.
The benefits of UPI became evident during the Covid-19 pandemic when UPI served as a critical lifeline, especially for small and micro merchants. Further, UPI has processed 2,922 crore contactless merchants’ transactions with a total value over ₹21.7 lakh crore in FY23 (till December 2022).
The success of UPI has not been restricted to India alone; NPCI, through its international arm NPCIL is pushing for acceptance of RuPay/UPI powered apps, cross-border remittance and UPI-Like deployment in international markets such as Singapore, UAE, France, the Netherlands among others.
Initiative towards the discussion on cross-border remittances will help reduce the cost incurred and procedures involved towards money transfer at present by the migrant workers. The smooth transfer of money will increase the total value of remittances, increasing their impact on economic development. NPCI has also succeeded in developing an exemplary robust payments system that is cost-effective, secure, convenient and instantaneous. Several nations have displayed an inclination towards establishing a ‘real-time payment system’ or ‘domestic card scheme’ inspired by the exemplary innovations by NPCI in the country.
Tech companies are increasingly leveraging the power of UPI to expand the digital ecosystem, which has led to a significant acceleration in the pace of financial inclusion. UPI has opened up many opportunities for start-ups and e-Commerce players to develop innovative solutions that elevate the customer experience. The open systems have enabled global players like Google, WhatsApp, Walmart, True Caller, Amazon, Uber etc., to provide UPI services.
It is envisioned that the journey of UPI will help accelerate the process of financial inclusion and digital adoption in India by creating a more prosperous and inclusive ecosystem that can accommodate larger sections of the population in times to come.
12.78 The introduction of GST, with its end-to-end digitisation of all processes, digitalisation of tax administration, and the faceless e–assessment scheme for Income Tax, have improved governance and formalisation of the economy. The seamless generations of e-way bills and electronic toll collections have further augmented better tax collections for the government. It has not just helped in curbing tax evasion but generated trust for small businesses through monitoring compliance.
12.79 The government has also taken initiatives towards empowering individuals with control over their data to access essential services related to finance, health, education, and skills digitally. The Account Aggregator (AA) is a global techno-legal framework that enables individuals to share their financial data quickly and securely, with their consent, with any regulated third-party financial institution of their choice. The AA framework is currently live across over 110 crore of bank accounts.
12.80 Adding to the journey, FY15 can be considered a turning point for the Indian start-up environment. The reforms led by our government, in addition to existing inherent advantages like demography, technological developments, entrepreneurial spirit, and market size, have changed the landscape of the start-up ecosystem in India. The year 2021 marked the completion of five years of the ‘Stand-up India’ scheme (launched in January 2016), and the numbers – with more than 84,000 recognized start-ups – tell the entire story. Start-ups have moved past the traditional territory of consumer products and services to much larger value-added services such as satellites.
12.81 India is also geared to strengthen the up-and-coming drone industry. Under Mission ‘Drone Shakti’, the drone start-ups and Drone-as-a-Service (DrAAS) are being promoted. Almost 90 per cent of the airspace has now been opened up as a green zone for flying drones up to 400 feet. A Production-Linked Incentive (PLI) scheme for drones and drone import policy have been notified. Also, the private equity investments in agri-tech space have skyrocketed over the past four years – witnessing an increase of more than 50 per cent per annum to aggregate approximately ₹6600 crore.
12.82 As our digital space widens to bring in newer services, the need for appropriate regulations also becomes paramount. Therefore, techno-smart regulations are the future for digital societies. In this regard, the governments worldwide have adopted or are introducing legislation to provide a foundation for robust data governance. Their policy goals can be complemented and advanced with the help of standard, open, and interoperable protocols that increase the choice of digital services available to a user and enhance user privacy, such as the Data Empowerment & Protection Architecture.
Conclusion/Outlook
12.83 Today, we are operating in the new normal where the global economy is still recovering from the setback due to pandemic, and geo-political conflicts persist. India could effectively steer through the situation owing to its dedicated support to infrastructure creation through increased capex and strong macroeconomic fundamentals. This underpinned economic growth when the private sector was cautious in investing due to its balance sheet problems and uncertain demand outlook stemming from global shocks.
12.84 The targeted increase in investment is seen across all infrastructure sectors. To help sustain the investment drive, NIP provided a forward-looking roadmap of investible projects. Further, PM GatiShakti has helped accelerate infrastructure development by integrating the seven engines (roads, railways, airports, ports, mass transport, waterways, and logistic infrastructure) of growth. While traditional infrastructure sectors such as roads and railways have received a renewed push in recent years, sectors such as inland water transport and civil aviation, which have significant untapped potential, are also being encouraged sufficiently. Parallelly, the focus is also on improving coordination among different stakeholders and ministries. This will help resolve compliance issues and increase the efficiency and effectiveness of investments.
12.85 Besides, the reforms being undertaken in energy and power sector will help fast-track India’s progress in the next 25 years. With a population of nearly 140 crore, India has a massive demand for energy from all sectors including primary, secondary and tertiary. Affordable and reliable availability of power is critical for India’s aspirations for the manufacturing sector to be fulfilled. Further, with the growing importance of clean energy, there has been a renewed push towards non-fossil fuel-based energy sources in the power sector. The government, along with the private sector, has progressively worked towards increasing the share of renewables. This will ensure a gradual but calibrated energy transition, meeting the country’s sustainability targets and giving primacy to its national developmental requirements.
12.86 With the advent of new technologies, we are witnessing new regulatory challenges. Technology and innovation are, per se, neither constructive nor destructive. The use cases present the positive aspects of technology and innovation. The government is committed to keeping pace with the digital landscape developments including those related to legislations and frameworks. While the digital journey started with Aadhaar as a medium for service delivery at the doorstep, UPI strengthened the digital payment infrastructure. With other initiatives like Co-WIN, e-RUPI, TReDS, Account Aggregators, ONDC, etc. at different stages of implementation, India has developed a unique and cogent digital story to tell. The journey is ongoing and there is much untapped potential in India’s digital public infrastructure space.
12.87 In sum, the synergy between physical and digital infrastructure will be one of the defining features of India’s future growth story.
Notes:-
1 In a broad sense, the term infrastructure refers to the “…physical facilities, institutions and organisational structures, or the social and economic foundations, for the operation of a society” (World Investment Report 2008: Transnational Corporations and the Infrastructure Challenge. United Nations Conference on Trade and Development.). The present chapter focuses only on emerging issues in the context of physical and digital infrastructure. Separate chapters of this survey provide in-depth views on social infrastructure and financial infrastructure related issues.
2 Mitra, A., Varoudakis, A., & Véganzonès‐Varoudakis, M. (2002). Productivity and Technical Efficiency in Indian States’ Manufacturing: The Role of Infrastructure. Economic Development and Cultural Change, 50(2), 395–426. DOI:10.1086/321916.
3 Dutt, G. and Ravallion, M. (1998). Why have some Indian States Done Better than Others at Reducing Rural Poverty? Economica, 65: 17-38. https://doi.org/10.1111/1468-0335.00112
4 Binswanger, H; Khandker, R. & Rosenzweig, M. (1993). How infrastructure and financial institutions affect agricultural output and investment in India, Journal of Development Economics, Volume 41, Issue 2, 1993, Pages 337-366, https://doi.org/10.1016/0304-3878(93)90062-R.
5 Fan, S., Hazell, P. and Thorat, S. (2000). Government Spending, Growth and Poverty in Rural India. American Journal of Agricultural Economics, 82: 1038-1051. https://doi.org/10.1111/0002-9092.00101.
6 Sahoo, P. & Dash, R. (2009) Infrastructure development and economic growth in India, Journal of the Asia Pacific Economy, 14:4, 351-365, DOI:10.1080/13547860903169340
7 https://www.bis.org/publ/bppdf/bispap106.pdf, page 4.
8 https://bfsi.economictimes.indiatimes.com/news/fintech/indias-fintech-market-size-at-31-billion-in-2021-third-largest-in-world report/88794336 BLinC per cent20report_Fintech_2022.pdf
9 Bahal, Girish & Raissi, Mehdi & Tulin, Volodymyr. (2018). Crowding-Out or Crowding-In? Public and Private Investment in India.
10 The survey could not be undertaken in 2020 in the wake of the COVID-19 pandemic.
11 KRCL: Konkan Railway Corporation Ltd.
12 per cent change in Rural subscriptions – per cent change in Urban subscriptions.
13 Data sourced from quarterly Performance Indicator Reports by TRAI (Telecom Regulatory Authority of India)
14 As per https://openforge.gov.in/ , last accessed 4 January 2023.
15 https://bhashini.gov.in


