India’s external sector has been buffeted by shocks and uncertainty manifested in terms of elevated, though now easing global commodity prices; tightening international financial conditions; heightening financial market volatility; reversal of capital flows; currency depreciation, and looming global growth and trade slowdown. However, it has been able to face these headwinds from a position of strength on the back of strong macroeconomic fundamentals and buffers.
During FY23 (till December 2022) India’s exports have displayed resilience on the back of record levels of exports in FY22. Petroleum products, gems & jewellery, organic & inorganic chemicals, drugs & pharmaceuticals were among the leading export items. However, the slowdown in Indian exports is inevitable in a slowing global economy characterised by slowing global trade. Recognising the key role exports play in improving the resilience of the external sector, from a medium to long-term perspective, various export promotion measures are being considered/implemented. These measures would nurture the inherent comparative advantage that Indian exports embody. In addition, while National Logistics Policy would ease the domestic frictions to encourage Indian exports by reducing the cost of internal logistics, the latest Free Trade Agreements, such as with UAE and Australia, would address the external frictions by creating opportunities for exports at concessional tariffs and non-tariff barriers. Thus, the whole ecosystem would evolve in an export-friendly manner over time.
Apart from the elevated crude oil prices, the revival of economic activity contributed to an increase in imports. Petroleum, crude & products; electronic goods; coal, coke & briquettes, etc.; machinery, electrical & non-electrical and gold were among the top import items. While the continued softening of the global commodity price outlook would assist moderate imports going forward, non-gold, non-oil imports may not decelerate significantly. Further, efforts are underway to promote international trade settlement in Indian Rupees. Once these initiatives gain traction, dependence on foreign currency would potentially reduce, making the economy less vulnerable to external shocks.
Balance of Payments (BoP) encountered pressures during the year under review. While the impact of a sharp rise in oil prices was discernible in the widening of the Current Account Deficit (CAD), notwithstanding the cushion provided by the surplus on Invisibles (services, transfer, and income), policy tightening by the US Federal Reserve and the strengthening of the US dollar led to Foreign Portfolio Investment (FPI) outflows. As a result, the surplus of the capital account was lower than the CAD leading to a depletion of forex reserves on a BoP basis. However, going forward, the expected easing of crude oil prices, the resilience of net services exports and buoyant inward remittances would result in lower CAD during the remainder of FY23 and is expected to be within sustainable limits.
The fortified shock absorbers of India’s external sector are in place to cushion the global headwinds be it the formidable forex reserves, sustainable external debt indicators, or market-determined exchange rate. While forex reserves as of the end December 2022 stood at US$ 562.72 billion, accounting for 9.3 months of imports, the ratio of external debt to GDP is at a comfortable level of 19.2 per cent as of end-September 2022.
Introduction
11.1 Two global shocks in the new millennium – one an economic shock and the other, a health shock – have had very contrasting repercussions on the global economy. Following the global financial crisis in 2007-08 as the inflationary pressures were muted, interest rates were extremely low for long years. The easing financial conditions supported global economic growth, which reached 4.5 per cent in 2010. Now, the Covid-19 pandemic is another shock to global growth performance, with economic growth down to a negative of 3.8 per cent in 2020. The following two years saw inflation rates rise to multi-decade highs, fuelled by global commodity and food price spikes. The situation has been further amplified by the Russia-Ukraine conflict. To stem the situation, monetary authorities in advanced economies, especially the US Federal Reserve (US Fed), are accelerating the pace of monetary policy normalisation. The 10-year Treasury yield in the US increased almost six-fold between mid-2020 and mid-2022. Risk assets were sold off sharply triggering capital flight from many emerging and frontier market economies, bringing to a halt the rebound of net capital flows to developing countries observed since the last quarter of 2020.
11.2 Interest rates and prices of risk assets have been extremely volatile since April 2022, reflecting heightened uncertainty about the economic and policy outlook, exacerbated by low liquidity. The US dollar appreciated sharply against currencies of Emerging Market Economies (EMEs) and major advanced economies facing high borrowing costs. Thus, global financial conditions have considerably tightened especially since April 2022, and the balance of risks is significantly skewed to the downside, thereby weakening the global economic outlook. Global growth is forecast to slow from 6.0 per cent in 2021 to 3.2 per cent in 2022 and 2.7 per cent in 2023 according to the International Monetary Fund (IMF).1 This is the weakest growth profile since 2001 except for the global financial crisis and the acute phase of the pandemic. Further, external public debt vulnerability concerns are being exacerbated as such debt in developing economies is at record levels presently and most of it is owed to private creditors, with much of it involving variable interest rates that could spike suddenly.2 Thus, emerging markets face a host of risks emanating from elevated external borrowing costs, sticky high inflation, volatile commodity markets, uncertain global economic growth outlook, and spill overs from policy tightening in advanced economies.
11.3 Against this fast-evolving global backdrop, this chapter chronicles the developments in the external sector of the Indian economy focusing on exports, imports, international investment, foreign exchange reserves, movement of the currency against the US dollar, external debt, and the BoP situation. Where available, a comparison of some of these indicators with some peer countries is also made to present India’s external sector situation in a proper perspective.
Trade Helping India Reap the Benefits of Globalised World
11.4 In the present globalised and integrated world, trade is essential for developing countries to reap the benefit of increased globalisation of products and financial markets. It is well recognised that trade is not an end in itself but a means to balanced, equitable, and sustainable development. Conventional economic theories point towards potential gains that could emerge from openness to international trade and investment.
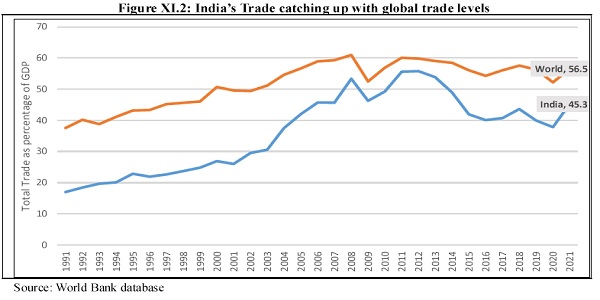
11.5 Over time, the trade openness of countries across the globe has been increasing as measured by trade as a proportion of GDP. For the world as a whole, the share of trade as a percentage of world GDP3 has been in the range of 50-60 per cent since 2003 and stood at 52 per cent in 2020, according to the World Bank database. For India as well, the share of trade as a percentage of GDP has been steadily increasing, being above 40 per cent since 2005 (except 2020 being the pandemic year). The ratio stands at 46 per cent in 2021 and 50 per cent for H1 of 2022.
Global Scenario
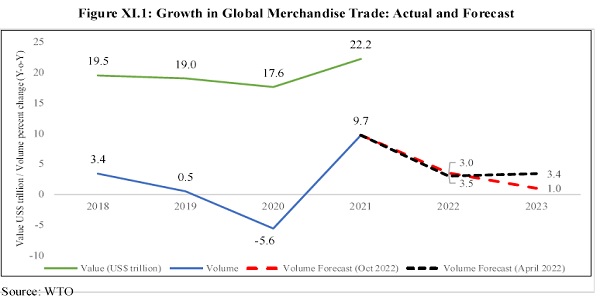
11.6 Post Covid- 19-induced disruptions, global trade prospects have improved in FY22. Global trade exhibited resilience in the first half (H1) of 2022, notwithstanding the headwinds from the Russia-Ukraine conflict. Robust merchandise imports – emerging primarily from Europe, the United States, and parts of the developing world supported the growth of merchandise trade in H12022. This partially reflected pent-up demand relating to the legacy of the pandemic-driven spending shift from services towards goods that were constrained earlier because of the supply bottlenecks. Other factors contributing to the trend were the appreciation of the dollar in the case of the United States, the relative dynamism of intra-regional trade in Europe, and favourable terms-of-trade effects in some large emerging economies due to elevated energy prices.4 The global trade volume grew by 4.8 per cent in H12022, on top of an impressive recovery of 9.7 per cent in 2021, as per the World Trade Organisation (WTO) statistics. The global merchandise trade in value terms rose year-on-year (YoY), by 22.2 per cent in 2021, reversing the deceleration observed in the previous three years. During the H1 of 2022, the trade-in value terms grew by 32 per cent compared to the corresponding period of 2019.5
11.7 However, the global trade outlook turned grimmer in the second half (H2) of 2022 on the back of a confluence of adverse factors including the increasing likelihood of a recession in the major economies and the tapering demand for consumer durables; aggressive monetary policy tightening by several central banks; disorderly financial conditions; continued supply-chain disruptions and elevated freight charges. The leading indicators of global trade viz., inventories and new export orders seem to bear testimony to these adverse events. Trade growth is likely to slow in the closing months of 2022 and into 2023, according to the WTO Goods Trade Barometer6 released on 28 November 2022, as the global economy continues to be buffeted by strong headwinds. The current reading of 96.2 is below both the baseline value for the index and the previous reading of 100.0, reflecting the slowdown in demand for traded goods.
11.8 Thus, as regards the future trade projections, according to the WTO, world trade is expected to lose momentum in H2-2022 and remain subdued in 2023. The organisation forecasts global trade to grow in 2023 by just 1 per cent, a sharp downward revision from the previous estimate of 3.4 per cent7. However, there is a high degree of uncertainty associated with the forecast due to shifting monetary policy in advanced economies and the unpredictable nature of the Russia-Ukraine conflict. The United Nations Conference on Trade and Development (UNCTAD), in its Global Trade update of December 2022 has also noted that the ongoing trade slowdown is expected to worsen for 2023 and further that while the outlook for global trade remains uncertain, negative factors appear to outweigh positive trends.
India’s growing and diversifying trade
11.9 International trade has been an important pillar of the resilience of India’s external sector. Trade as a percentage of GDP for India was in the range of 12-15 per cent in the 1980s; 16-25 per cent in the 1990s and 25-50 per cent in the 2000s. In the following paragraphs, a detailed analysis of India’s trade performance is presented.
Trends in Merchandise Trade
11.10 India achieved an all-time high annual merchandise export of US$ 422.0 billion in FY22. However, the global economy has started facing formidable headwinds and the ripple effect of the global trade slowdown has started reflecting in India’s merchandise export growth, wherein moderation in pace is observed in 2022. Merchandise exports were US$ 332.8 billion over April-December 2022 against US$ 305.0 billion during the period April-December 2021. Non-petroleum and non-gems & jewellery exports in April-December 2022 were US$ 233.5 billion, as compared to US$ 230.0 billion in April-December 2021. Petroleum, oil, and lubricants (POL) exports constituted about 21.1 per cent and non-POL exports were 78.9 per cent of total exports during FY23 (until December 2022). Owing to the rise in global crude oil prices, petroleum products continued to be the most exported commodity in FY22 and April-December, 2022, followed by gems and jewellery, organic & inorganic chemicals, and drugs & pharmaceuticals (Tables 6.3A & B of Statistical Appendix).

Bright spots in India’s Trade performance
11.11 Significant strides in exports were registered in drugs and pharmaceutical, electronic goods, engineering goods and organic and inorganic chemicals sectors in FY22. These sectors have sustained their growth momentum despite the global headwinds in H1 FY23. India’s pharma exports grew despite Covid impacted disruptions in supply chain increasing significantly from US$ 15.4 billion in FY15 to US$ 24.6 billion in FY22 and stood at US$ 18.8 billion during April-December 2022, registering a positive growth of 3.6 per cent over April- December 2021. The high growth in export was on account of the stocking of inventories of medicines by countries all over the world, and increased demand for vaccines and medicines related to the Covid- 19 pandemic which India was in a position to provide. India has also been seeing consistent growth in exports of electronic goods. Electronic goods exports which remained below US$ 10 billion till FY19, have shown an increase of 51.6 per cent from US$ 11.0 billion during April-December 2021 to US$ 16.7 billion during April-December. 2022. Engineering goods exports crossed the US$ 100 billion mark in FY22 for the first time. Organic and inorganic chemicals exports have increased significantly in FY22 and were USD 23.0 billion during April-December 2022 registering a growth of 6.5 per cent over the same period last year.
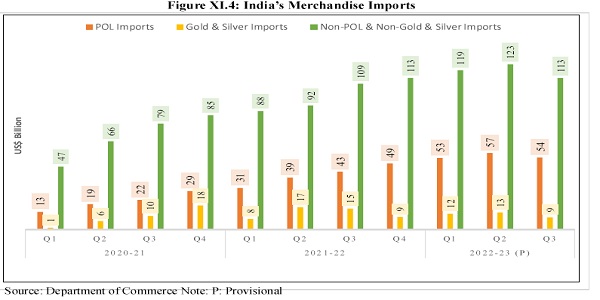
11.12 As the pandemic ebbed, India witnessed a revival in domestic demand resulting in strong import growth. Merchandise imports for the period April-December 2022 were US$ 551.7 billion as against US$ 441.5 billion during the period April-December 2021. Among major import commodities, petroleum crude & products imports increased by 45.6 per cent to US$ 163.9 billion in April-December 2022 compared to US$ 112.6 billion in April-December 2021 and continue to be the highest imported commodity.
11.13 Energy demand may be pushing India’s imports for fuel including coal and Petroleum, Oil & Lubricants (POL), whose share rose to 37.1 per cent in total imports in April-December 2022 against 30.4 per cent in the corresponding period last year. Other principal imports included electronic goods; coal, coke & briquettes; machinery electrical & non-electrical, and organic & inorganic chemicals (Tables 6.2 A&B of Statistical Appendix).
11.14 The merchandise trade deficit for April-December 2022 was estimated at US$ 218.9 billion as against US$ 136.5 billion in April-December 2021.

11.15 The USA remained the top export destination in April-November, 2022 followed by UAE and the Netherlands. The Netherlands has displaced China from the 3rd spot as India’s exporting partner. India has diversified its export destinations over time. For example, the share of South Africa in total exports has risen from 1.2 per cent in FY19 to 2.0 per cent in FY23 (April to November). Over the same period, the share of Brazil has increased from 1.2 per cent to 2.5 per cent and that of Saudi Arabia from 1.7 per cent to 2.3 per cent. As regards imports, China, UAE, USA, Russia, and Saudi Arabia have a joint share of 40 per cent of the total imports of India. However, the share of China declined to 13.8 per cent during April-November 2022 from 15.5 per cent a year ago. Similarly, the share of the USA declined to 6.9 per cent in April-November 2022 from 7.2 per cent a year ago (Refer to Table 6.4 in Statistical Appendix).
Trade in Services
11.16 India maintained its dominance in the world services trade in FY22. Despite pandemic-induced global restrictions and weak tourism revenues, India’s services exports stood at US$ 254.5 billion in FY22 recording a growth of 23.5 per cent over FY21 and registered a growth of 32.7 per cent in April-September 2022 over the same period of FY22. Software and business services together constitute more than 60 per cent of India’s total services exports and exhibited strong growth during Q2FY23. While strong revenues in major information technology (IT) companies from various segments such as retail and consumer business; communications and media; healthcare; and banking, financial and insurance services drove the growth in software exports, a significant pick-up in engineering, and research and development related services boosted the growth in business services exports during the quarter.
11.17 Services imports rose by 25.1 per cent between FY22 and FY21 to reach US$ 147.0 billion and have registered growth of 36.7 per cent in April-September 2022 over the same period of FY22. The increase in services imports is mainly on account of payments for transport services, travel and other business services. Following the resumption of global activity, shortages of shipping vessels and high transportation costs resulted in a spike in transport payments. Travel imports saw a growth following the easing up of travel restrictions.
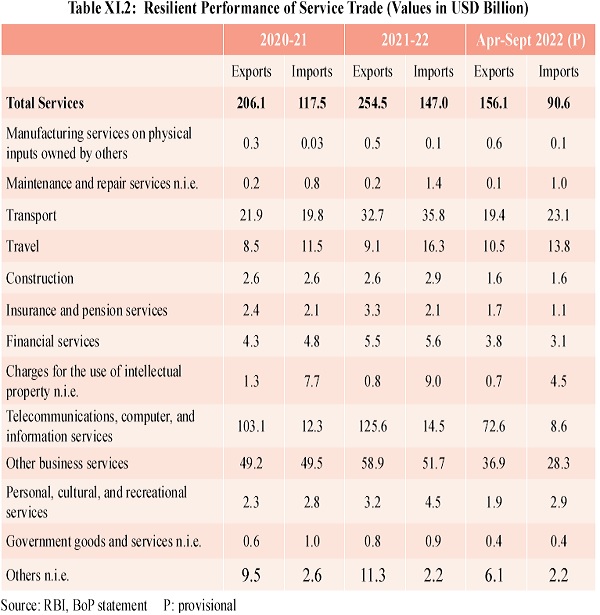
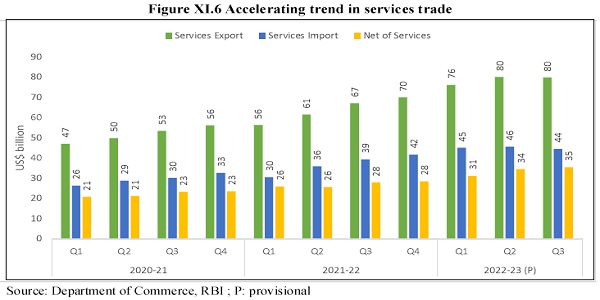
11.18 While merchandise exports are witnessing some slowdown in the second half of 2022, India’s service exports have been robust. Since India offers low-cost knowledge-based services, the demand for them has not fallen even amid a global economic slowdown and a negative outlook for the near future. The estimated value of services export for April-December 2022 is US$ 235.8 billion as against a value of US$ 184.7 billion in April- December 2021. The estimated value of services imports for April- December 2022 is US$ 135.0 billion compared to US$ 105.5 billion in the corresponding period last year. Supported by the services sector, India’s overall exports (Merchandise and Services combined) in April-December 2022 are estimated to be US$ 568.6 billion, exhibiting a positive growth of 16.1 per cent over the same period last year. Overall imports in April-December 2022 are estimated to be US$ 686.7 billion, displaying a positive growth of 25.6 per cent over the same period last year.
Foreign Trade Policy
11.19 India’s Foreign Trade Policy (FTP) has, conventionally, been formulated for five years at a time. The focus of the FTP has been to provide a framework of rules and procedures for exports and imports and a set of incentives for promoting exports. The latest FTP for 2015- 2020 is in vogue at present. To provide policy stability during the pandemic period, the five-year FTP 2015-20 was extended from 2020 to 2022. The policy has been further extended till March 2023 on account of volatile global economic and geopolitical situations and currency fluctuations. During this period, the Government has been taking significant measures and consistently looking into opportunities to diversify the exports both in terms of products as well as potential markets. The Government is actively working on facilitating trade agreements and launching schemes in consultation with various stakeholders. In the year 2022, India signed Free Trade Agreements (FTAs) with UAE and with Australia. This aims to provide greater market access with a reduction in tariff and non-tariff barriers on goods and services and make the exporters competitive. The Export Preparedness Index8 has also been introduced to evaluate States’ potentials and capacities. It will guide all stakeholders towards strengthening the export ecosystem at both the national and sub-national levels.
International Trade Settlement in Indian Rupees
11.20 In July 2022, the Reserve Bank of India (RBI) issued a circular permitting an additional arrangement for invoicing, payment, and settlement of exports/imports in Indian Rupees (INR) to promote the growth of global trade with emphasis on exports from India and to support the increasing interest in the global trading community in INR as an international currency. The framework involves invoicing of exports and imports in INR, market-determined exchange rates between the currencies of the trading partner countries, and settlement through special Rupee Vostro9 accounts opened with authorised dealer banks in India.
11.21 Under this arrangement for settlement, (a) Indian importers undertaking imports through this mechanism shall make payment in INR which shall be credited into the Special Vostro account of the correspondent bank of the partner country, against the invoices for the supply of goods or services from the overseas seller /supplier, while (b) Indian exporters, undertaking exports of goods and services through this mechanism, shall be paid the export proceeds in INR from the balances in the designated Special Vostro account of the correspondent bank of the partner country.
11.22 The above-mentioned framework for international settlement in INR acquires significance against the backdrop of the US Fed aggressively hiking the policy rates and its hawkish stand, the consequent rallying of the US dollar to multi-decade high levels, and concomitant weakening of currencies of various EMEs including the INR. The framework could largely reduce the net demand for foreign exchange, the US dollar in particular, for the settlement of current account-related trade flows. Further, the use of INR in cross-border trade is expected to mitigate currency risk for Indian businesses. Protection from currency volatility not only reduces the cost of doing business but also enables better business growth, improving the chances for Indian businesses to grow globally. It also reduces the need for holding foreign exchange reserves and dependence on foreign currency, making Indian economy less vulnerable to external shocks.10 Further, it could assist Indian exporters in getting advance payments in INR from overseas clients and in the longer term promote INR as an international currency once the rupee settlement mechanism gains traction. One of the prerequisites for the emergence of an international currency is that the said currency needs to be increasingly used for trade invoicing. In terms of foreign exchange market turnover (daily averages), as per the BIS Triennial Central Bank Survey 2022, the US dollar is the dominant vehicle currency accounting for 88 per cent of the global forex turnover. The INR accounted for 1.6 per cent. If the INR turnover rises to equal the share of non-US, non¬Euro currencies in global forex turnover of 4 per cent, INR could be regarded as an international currency, reflecting India’s position in the global economy.11
Initiatives to enhance trade
11.23 The commendable performance of India’s exports, standing at US$ 422.0 billion in FY22, exceeding the target of US$ 400 billion, has been the culmination of efforts from all quarters and across stakeholders. Some of the factors leading to the achievement of this target were putting in place of targets by the Government, including the setting of specific targets – country-wise, product-wise, and Export Promotion Council-wise; monitoring of the targets and course correction where required. The export growth was driven by an increase in demand for products like petroleum, cotton yarn, textiles, chemicals, and engineering goods. India was able to leverage the gap in the supply of certain products in the wake of the pandemic-related disruptions and meet the global demand. Exports were also helped by favourable global commodity prices. Some of the specific schemes of the Government which have and are facilitating and encouraging exports are as follows.
11.24 Focus on Agricultural Products: India’s agricultural exports achieved the highest ever export in FY22 reaching US$ 37.8 billion and it continued to perform well in FY23 with exports of US$ 26.8 billion during April- November 2022 backed by an effective agriculture export policy. Pro-active support of export promotion agencies including Export Inspection Council, Plantation Boards, and Agricultural and Processed Food Products Export Development Authority (APEDA), and export facilitating measures like online issuance of certificates required for exports, aided growth of agricultural exports. Regular promotions were organised for agricultural products through participation in trade fairs and special events in association with the Indian Missions.
To initiate agriculture exports from UTs of Jammu and Kashmir and Ladakh, APEDA has linked Kashmir valley start-ups, new entrepreneurs, Farmer Producer Organisations/farmer groups, and exporters of the region with importers. Regular shipments of high-value Kashmir Saffron (GI) are taking place to destinations including the Middle East, EU, and North America.
11.25 Interest Equalisation Scheme: This Scheme was formulated to give benefit in the interest rates being charged by the banks to the exporters on their pre- and post-shipment rupee export credits. While extending the scheme, from 1 October 2021 onwards, subvention rates have also been reduced. Henceforth, reduced revised rates of 3 per cent (erstwhile 5 per cent) subvention to MSME manufacturing exporters and 2 per cent (erstwhile 3 per cent) applies to merchant and other manufacturer exporters exporting along 410 (erstwhile 416) HS lines.
11.26 Remission of Duties and Taxes on Exported Products (RoDTEP) scheme: The scheme seeks remission of Central, State and Local duties/taxes/levies at different stages at the Central, State, and local level, which are incurred in the process of manufacturing and distribution of exported products, but are currently not being refunded under any other duty remission scheme.
11.27 Export Credit Guarantee: The Export Credit Guarantee Corporation (ECGC) supports Indian exporters and banks by providing export credit insurance services. ECGC provides insurance cover on the export consignment to protect exporters from the consequences of the payment risks. It also provides Export Credit Insurance to Banks (ECIB) to protect the Banks from losses on account of export credit given to exporters due to the risks of insolvency and/or protracted default of the exporter borrower. The ECGC has launched a new scheme in July 2022, under its ECIB products. Under this scheme the insurance cover to banks providing pre-shipment and post-shipment finance has been enhanced to 90 per cent from an average coverage of 70 per cent for accounts with an export working capital limit of up to X20 crore to support small exporters.
11.28 Krishi Udan Scheme: Krishi Udan Scheme was launched in August 2020 on international and national routes to assist farmers in transporting agricultural products so that it improves their value realisation. Krishi Udan 2.0 was launched in October 2021 enhancing the existing provisions, mainly focusing on transporting perishable food products from the hilly areas, North-Eastern states, and tribal areas. For facilitating and incentivising the movement of agricultural produce by air transportation, the Airports Authority of India provides a full waiver of Landing, Parking charges, Terminal Navigational Landing Charges and Route Navigation Facility Charges for Indian freighters and Passenger-to-Cargo Aircraft primarily around 25 airports focusing on North Eastern, Hilly and Tribal region and 28 airports in other regions/areas. Further, five more airports have been included under the Scheme, making it 58 airports.
11.29 Trade Infrastructure for Export Scheme: The Government has been implementing the Trade Infrastructure for Export Scheme since FY18 to assist Central and State Government Agencies in the creation of appropriate infrastructure for the growth of exports from the States. The Scheme provides financial assistance in the form of grant-in-aid to Central/State Government owned agencies for setting up or for up-gradation of export infrastructure as per the guidelines of the Scheme.
11.30 Districts as Export Hubs – One District One Product Initiative: The Districts as Export Hubs-ODOP initiative is aimed at targeting export promotion, manufacturing, and employment generation at the grassroots level, making the States and Districts meaningful stakeholders and active participants in making India an export powerhouse thereby contributing to the AatmNirbhar mission and achieving the vision of Make in India for the world and being Vocal for Local. The initiative is also aimed at fostering balanced regional development across all districts of the country. It seeks to select, brand, and promote products/services from each district of the country for enabling holistic socioeconomic growth across all regions, attract investment in the district to boost manufacturing and exports. A growing emphasis on exports by focusing on districts as potential export hubs is also likely to integrate India more closely with the global value chain and propel India to be a significant exporter by leveraging the diversity and competitiveness in agriculture, marine, textile, pharmaceutical, chemicals and many engineering products.
India’s Global Trade Engagements
11.31 This era of globalisation has been accompanied by a proliferation of trade agreements and the emergence of competing trade blocs. These trends are affecting every business, every industry, and every country so that keeping up with these changes has become a challenging task for policymakers around the globe. Governments have been pursuing international trade cooperation largely driven by diverse external and internal political economy considerations such as promoting peace and stability, increasing market size and most importantly, insuring themselves against unfavourable trade policies of other countries.
11.32 India has always stood for an open, equitable, predictable, non-discriminatory, and rule-based international trading system. India considers Regional Trading Arrangements (RTAs) as ‘building blocks’ towards the overall objective of trade liberalisation and as complementing the multilateral trading system. Recognising that RTAs would continue to feature permanently in world trade, India has engaged with its trading partners/blocs with the intention of expanding its export market since the early part of the previous decade and began concluding, in principle agreements to move, in some cases, towards Comprehensive Economic Cooperation Agreements (CECA) which covers FTA in goods, services, investment and identifies areas of economic cooperation.
11.33 The economic rationale for FTAs was the diversification and expansion of India’s exports to its trading partners, providing a level playing field vis-à-vis the competing countries having preferential access in our trading partners, as well as gain easier access to raw materials and intermediate products, at lower costs, for stimulating value-added domestic manufacturing. In the case of the India-Association of Southeast Asian Nations (ASEAN), India-Korea, and India-Japan Agreements, this was also part of a geopolitical strategy that dovetailed well into India’s “Look East Policy.”
11.34 India has so far concluded 13 FTAs and 6 Preferential Trade Agreements (PTAs). The most recent in the list are the India-UAE Comprehensive Economic Partnership Agreement (CEPA) which was signed on 18 February 2022 and officially entered into force on 1 May 2022 and the India-Australia Economic Cooperation and Trade Agreement (Ind-Aus ECTA), which was signed on 2 April 2022 and entered into force on 29 December 2022. Further, India is presently engaged in FTA negotiations with some of its trading partners, notable among these FTAs are – (i) India-UK FTA, (ii) India-Canada CEPA/ Early Progress Trade Agreement (EPTA), (iii) India-EU FTA. Moreover, India has also initiated action to review some of the existing FTAs, namely, India-Singapore CECA, India-South Korea CEPA, and India-ASEAN Trade in Goods Agreement and initiated discussions on scoping for the CECA with Australia, as envisaged under Ind-Aus ECTA.12 Box XI.1 discusses the rise in the number of FTAs being entered into worldwide and various factors that determine their usefulness to a trading partner.
Box XI.1: Free Trade Agreements
FTAs or RTAs in terms of the WTO rules13, are economic instruments available to a country for leveraging its competencies in trade and investment. As of June 2016, all WTO members now have at least one RTA in force. There has been a substantial rise in the number of trade agreements with 355 notifications of RTAs having been made to the WTO (As of 1 December 2022– Source: WTO website). Many WTO members continue to be involved in negotiations to create new RTAs, which are mostly bilateral. However, a recent development has been negotiations and new agreements among more than two WTO members, such as:
- Pacific Alliance between Chile, Colombia, Mexico, and Peru (Signed on 10 February 2014; entered into force on 1 May 2016);
- Tripartite Agreement, linking parties to the Common Market for Eastern and Southern Africa, the East African Community and the Southern African Development Community (Launched on 10 June 2015 and entered into force at different dates by different members);
- Comprehensive and Progressive Trans-Pacific Partnership Agreement (Signed on 8 March 2018; entered into force on 31 October 2018);
- African Continental Free Trade Area (AfCFTA) (Signed on 21 March 2018 and entered into force at different dates by different members); and
- Regional Comprehensive Partnership Agreement (RCEP) between the ASEAN members and six other WTO members (Signed on 15 November 2020; entered into force on 1 January 2022).
- The limited progress in the multilateral trade negotiations at the WTO is one of the reasons responsible for the increase in FTAs. FTAs are viewed favourably by trading countries in comparison to multilateral negotiation at the WTO forum as they are easy to negotiate and provide flexibility to factor in geopolitical considerations.
The purpose of RTAs is to lower tariffs on goods and services and increase cooperation between trading partners with the aim of increasing trade, lower prices for consumers, and provide enhanced export opportunities for producers. RTAs can also have a larger impact on the economy. For instance, Bailé et al. (2019) found that FTAs are positively correlated with direct domestic value-added exports, as well as forward and backward participation in global value chains. According to the conventional gravity model, developed by Tinbergen (1962), bilateral trade between two nations is proportional to their respective sizes, measured by their GDPs and inversely proportional to the geographic distance, a proxy for transportation cost. Over time, more variables, such as exchange rates, income levels and shifting demand patterns, have been added to the standard gravity model to test their relevance in influencing trade (Osabuohien et al., 2019). While an FTA provides the enabling environment for enhancing trade by reducing tariff and non-tariff barriers (NTBs), the trade growth of a country depends on many factors, such as:
(a) Specific features of the FTA such as the extent of tariff relaxations given vis-à-vis the Most Favoured Nation (MFN) tariffs14, on which products they are given and how the relaxation is staggered, i.e., is it over a long time or short time that the relaxations are agreed to be rolled out.15
(b) The extent of concessions in terms of Rules of Origin (RoO)16 and removal/easing of NTBs. While tariff barriers are agreed to be reduced in an FTA, NTBs, such as sanitary and phytosanitary measures, technical barriers to trade, contingent trade-protective measures etc., may lower the utilisation of the FTAs by traders.
(c) The capacity of an economy to increase the supply of products/services for which the FTA has provided an enhanced export venue. This ‘supply-response’ is determined by a wide range of factors which largely fall outside the ambit of an FTA. They include various policies on production aspects, a country’s physical and institutional infrastructure, and other elements determining the short-term flexibility of an economy. In other words, the supply-response is governed by the potential for trade creation wherein a member of an FTA, having a comparative advantage in producing a product, is now able to sell it to its FTA partners because trade barriers have been removed (Viner, 1950).
(d) The effect of the FTA would also depend on income growth in the importing markets and the price competitiveness of exports of a partner country in a trade agreement so as to be able to take advantage of the agreement.
Further, not all trade may happen through the FTA route, especially if the RoO are cumbersome or goods are already trading at MFN zero duty. In order to take advantage of the FTAs, these must be aggressively utilised by the traders and service providers. Thus, it may not happen that there will be a sudden or significant increase in trade after an FTA is signed between two or more countries. The trade balance would shift only gradually and may also turn out to not be in favour of each partner, depending on a host of factors, some of which are listed above.
REFERENCES
- Baier, S.L., Y.V. Yotov, and T. Zylkin. 2019. “On the Widely Differing Effects of Free Trade Agreements: Lessons from Twenty Years of Trade Integration,” Journal of International Economics 116:206–226.
- Osabuohien, E. S., Efobi, U. R., Odebiyi, J. T., Fayomi, O. O., & Salami, A. O. (2019). “Bilateral trade performance in West Africa: A gravity model estimation,” African Development Review, 31(1), 1–14.
- Tinbergen, J. (1962). “Shaping the world economy; suggestions for an international economic policy”, New York: Twentieth Century Fund.
- Viner, J. (1950). “The Custom Union”, Carnegie Endowment for International Peace, New York.
Balance of Payments in Challenging Times
Current Account Balance
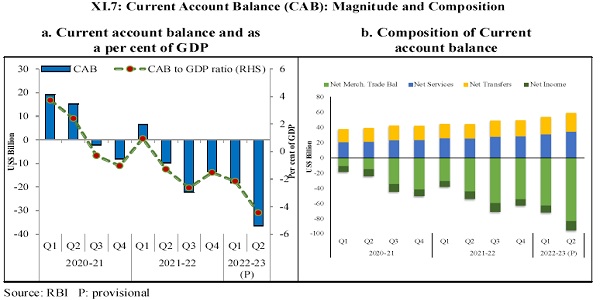
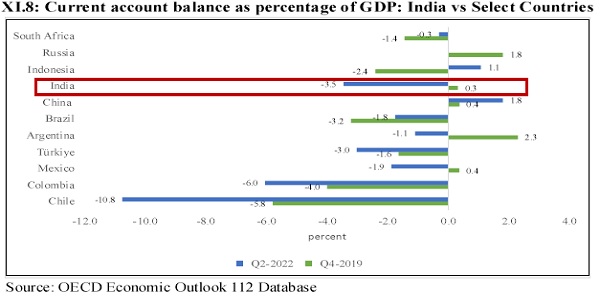
11.35 India’s external sector has been facing considerable global headwinds reflecting the geopolitical developments as detailed in the Introduction section above. India’s current account balance (CAB) recorded a deficit of US$ 36.4 billion (4.4 per cent of GDP) in Q2FY23 in contrast to a deficit of US$ 9.7 billion (1.3 per cent of GDP) during the corresponding period of the previous year. The widening of the current account deficit (CAD) in the second quarter of FY23 was mainly on account of a higher merchandise trade deficit of US$ 83.5 billion and an increase in net investment income outgo. For the period April- September 2022 (H1FY23), India recorded a CAD of 3.3 per cent of GDP on the back of an increase in the merchandise trade deficit, as compared with 0.2 per cent in H1FY22. However, a comparison with the position of the CAB for selected countries shows that India’s CAD is modest and within manageable limits.
Invisibles
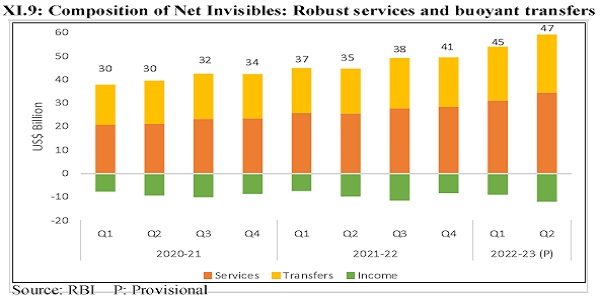
11.36 Net services receipts increased from US$ 51.4 billion in H1FY22 to US$ 65.5 billion in H1FY23, primarily on account of robust computer and business services receipts. Similarly, the net private transfer receipts, mainly representing remittances by Indians employed overseas, was US$ 48.0 billion in H1 FY23 against their level of US$ 38.4 billion during the same period a year ago. A sharp rise in crude oil prices and the deprecation of the INR seem to have boosted remittance flows into India. Net services exports and remittances contributed to the surplus on the invisible account, which cushioned the merchandise trade deficit.
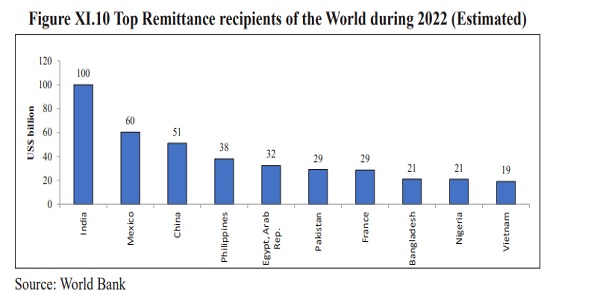
11.37 Remittances are the second largest major source of external financing after service export, which contribute to narrowing the CAD and has always been a stable constituent of the BoP. India has the largest emigrant population and is the top remittance recipient country with remittances anticipated to reach a milestone of US$100 billion in 2022 according to the World Bank.17 Remittances have benefitted from a gradual structural shift in Indian migrants’ key destinations from largely low-skilled, informally employment in the Gulf Cooperation Council (GCC) countries to a dominant share of high-skilled jobs in high-income countries such as the United States, the United Kingdom, and East Asia (Singapore, Japan, Australia, New Zealand).18
Capital Account Balance
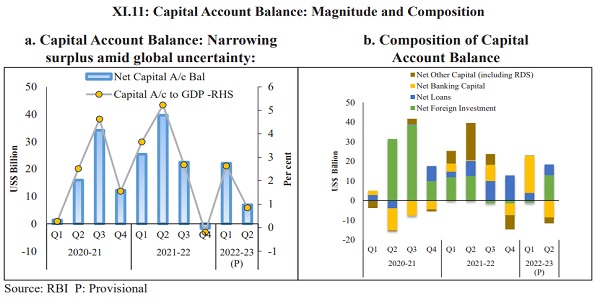
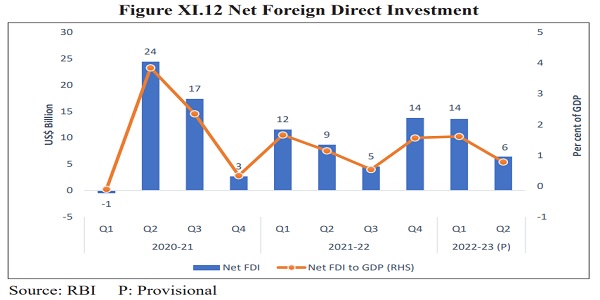
11.38 Foreign investment, consisting of Foreign Direct Investment (FDI) and foreign portfolio investment (FPI), is the largest component of the capital account. On a BoP basis, the net capital inflows declined to US$ 29.0 billion in H1FY23 from US$ 65.0 billion19 in H1FY22 primarily driven by the FPI outflow of US$ 14.6 billion in Q1FY23. Net FDI inflows at US$ 20.0 billion in H1FY23 were comparable with US$ 20.3 billion in H1FY22.
11.39 During April-September 2022, gross FDI inflows were US$ 39.3 billion as compared to US$ 42.5 billion a year ago. Computer Software and Hardware attracted the highest share of FDI equity inflow (23.4 per cent) followed by Services (15.4 per cent) and Trading (12.2 percent). In terms of FDI inflow, Singapore was the top investing country with a 37.0 per cent share, followed by Mauritius (12.1 per cent), UAE (11.0 per cent), and the USA (10.0 per cent).
11.40 Repercussions of the Russia-Ukraine conflict and aggressive monetary policy tightening by the US Fed escalated global financial market volatility leading to net outflow by FPIs in Q1FY23. However, FPI flows turned positive in Q2FY23. Overall, FPIs recorded a net outflow of US$ 2.5 billion during April-December 2022 as against an outflow of US$ 0.6 billion a year ago.
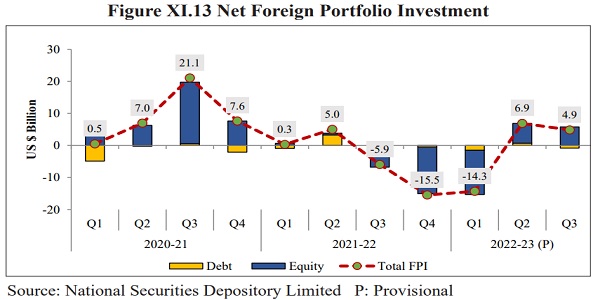
11.41Among other forms of capital flows, in H1FY23, banking capital reported higher net inflows of US$ 10.6 billion against US$ 4.4 billion during the same period of FY22. As global liquidity conditions tightened, demand for short-term trade credit rose during H1FY23, resulting in higher net short-term credit receipts of US$ 10.1 billion. Furthermore, with more repayments in comparison to fresh disbursals, external commercial borrowings (ECBs) to India recorded net outflows of US$ 3.0 billion in H1FY23 as against net inflows of US$ 5.0 billion a year ago.
Balance of Payments and Foreign Exchange Reserves
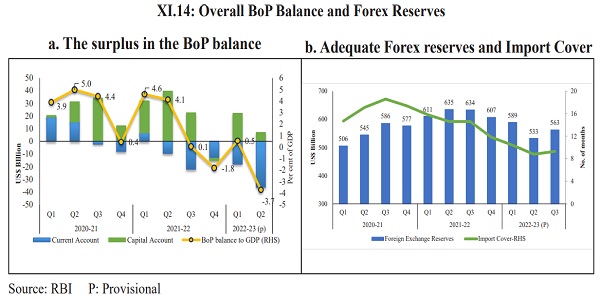
11.42 Overall, the adverse global economic situation placed India’s BoP under pressure in 2022. While the impact of a sharp rise in oil prices was discernible in the widening of the CAD, policy tightening by the US Fed and the strengthening of the US dollar led to FPI outflows. As a result, as the net financial inflows fell short of the CAD, there was a depletion of foreign exchange reserves on a BoP basis to the tune of US$ 25.8 billion in H1FY23 in contrast to an accretion of US$ 63.1 billion in H1FY22. But huge valuation losses (US$ 48.9 billion) contributed to the net depletion of US$ 74.6 billion of reserves in nominal terms during the period.
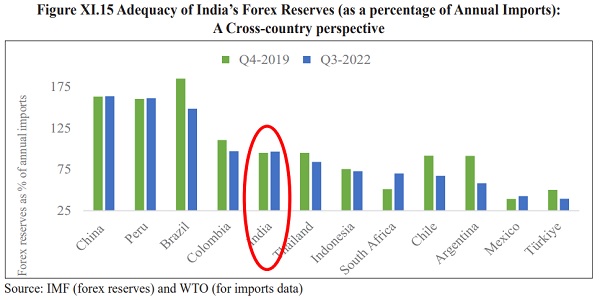
11.43 India’s foreign exchange reserves stood at US$ 532.7 billion as of end-September 2022, covering 8.8 months of imports. The reserves augmented to US$ 562.7 billion as of end-December 2022 covering 9.3 months of imports. As of end-November 2022, India was the sixth largest foreign exchange reserves holder in the world according to data compiled by the IMF. As seen from the graph, the import coverage of foreign currency reserves has declined since the pre-pandemic levels in most emerging market economies; however, that of India has increased from 95% in Q4 2019 to 96.5% in Q3 2022. Box XI.2 discusses some aspects of the literature on what constitutes adequate forex reserves for a country.
Box XI.2: Adequacy of foreign exchange reserves
How to assess what constituted an adequate level of Foreign Exchange Reserves (FER)? Are there some international benchmarks or thumb rules which can serve as a guide? What are the factors which a country should consider while determining its own threshold of “adequacy”? How best to ensure the liquidity of such reserves as against mere availability? This box attempts to answer these questions by drawing from the relevant literature and present an academic perspective.
FER is required for various purposes, such as to maintain the exchange rate within a certain range, or to maintain a certain level of exchange rate if the country follows a fixed exchange rate system; maintain liquidity and allow time to absorb shocks in situations where access to borrowing is curtailed or very costly. The optimal level of reserves empowers the government to maximise the welfare of the representative consumer, given the constraint of sudden stops in terms of debt rollover crisis. The drivers behind the accumulation of reserves have evolved over the years: initially for precautionary purposes until the early 2000s, followed by goals of monetary and exchange rate policies (Arslan Yavuz, et al 2019). Accordingly, the FERs of several countries have witnessed a rising trend, more so since the global financial crisis of 2008.
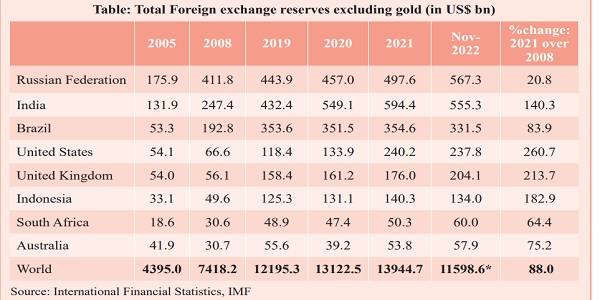
*Figure as of Sept 2022
This brings in the debate on adequacy of reserves. Conventionally, there are three measures of adequacy of reserves, viz. ratios of reserves to imports, to monetary aggregates, and measures of external debt (IMF, 2000). According to the traditional approach to determining the adequacy of reserves, the simple rule of thumb is three months of imports or full cover of short-term debt. As regards the former, there is little empirical support for whether the adequate coverage should be three months, as opposed to say two or six (IMF, 2011). The latter derives from the Guidotti–Greenspan¬IMF rule which states that a country’s reserves should equal short-term external debt (one-year or less maturity), suggesting a ratio of reserves-to-short term debt of one. The rationale is that countries should have enough reserves to cope with the withdrawal of short-term foreign capital. Then there are also money-based indicators of reserves which provide a measure of the potential for resident-based capital flight from the currency. The indicators used are the ratio of reserves to broad money or the ratio of reserves to base money which help in assessing reserve adequacy under fixed exchange rate regimes. Each of these indicators may, in themselves, not be adequate to assess the requirements of FERs for an economy and different measures may typically be used for different purposes.
The IMF (SM/00/65, 3/23/2000), noted the importance of short-term debt as a source of risk but cautioned against excessive reliance on a single indicator and pointed to the need to consider various potential sources of short-term demand for reserves. Further, IMF (SM/01/3 11, 10/16/2001) has noted the need to complement indicator-based analyses with stress-testing of the BoP. In addition, there are customised risk-based broader-based metrics tailor-made to capture sources of risk emanating from external liabilities (debt and equity) as well as current account variables (export earnings) and some measure of potential capital flight (broad money) (IMF, 2011). Adequacy should be considered against total resources available to meet shocks, a broader concept than the BoP-determined definition of reserve assets.
While reserves are imperative in both preventing crises situations and mitigating their impact, there is a cost involved in holding them and they are subject to diminishing returns. The costs borne by an economy for holding FER include the opportunity cost, in terms of the difference between domestic and foreign borrowing rates and loss due to the value reduction in the denominated FER. Rodrik (2006) examines the social cost of FERs and finds that the income loss to most developing countries amounts to close to one per cent of GDP.
Fukuda and Kon (2010) evaluate the macroeconomic impact of reserve accumulation and find evidence that an increase in FERs raises external debt outstanding but shortens debt maturity. Further, in the long-run, consumption declines, and exports, are promoted by encouraging a switch from the non-tradable sector to the tradable sector through higher investment and growth. Further, FERs could be inflationary through exchange rate effects (Lin, et al 2009) and moral hazard and incentive effects (Chitu, 2016).
Therefore, an economy should organise its reserves FER, in terms of the optimal size and currency composition, considering the benefits, costs, and impacts of holding them. Co-movement of the domestic currency with key currencies and the currency invoicing of trade (Ito, 2019); trade flows (trade invoicing), financial flows (share of debt service payments in a currency), and currency pegs (Eichengreen, 2000) are the dominant factors influencing the currency composition of FERs. Further, drawing from the field of finance, the Value at Risk (VaR) approach has also been employed to arrive at the optimal foreign exchange portfolio (Hung et al. (2008).
As briefly reviewed above, the rich literature on reserve adequacy presents very useful background information and empirical analysis for policy choices and likely outcomes.
REFERENCES
- Arslan, Yavuz and Cantú, Carlos (2019), “The size of foreign exchange reserves”, BIS Papers No 104.
- Chiou, J-S., Hung, J-C, and Hseu, M-M. (2008), “A VaR Investigation of Currency Composition in Foreign Exchange Reserves”, International Research Journal of Finance and Economics, 21, 76-92.
- Chițu. L (2016), “Reserve accumulation, inflation, and moral hazard: Evidence from a natural experiment”, Working Paper Series, No 1880, European Central Bank, January.
- Eichengreen, B and Mathiesan, D. J. (2000), “The Currency Composition of Foreign Exchange Reserves: Retrospect and Prospects”, IMF Working Papers, WP/00/13 1.
- Fukuda, S. I and Kon. Y (2010), “Macroeconomic Impacts of Foreign Exchange Reserve Accumulation: Theory and International Evidence”; ADBI Working Paper Series, No. 197, February.
- IMF (2000), “Debt- and Reserve-Related Indicators of External Vulnerability”, Policy, and Review Departments, March 23.
- IMF (2011), “Assessing Reserve Adequacy”, Monetary and Capital Markets, Research, and Strategy, Policy, and Review Departments.
- Ito, H and McCauley, R. N. (2019), “The currency composition of foreign exchange reserves”, Monetary and Economic Department, BIS Working Papers, No 828, December.
- Jeanne, O and Rancière, R (2006), “The Optimal Level of International Reserves for Emerging Market Countries: Formulas and Applications”, IMF Working Papers, WP/06/229.
- Lin, M. Y, and Wang, J. S (2009), “Foreign Exchange Reserves and Inflation: An Empirical Study of Five East Asian Economies”, The Empirical Economics Letters, 8(5): May.
- Rodrik, D. (2006), “The Social Cost of Foreign Exchange Reserves”, International Economic Journal, 20, 253-266.
Exchange Rates Moving in Tandem with Global Developments
11.44 The exchange rate of the Indian Rupee is market-determined as the RBI’s intervention in the foreign exchange market is mainly to contain instances of excessive volatility. On a financial year basis, i.e., from April to December 2022, the INR has depreciated against US$ by 8.3 per cent.20 Over the same period, the US dollar has appreciated by 4.4 per cent in terms of the US dollar index.21 This holds even on a calendar year basis, i.e., from January to December 2022, the INR has depreciated by 10.8 per cent whereas the US dollar has appreciated by 6.4 per cent. The Nominal Effective Exchange Rate (NEER) of the US dollar (27 economies) appreciated by 7.8 per cent in the calendar year 2022, up to December, while the NEER of India (64 economies) depreciated by 4.8 per cent. In other words, it is not that the INR has weakened, but it is the US dollar that has strengthened. No matter how many tweets are written against that observation, it is a fact. Several other currencies depreciated even more value against the US dollar than the INR (Refer Figure I.12 of Chapter I). Thus, the external value of INR vis-à-vis the US dollar has seen very orderly movements during the year since the onset of the current geopolitical crisis.
11.45 Further, the INR appreciated against select major currencies barring the US dollar. The average exchange rate of INR against the Pound Sterling appreciated by 6.7 per cent in April -December 2022 over April – December 2021. This rate of appreciation was 14.5 per cent with respect to the Japanese Yen and 6.4 per cent against the Euro.

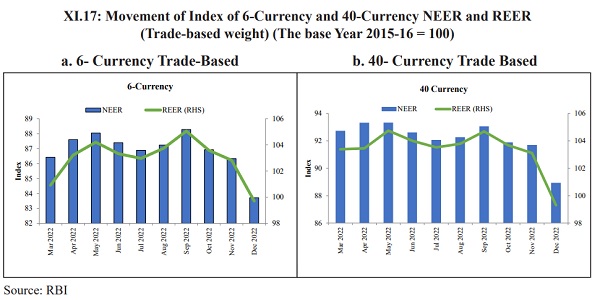
11.46 Cross-country comparisons of exchange rate movements are often made on an inflation-adjusted basis or what is called in real effective terms, viz. the Real Effective Exchange Rate (REER). On a financial year basis, i.e., between April 2022 and December 2022, the INR depreciated 3.4 per cent and 4.0 per cent measured in terms of 6-currency and 40-currency trade-weighted indices, respectively. Thus, even in real terms, the INR witnessed modest depreciation in the face of global spill overs.
11.47 In terms of the 6-currency NEER (trade-weighted), the rupee depreciated by 4.4 per cent in December 2022 over April 2022. Similarly, the rupee depreciated by 4.7 per cent in terms of 40-currency NEER22 (trade-weighted) in December 2022 over April 2022.
International Investment Position: A Reflection of India’s Financial Soundness
11.48 The international investment position (IIP) is a statistical statement that shows at a point in time the value and composition of (a) financial assets of residents of an economy that are claims on non-residents and gold bullion held as reserve assets, and (b) liabilities of residents of an economy to non-residents. The difference between an economy’s external financial assets and liabilities is the economy’s net IIP, which may be positive or negative.23 The Net IIP position determines whether a country is a net creditor or debtor nation by measuring the difference in its external assets and liabilities. These statistics serve as an indicator of a country’s financial condition and soundness. The Net IIP, along with the BoP transactions, reflects the domestic economy’s set of international accounts.
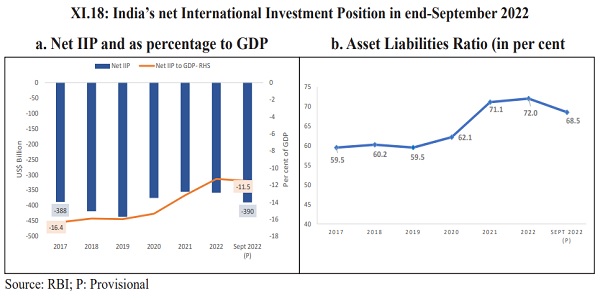
11.49 For India, as of end-September 2022, Indian residents’ overseas financial assets at US$ 847.5 billion were lower by US$ 73.0 billion or 7.9 per cent compared to the level as of end-March 2022, mainly due to the reduction in reserve assets even as trade credit and overseas direct investment recorded an increase. Reserve assets at US$ 532.7 billion, accounting for around 62.9 per cent of India’s international financial assets fell by 12.3 per cent over the same period.
11.50 International liabilities at US$ 1,237.1 billion as of end-September 2022 were lower by US$ 41.6 billion (3.2 per cent) as compared to the level as of end-March 2022. This fall was attributed primarily to direct investment (net) outflows, while variations in the exchange rate of the rupee vis-a-vis other currencies also had an impact on the change in liabilities when valued in US$ terms. The share of debt liabilities in total external liabilities was 50 per cent as of end-September 2022.
11.51 Thus, the net claims of non-residents on India, valued at US$ 389.6 billion as of end-September 2022, increased by US$ 31.4 billion over the level as of end-March 2022. India’s international financial assets covered 68.5 per cent of international financial liabilities as of end-September 2022.
Safe and Sound External Debt Situation
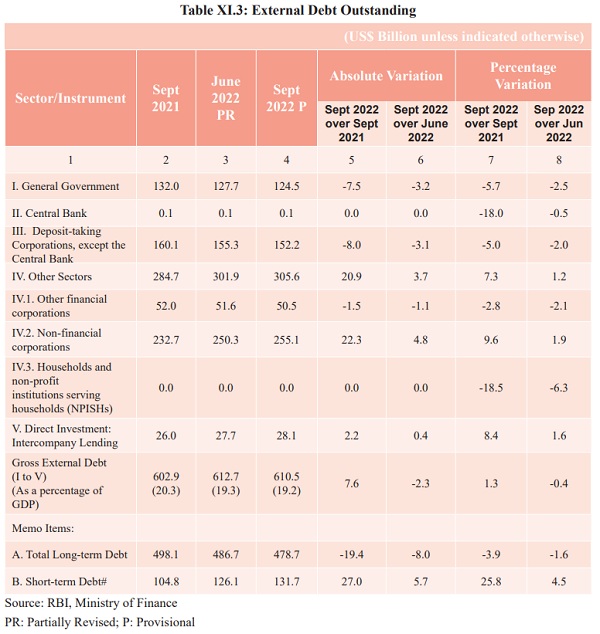
11.52 India’s external debt, at US$ 610.5 billion as of end-September 2022, grew by 1.3 per cent (US$ 7.6 billion) over US$ 602.9 billion as of end-September 2021. However, external debt as a ratio to GDP fell to 19.2 per cent as of end-September 2022 from 20.3 per cent a year ago. The literature documents that the optimal threshold for India’s external debt is around 23-24 per cent of GDP.24 Thus, India has the potential growth positive space as far as the external debt level is concerned. While testifying to the prudent management of India’s external debt, this contrasts with the external debt distress unfolding in many peer countries, post-covid.
11.53 The long-term debt was lower at US$ 478.7 billion as of end-September 2022 than US$ 498.1 billion a year ago with the share of long-term debt falling to 78.4 per cent from 82.8 per cent during the same period. On the other hand, the short-term debt at US$ 131.7 billion as of end-September 2022 was higher than US$ 104.8 billion as of end-September 2021. Accordingly, the share of short-term debt in total debt went up to 21.6 per cent from 17.4 per cent. In this context, it needs to be noted that about 97 per cent of short-term debt is in the form of trade credit to finance imports and hence the rise in short-term debt is stability-friendly. Further, while a major part of India’s external debt is denominated in the US dollar (55.5 per cent as at-September 2002), the Indian rupee-denominated component (30.2 per cent) occupies the second largest position, insulating the external debt from foreign currency risk, thereby augmenting stability friendly characteristics of the external debt.
11.54 As of end-September 2022, Sovereign External Debt (SED) amounted to US$ 124.5 billion, decreasing by 5.7 per cent over the level a year ago. Non-SED, estimated at US$ 486.0 billion as of end-September 2022, posted a growth of 3.2 per cent over the level a year ago. Deposit-taking Corporations (except the Central Bank) and non-financial corporations accounted for the bulk of non-SED.
11.55 The Ministry of Finance’s “India’s External Debt: A Status Report 2019-20”, provides details of the evolution of India’s external debt.25 A discernible trend in the rise in external debt of the non-sovereign sector over the SED is seen since FY99. Accordingly, typically, in a normal year, it is the relative movements in non-SED that influences the dynamics of the country’s external debt. In the pandemic year of FY21, it was the growth in SED that accounted for a larger share of the overall growth of foreign debt due to Covid- 19 loans from multilateral institutions. As the pandemic receded and normalcy was restored with the revival of the economy, the usual dynamics of India’s external debt returned as the growth in non-SED constituted as much as 4.7 percentage points out of the overall external debt growth of 8.0 per cent at end-March 2022. However, the quarter ending September 2022, yet again witnessed deviation from the usual dynamics. It was the relative growth in SED (akin to the pandemic year) that influenced the overall external debt dynamics on the back decline in external assistance as well as other government debt which includes FPI investment in G-Sec and SDR. Out of the overall decline in India’s external debt by 0.4 per cent, the fall in the SED was 0.5 per cent, while the rise in non-SED was 0.2 per cent.
11.56 India’s external debt vulnerability indicators continued to be benign. External debt as a ratio to GDP at 19.2 per cent as of end-September 2022 was lower than 19.9 per cent as of end-March 2022. The debt service ratio (principal repayments plus interest payments) stood at 5.0 per cent vis-à-vis 5.2 per cent as of end-March 2022.
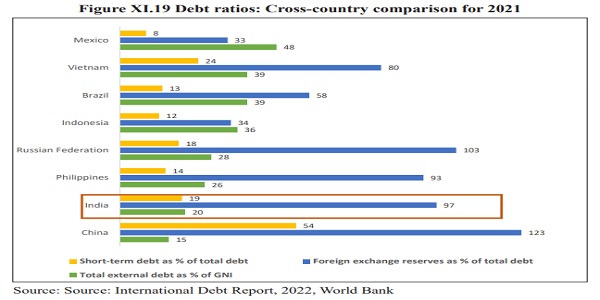
11.57 Comparing various debt vulnerability indicators of India with peer countries for 2021 informs that the country is in a better position in terms of relatively low levels of total debt as a percentage of Gross National Income (GNI) and short-term debt as a percentage of total debt. The current stock of external debt is well shielded by the comfortable level of foreign exchange reserves.

Outlook for the External Sector: Cautious Amidst Global Headwinds
11.58 Slowing global demand is weighing on India’s merchandise exports. The empirical literature documents that global growth exerts a strong statistically and economically significant impact on India’s real exports, though the impact has reduced over the years.26 As noted earlier (para 11.2), global growth is forecast to slow down in 2022 and 2023 as per IMF estimates. This is the weakest growth profile since 2001 except for the global financial crisis and the acute phase of the Covid-19 pandemic.
11.59 Thus, the export outlook may remain flat in the coming year if global growth does not pick up in 2023, as indicated by many forecasts. In such cases, product basket and destination diversification which India is taking through FTAs would be useful to enhance trade opportunities. At times when the base (global growth and global trade) is not growing, export growth will have to come predominantly through market share gains. In turn, that comes from the focus on efficiency, productivity, technology, and innovation. That game has to be lifted. Governments can try and open markets through FTAs. But, to take advantage of that is in the hands of private sector participants.
11.60 India is facing competition from South Asian countries in a few of its export competitive products. In the textile sector, Bangladesh and Vietnam are seen to be expanding their exports globally, in recent years. Further, Vietnam has been able to expand its exports in machinery and equipment; computers, electronic products, certain agriculture products etc. However, given the benefits of the lower average age of the working population along with the advantage of economies of scale, India has the potential to cater to the global demand for several products in a cost-effective manner.
11.61 On the imports side, notwithstanding uncertainty surrounding the outlook on global crude oil prices, the recent softening in its prices augurs well for India’s POL imports. However, non-oil, non-gold imports, which are growth-sensitive, may not witness a significant slowdown as Indian growth continues to be resilient.
11.62 While recognising the potential adverse developments, it is important to take cognisance of innate buffers to India’s external sector. India’s export of services, primarily contributed by software, business, and travel services, while remaining robust during the year so far, embodies a greater degree of resilience. India is cementing its position as the top remittance receiver in the world, with inward remittances projected to be at record levels during 2022. Accordingly, a large surplus under services and remittances would cushion the widening trade deficit. Consolidating an increasing share of non-debt flows in financing CAD over the years, net FDI flows remained robust during the current year, while the net FPI inflows turned positive in recent months. Thus, the CAD would be within manageable limits and eminently financeable. Above all, the forex reserves remained comfortable at US$ 562.7 billion as of end-December 2022, covering 9.3 months of imports. The stock of India’s external debt has been prudently managed.
11.63 From a cross-country perspective too, India’s external sector has fared relatively better and hence positioned relatively stronger to face the evolving adverse global scenario as evidenced by the Indian rupee outperforming most EME currencies, comfortable import cover and moderate CAD. India’s external debt vulnerability indicators are benign by international standards. To sum up, while India’s external sector faces challenges, it is performing relatively better as compared to many of its peers as it has inbuilt shock absorbers to weather them.
Notes:
1 World Economic Outlook Report, IMF, October 2022.
2 “South Asia’s Current Macroeconomic Challenges and Policy Priorities”, Keynote Address by Shri Shaktikanta Das, Governor, Reserve Bank of India –6 January 2023 – at the high-level Conference co-organised by IMF Asia and Pacific Department and IMF South Asia Regional Training and Technical Assistance Centre, New Delhi
3 Trade is the sum of exports and imports of goods and services measured as a share of GDP.
4 UNCTAD, Trade and Development Report 2022, Development prospects in a fractured world: Global disorder and regional responses, October 2022.
5 WTO’s press release, International Trade Statistics, 5 October 2022.
6 The WTO has developed a set of indicators to provide “real-time” information on trends in world trade. The Goods Trade Barometer is a leading indicator that signals changes in world trade growth two to three months ahead of merchandise trade volume statistics. Values greater than
100 signal above-trend expansion while values less than 100 indicate below-trend growth.
7 WTO’s press release, International Trade Statistics, 5 October 2022.
8 NITI Aayog in partnership with the Institute of Competitiveness has prepared an Export Preparedness Index to identify challenges and oppor¬tunities; enhance the effectiveness of government policies; and encourage a facilitative regulatory framework. The structure of the EPI includes 4 pillars –Policy; Business Ecosystem; Export Ecosystem; Export Performance – and 11 sub-pillars –Export Promotion Policy; Institutional Framework; Business Environment; Infrastructure; Transport Connectivity; Access to Finance; Export Infrastructure; Trade Support; R&D Infrastructure; Export Diversification; and Growth Orientation.
9A Vostro account is an account that a domestic bank holds for a foreign bank in the domestic bank’s currency, i.e., Rupee. Such accounts enable domestic banks to provide international banking services to their clients who have global banking needs.
10 Keynote address delivered by Shri T Rabi Sankar, Deputy Governor, RBI at the Annual Day event of the Foreign Exchange Dealers Associa-tion of India (FEDAI) on 20 October 2022 in Mumbai.
11Patra, M. D (2022): India@75, RBI Bulletin, August, pp 13-34.
12 For an understanding of various types of trade agreements that India has entered into, may refer to: https://www.tpci.in/research_report/types¬of-trade-agreements/.
13 RTAs, as per WTO rules, are any reciprocal trade agreement between two or more partners, not necessarily belonging to the same region.
14 The MFN clause refers to a special trading status given by one country to another that gets applied to all the other members of the WTO.
15 FTAs generally have phase-in periods in which existing trade barriers are phased out over time. This is generally done so that producers in the importing country can adjust to import competition. This typically occurs over 10 to 15 years after the ratification of the FTA.
16 Rules of origin are the criteria needed to determine the national source of a product. Their importance is derived from the fact that duties and restrictions in several cases depend upon the source of imports.
17 World Bank, Migration and Development Brief 37, November 2022
18 Fifth Round of the Survey on Remittances for the year 2020–21, Reserve Bank of India.
19 This included an additional allocation of SDRs of US$ 17.9 bn. in Q2FY22.
20 Change in Monthly average exchange rate in December 2022 over April 2022.
21 The U.S. dollar index (US$X) is a measure of the value of the U.S. dollar relative to a basket of foreign currencies. These are: the Euro, Swiss franc, Japanese yen, Canadian dollar, British pound, and Swedish krona.
22 The indices NEER and REER are used as indicators of external competitiveness. NEER is the weighted average of bilateral nominal exchange rates of the home currency in terms of foreign currencies, weights being based on the average of India’s bilateral trade (exports plus imports) with countries/regions represented by the 6/40 currencies during the preceding three years. The REER, defined as a weighted average of nomi¬nal exchange rates adjusted for relative price differential between the domestic and foreign countries, relates to the PPP hypothesis.
23 IMF, Balance of Payments and International Investment Position Manual, sixth edition (BPM6),
24 Gopinath, Tulasi and Rajeshwar. S, Tangjam (2022): Growth Maximising External Debt of India, RBI, Bulletin, May, P 73-86
25 https://dea.gov.in/external-debt; Refer Box 2.1
26 Chinoy, S. Z and Jain, T (2018): What Drives India’s Exports and What Explains the Recent Slowdown? New Evidence and Policy
Implications; NCAER, Policy Forum; https://www.ncaer.org/wp-content/uploads/2022/09/a4.pdf


