[T]he ideas of economists and political philosophers, both when they are right and when they are wrong, are more powerful than is commonly understood. Indeed the world is ruled by little else.”
– John Maynard Keynes
Since about 1980, India’s growth performance has been robust, especially for a democracy. This has been backed up by policy reforms that have made India more open to flows of goods and capital and have reduced the size of the public sector, both in micro-efficiency and macro-fiscal terms. Yet, there are serious challenges that might impede further rapid progress which emanate in part from the fact that India started out as a poor democracy with deep social fissures (a “precocious, cleavaged” democracy). These long – standing challenges can be classified as an ambivalence about property rights and the private sector, deficiencies in state capacity, especially in delivering essential services, and inefficient redistribution. Meeting these challenges is not just a matter of overcoming vested interests; it may also require broader societal shifts in ideas and narratives.
1. IntroductIon
2.1 Painting with a broad-brush, the economic vision animating Indian policy can be divided into two phases. First came nearly half a century of socialism, where the guiding principles were economic nationalism and protectionism. During those years, the public sector occupied the commanding heights and the government intruded into even the most micro-decisions of private firms: their investing, producing, and trading. This framework was rejected after 1991 (Bhagwati and Panagariya, 2013). But even now it remains unclear as to what has replaced it. One might ask: what exactly has been repudiated, to what extent, and how? In short, what is the vision? This is a question not for any one government or party but for the broader Indian ecosphere of ideas.
2.2 At one level, the answer to this question might seem obvious. India has replaced its erstwhile socialist vision with something resembling the “Washington Consensus”: open trade, open capital, and reliance on the private sector – essentially the same development model that has been tried and proven successful in most countries of Eastern Asia1. Reforms along these lines have been adopted by every Indian government over the past quarter century. For example, in the last two years, the current government has institutionalized a commitment to low inflation in the new monetary policy framework agreement (Parussini 2016). There has also been a great effort to reduce the costs of doing business and create an environment friendly to investment, both domestic and foreign. And in the last six months (as detailed in Chapter 1), the government has secured passage of major measures such as the Aadhaar Bill, the Bankruptcy Code, and the GST constitutional amendment.
2.3 The result of all these reforms over the past 25 years has been a remarkable transformation of India from a largely closed and listless economy to the open and thriving economy that we see today. The country’s progress is not only qualitative. It is also measurable. Consider, for example, four standard measures: openness to trade; openness to foreign capital; the extent to which public sector enterprises dominate commercial activities; and the share of government expenditure in overall spending.
2.4 Start with the standard measure of openness, the trade-to-GDP ratio (exports plus imports expressed as a share of gross domestic product). A fundamental truth of geography is that large countries tend to trade less than small countries. Being large makes the benefits of trading with the outside world very low relative to trading within the country. The opposite is true for small countries: lacking an internal market, their benefits of trading with the world are relatively large and hence they tend to have higher trade-to-GDP ratios.
2.5 Figure 1(a) plots, for several countries, their overall trade-to-GDP ratio (on the vertical axis) against their size (measured in terms of the log of population on the horizontal axis). The line shows the average relationship between trade outcomes and country size. That line is downward-sloping, confirming the geography-based intuition that large countries trade less. For example, the large countries such as China, India, Brazil, the United States, and Japan are all in the lower right-hand corner with low trade (below 50-55 per cent) ratios. But India is “above the line”, meaning that it trades far more than would be expected for a country of its size – a stark turnaround from the pre-1991 situation when India was an under-trader.
Figure 1. Trade (of Goods and Services) to GDP Ratio
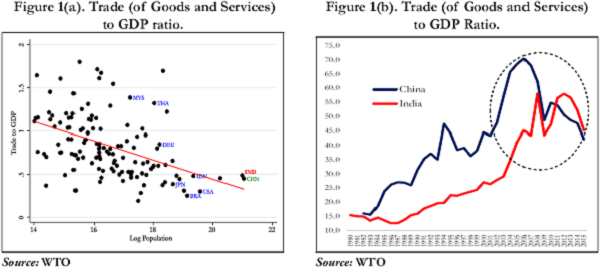
2.6 One can see India’s transformation even more starkly by comparing the evolution of its trade-GDP ratio with that of China over the past three decades (see figure 1(b)). India’s ratio has been rising sharply, particularly over the decade to 2012, when it doubled to 53 per cent; the recovery from the global financial crisis in 2008 was also swift. As a result, India’s ratio now surpasses China which is remarkable2.
2.7 The next two figures plot India’s foreign capital flows as a share of GDP. Figure 2 (a) reveals that despite significant capital controls, India’s net inflows are, in fact, quite normal compared with other emerging economies. Figure 2(b) shows that India’s FDI has risen sharply over time. In fact, in the most recent year, FDI is running at an annual rate of $75 billion, which is not far short of the amounts that China was receiving at the height of its growth boom in the mid-2000s.
2.8 Consider next the size of public sector enterprises. In popular perception, when compared to other countries, India’s public sector undertakings (PSU) are exceptionally large. That may have been true in the past. However, Figure 3 shows India is now squarely in the middle of the emerging market pack. This is partly because India has allowed the private sector entry into, amongst others, civil aviation, telecommunications, and financial services. These have all served to reduce the share of the public sector even if there has not been much exit of the PSU enterprises themselves.
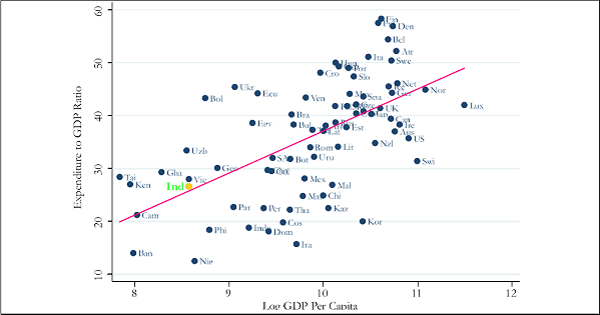
2.9 Finally, consider the size of government. India is often accused of having a bloated government sector. But when the size of government expenditure for a group of countries is plotted against their per capita GDP, India sits on the regression line, indicating that it spends as much as can be expected given its level of development (Figure 4).
2.10 In sum, the standard measures suggest that India is now a “normal” emerging market, pursuing the standard Asian development path. It is open to foreign trade and foreign capital, where the government is not overbearing, either in a micro, entrepreneurship sense or in a macro, fiscal sense.
Figure 2. Openness to Capital
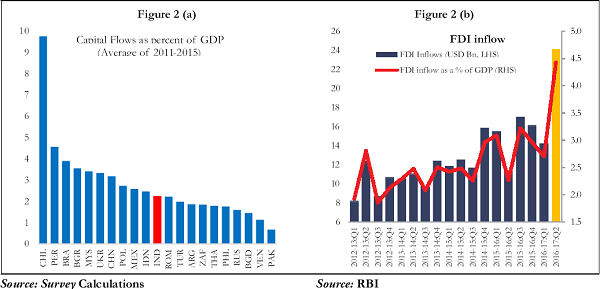
Figure 3. Size of Government (Micro) – PSU spending as a share of GNI
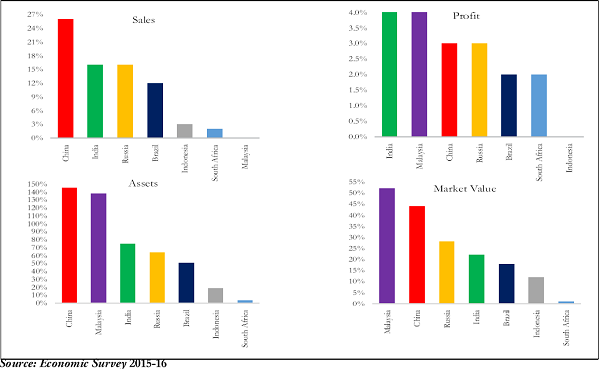
Figure 4. Size of Government (Macro) – Government
Expenditure vs GDP per capita
2.11 And India is normal in one final, critical way. As in other emerging markets, the pursuit of the standard development path has paid off in terms of growth. Taking a long view, and recognizing that India’s reforms actually started around 1980 (Rodrik and Subramanian, 2004), the first order fact is that India has grown at about 4.5 percent per capita for thirty seven years, an impressive achievement.
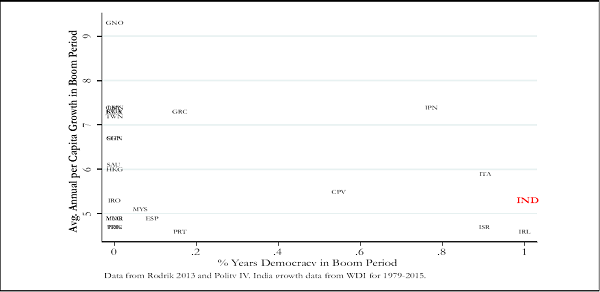
2.12 This achievement is particularly remarkable because it has been achieved under a fully democratic political system.3 The Indian model of being a perennial democracy after acquiring independence is rare in post-war economic history – and successes are rarely democracies. Figure 5 plots on the y-axis average annual per capita GDP growth during country’s boom periods (from Rodrik, 2014), with India’s defined since 1979. The x-axis represents the percent of years during the boom period that the country was democratic. The only other countries that have grown as rapidly and been democratic for a comparable proportion of the boom are Italy, Japan, Israel, and Ireland. Other countries that have grown faster for as long have tended to be oil exporters, East Asian countries, and some that recovered after World War II.
II. the road toBetraversed
2.13 In view of all this evidence, it seems curmudgeonly then to question India’s reformist and market oriented credentials. Yet, there remains a niggling sense that India is not quite what it appears to be – that, despite all the data, it is not yet following the standard development model.
2.14 In what ways is India different? Three lingering features capture the doubt that it has not yet traversed the distance toward some vague and unspecifiable end-point that could be described as desirable or optimal. First, there has been a hesitancy to embrace the private sector and to unambiguously protect property rights, combined with continued reliance on the state to undertake activities that are more appropriately left to the private sector (Kochhar et al. 2006). Second, state capacity has remained weak (Pritchett 2009), as can be seen from poor delivery of essential services (Rice and Patrick 2008). And third, redistribution has been simultaneously extensive and inefficient (Kohli 2012).
Figure 5. Performance of a Precocious Democracy
 A. Ambivalence about private sector and property rights
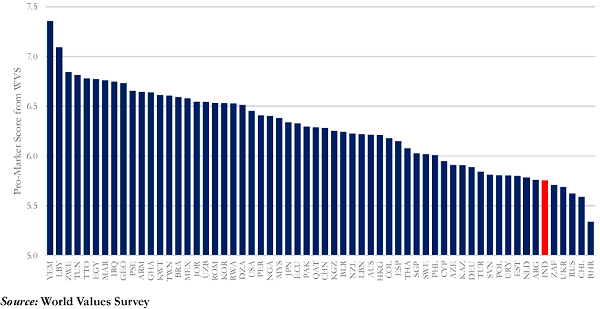
2.15 All states, all societies, have some ambivalence toward the private sector. After all, the basic objective of private enterprises – maximizing profits – does not always coincide with broader social concerns, such as the public’s sense of fairness. But the ambivalence in India seems greater than elsewhere. Figure 6 ranks countries on the attitude of the people toward the private sector in a select group of countries.4 It appears that that India has distinctly anti-market beliefs relative to others, even compared to peers with similarly low initial GDP per capita levels.
2.16 The symptoms of this ambivalence toward the private sector manifest in multiple ways. The most well-known example is the difficulty of privatizing public enterprises, even for firms where economists have made strong arguments that they belong in the private sector. Consider the civil aviation sector. Defying history, there is still the commitment to make the perennially unprofitable public sector airline “world class.” Recently, airport privatization has taken the form of awarding management contracts rather than change in ownership. Moreover, policy reform in the sector has been animated as much by an interventionist as liberalizing spirit, reflected for example in restrictions on pricing.
Figure 6. Global attitudes to the private sector
2.17 A similar spirit pervades the policy approach to the banking sector. Discussion of disinvesting the government’s majority stake in the public sector banks is often difficult in part because of the view that they are legitimate instruments for the state to allocate and redirect resources.
2.18 Meanwhile, in the fertilizer sector, rife with distortions, public policy finds it easier to rehabilitate public sector plants than to facilitate the exit of egregiously inefficient ones.
2.19 Beyond a reluctance to privatize, the ambivalence towards the private sector is manifest in many other ways. The agriculture sector is entwined in regulation, a living legacy of the era of socialism. While progress has been made in the last two years, producers in many states are still required by the Agricultural Produce Marketing Act to sell only to specified middlemen in authorized markets (mandis). And when this system nonetheless generates price increases deemed to be excessive, the Essential Commodities Act is invoked to impose stock limits and controls on trade that are typically pro cyclical, thereby exacerbating the problem.5
2.20 A similar legacy from the past circumscribes property rights. Initially the right to property was inscribed as a “fundamental right” in the Constitution. But during the socialist era the 44th Amendment removed Articles 19 (1) (f) and Article 31 and replaced them with Article 300-A, thereby downgrading property to that of a “legal right”. The ramifications of this decision continue to be felt to this day, in such issues as retrospective taxation. The government has made clear its commitment not to act retroactively on tax and other issues. But the legacy issues of retroactive taxation remain mired in litigation, with uncertain prospects for early resolution. Evidently, it seems politically difficult to uphold a widely shared—and judicially endorsed—principle against expropriation and retroactivity because of the fear of being seen as favouring the private sector, especially the foreign private sector. This is true in a number of recent cases, including Vodafone and Monsanto.
2.21 The wariness does not just extend to the foreign private sector. The twin balance sheet problem—in the corporate and banking sectors (as detailed in Chapter 4) –remains a millstone around the economy’s neck, casting a pall over private investment and hence aggregate growth. One important reason this problem has not been resolved in the many years since it emerged in 2010 is the political difficulty in being seen as favoring the private sector, a problem which will necessarily arise in cases where some private sector debts have to be forgiven.
2.22 In each of the examples above, there may be valid reason for status quo but the overall pattern that emerges is unmistakable.
B. State capacity
2.23 A second distinctive feature of the Indian economic model is the weakness of state capacity, especially in delivering essential services such as health and education (Mangla 2015; Deaton 2013). Of course, nearly all emerging markets started off with weak state capacity at independence. But as their economies developed and prospered, state capacity improved, often at an even faster rate than the overall economy. In India, by contrast, this process has not occurred. Fukuyama (2013) argues that the Indian state has low capacity, with high levels of corruption, cientelism, rules and red tape.
2.24 The deepest puzzle here is the following: while competitive federalism has been a powerful agent of change in relation to attracting investment and talent (the Tata Nano car being the best example) it has been less evident in relation to essential service delivery. There have, of course, been important exceptions such as the improvement of the PDS in Chhattisgarh and Bihar, the incentivizing of agriculture in Madhya Pradesh, the kerosene-free drive in Haryana, power sector reforms in Gujarat which improved delivery and cost-recovery and the efficiency of social programs in Tamil Nadu. However, on health and education in particular, there are insufficient instances of good models that can travel widely within India and are seen as attractive political opportunities. To the contrary, at the level of the states, competitive populism (with few goods and services deemed unworthy of being handed out free) is more in evidence than competitive service delivery.
2.25 Aside from inhibiting service delivery, the weakness of state capacity has created another problem. Policy-making in certain areas has been heavily constrained, as a way of ensuring that decisions do not favour particular interests. The result is twofold.
2.26 First, there is now adherence to strict rules—for example auctions of all public assets—that may not necessarily be optimal public policy. In telecommunications, the judicially imposed requirement for transparency and auctioning, while responding importantly and appropriately to the previous experience of corruption, has created a public policy dilemma. In some cases, it may be socially optimal to sell spectrum at lower-than-auction prices because of the sizable externalities stemming from increased spread of telecommunications services. But the understandable distrust of discretion means that methods other than auctions could be perceived as favouring particular parties.
2.27 Second, there is abundant caution in bureaucratic decision-making, which favours the status quo. In the case of the twin balance sheet problem mentioned above, it is well-known that senior managers in public sector banks are reluctant to take decisions to write down loans for fear of being seen as favouring corporate interests and hence becoming the target of the referee institutions, the so-called “4 Cs”: courts, CVC (Central Vigilance Commission), CBI (Central Bureau of Investigation) and CAG (Comptroller and Auditor General). This encourages ever-greening of loans, thereby postponing a resolution of the problem.
C. Inefficient redistribution
2.28 Related to this is the third distinctive aspect of the Indian development model. All countries redistribute and must do so. The question is how effective this is and must be.
2.29 Redistribution by the government is far from efficient in targeting the poor. Chapter 9 evaluates the effectiveness of existing programs to help the poor, through subsidies and through government programs such as MGNREGS (Mahatma Gandhi Rural Employment Guarantee Scheme), SSA (Sarva Shiksha Abhiyaan), ICDS (Integrated Child Development Scheme), etc. It finds that welfare spending suffers from considerable misallocation: as the pair of charts in Figure 7 show, the districts with the most poor (shaded in red in Figure 7 (a))
Figure 7. Misallocation: Poorer districts get lower share of
spending/allocation on schemes
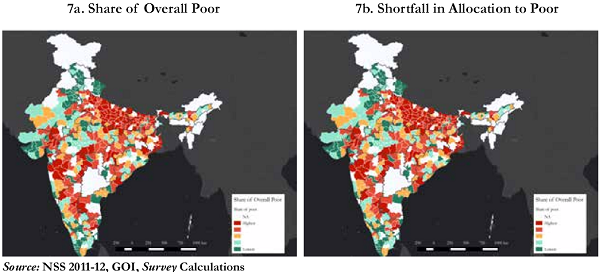
suffer from the greatest shortfall of funds (also shaded in red in Figure 7 (a)). This leads to: exclusion errors (the deserving poor not receiving benefits), inclusion errors (the non-poor receiving a large share of benefits) and leakages (with benefits being siphoned off due to corruption and inefficiency).
2.30 Over the past two years, the government has made considerable progress toward reducing subsidies, especially related to petroleum products. As Chapter 1 shows, not only have subsidies been eliminated in two out of four products, there is effectively a carbon tax, which is amongst the highest in the world.
2.31 However, even on subsidyreform, while technology has been the main instrument for addressing the leakage problem (and the pilots for direct benefit transfer in fertilizer represent a very important new direction in this regard), prices facing consumers in many sectors remain largely unchanged.
2.32 While strictly not an instrument of redistribution, even the design of the Goods and Services Tax (GST) reveals the underlying tensions. On the GST, the political pressures from the states to keep rates low and simple—resulting in an efficient and effective GST—were minimal. Apart from the general desire to ensure that the future structure of rates would mimic the complicated status quo, much of the focus was on ensuring that rates on essentials were kept low and on luxuries kept sufficiently high with insufficient concern for the implied consequences for efficiency and simplification. The lack of such pressures especially from the states was surprising since they were guaranteed compensation by the Centre. Evidently, even a dream combination of being able to trumpet low taxes without suffering revenue losses was not considered politically attractive.
III. PossIBle exPlanatIons
2.33 What explains these three distinctive features of the Indian development model? Central to understanding India’s economic vision is the fact that it has followed a unique pathway to economic success, what might be called “Precocious, Cleavaged India”.
2.34 Historically, economic success has followed one of two pathways. Today’s advanced economies achieved their current status over two centuries in which economic and political development progressed slowly but steadily. They did not begin with universal franchise. Voting rights, narrow and restricted to begin with, expanded slowly over time, a process that helped fiscal and economic development by limiting the initial demands on the state during the period when its capacity was weak (Acemoglu and Robinson, 2013; North and Weingast 1989; Saint-Paul and Verdier 1993).6
2.35 The second set of accelerated economic successes mostly in East Asia began authoritarian, explicitly (Korea, China) or de facto (Singapore, Thailand, Taiwan), and gave way to political transformation only after a degree of economic success was achieved. Explicit authoritarianism came in three flavours: military (Korea), party (China), or individual dictatorship (Indonesia).
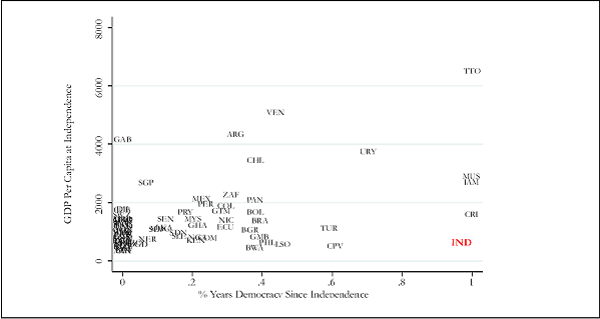
2.36 India, on the other hand, has attempted economic development while also granting universal franchise from the very beginning. Figure 8, which plots on the x-axis the fraction of years since independence that a country has been democratic and the income level at independence on the y-axis, reveals how rare India’s experience is. India is amongst a handful of countries—Botswana, Mauritius, Jamaica, Trinidad and Tobago, and Costa Rica—which are perennial democracies (those on the right hand side).
2.37 Even rarer, India, at independence, was a very poor democracy.7 In the figure, India is close to the bottom, indicating that it was the poorest democracy – in fact, one of the poorest nations, regardless of political system, with a per capita GDP of just $617 measured in purchasing power parity prices (PPP -1990 prices, Maddison).
Figure 8. Precocious Democracy
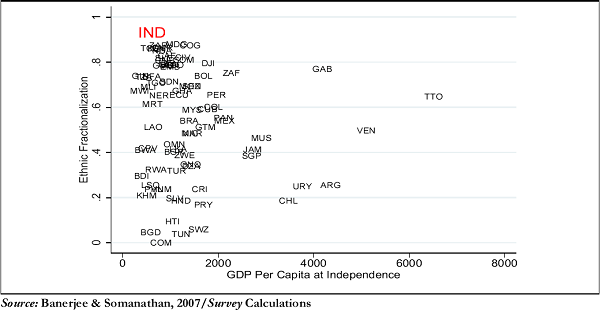
2.38 At the same time, India was also a highly cleavaged society. Historians have remarked how it has many more axes of cleavage than other countries: language and scripts, religion, region, caste, gender, and class (Guha 2016). Measured by ethno –linguistic fractionalization alone, India is similar to other countries (Easterly and Levine, 1997).8 But if caste is also taken into account (based on Banerjee and Somanathan, 2007), India stands out. In Figure 9, India is a clear outlier in the northwest corner of the plot, indicating both high levels of poverty and deep social fissures.
2.39 A precocious, cleavaged democracy that starts out poor will almost certainly distrust the private sector. Reinforcing this notion was the prevailing intellectual zeitgeist of socialism. The founders of India wanted to “build the country” by developing industry that would make India economically, as well as politically, independent. The private sector had conspicuously failed to do this under colonial rule, not only in India but in every other newly independent nation, giving rise to severe doubts as to whether it could ever do so. In contrast, the example of the Soviet Union, which had transformed itself from an agricultural nation to an industrial powerhouse in a few short decades, suggested that rapid development was indeed possible, if the state would only take control of the commanding heights of the economy and direct resources into priority areas.
2.40 Of course, while India adopted planning and a large role for the state sector, it never abolished the private sector unlike the Soviet Union. Instead, it tried to control private businesses through licensing and permits. Paradoxically, however, this only further discredited the private sector, because the more the state imposed controls, the more the private sector incumbents were seen as thriving because of the controls, earning society’s opprobrium in the process.
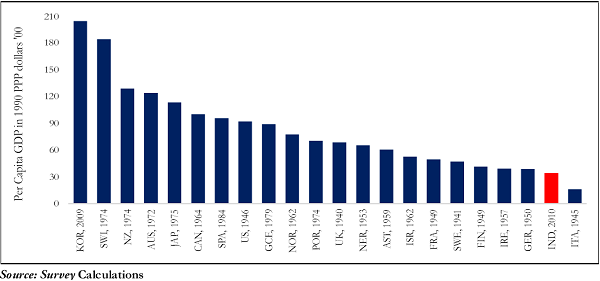
Figure 9. Precocious and Cleavaged India
2.41 Another important implication of India’s precocious, cleavaged democracy is that India had to redistribute early in the development process, when its state capacity was particularly weak. Figure 10 conveys a sense of how challenged Indian state capacity was in a comparative sense. It compares the income levels of different countries that had to spend what India does today, in percent of GDP. Typically, this occurred fairly late in the development process, when these countries had built up state capacity. For example, South Korea spent at a per capita GDP level of close to $20,000 what India spends today at a per capita GDP level of $5,000. Finally, given the pressing need to redistribute, India did not invest sufficiently in human capital – for instance, public spending on health was an un unusually low 0.22 per cent of the GDP in 1950-51 (MoHFW, Government of India, 2005). This has risen to a little over 1 per cent today, but well below the world average of 5.99 per cent (World Bank, 2014).
2.42 A poor country with weak state capacity like India when confronted with the pressure to redistribute had necessarily to redistribute inefficiently, using blunt and leaky instruments. The luxury of effectively targeted programs was not an option in 1950 or 1960 or even 1990.
2.43 All this explains why such policy interventions began. But this cannot fully explain why such inefficient redistribution persists because, after all, other countries have graduated toward less inefficient forms of redistribution. A partial explanation is the difficulty of exit. Exit is difficult everywhere but it can be especially difficult in a poor, cleavaged democracy dominated by vested interests, weak institutions and an ideology that favours redistribution over investments (discussed in detail in Chapter 2 of the Economic Survey 20 15-16, Volume I).
2.44 Another pathology results from this. The history of Europe and the US suggests that typically, states provide essential services (physical security, health, education, infrastructure, etc.) first before they take on their redistribution role. That sequencing is not accidental. Unless the middle class in society perceives that it derives some benefits from the state, it will be unwilling to finance redistribution. In other words, the legitimacy to redistribute is earned through a demonstrated record of effectiveness in delivering essential services.
Figure 10. Early Redistribution
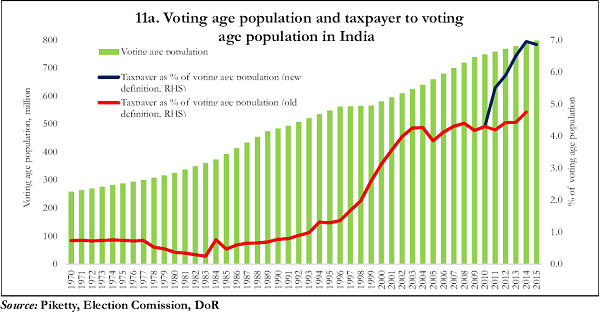
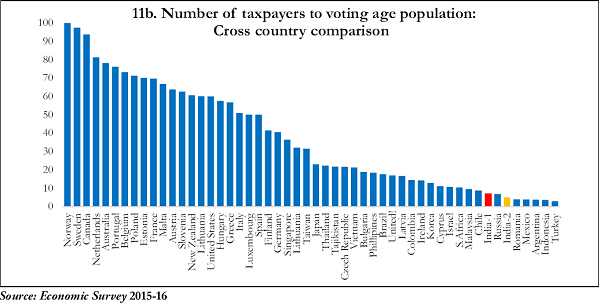
2.45 A corollary is that if the state’s role is predominantly redistribution, the middle class will seek—in Professor Albert Hirschman’s famous terminology—to exit from the state (Hirschman 1978). So, a precocious cleavaged democracy is almost destined to succumb to this pathology. One sign of exit is fewer taxpayers. This is abundantly evident in India. Figure 11 shows how few India’s income taxpayers number relative to the voting age population, especially when compared to other countries, and how slowly this ratio has risen over time.
2.46 By reducing the pressure on the state, middle class exit will shrivel it, eroding its legitimacy further, leading to more exit and so on. A state that is forced into inefficient redistribution, risks being trapped in a self-sustaining spiral of inefficient redistribution, reduced legitimacy, reduced resources, poor human capital investments, weak capacity and so on.
Figure 11. India’s low tax base9
Iv. conclusIon
2.47 India has come a long way in terms of economic performance and reforms. But there is still a journey ahead to achieve both dynamism and social justice. One tentative conclusion is that completing this journey will require a further evolution in the underlying economic vision across the political spectrum.
2.48 The experience, thus far, of demonetization is instructive. In one perspective, demonetization has been a redistributive device to transfer illicit wealth from the rich to the rest, via the government. In the short run at least, the costs are being borne to a great extent by those in the informal/cash-intensive sectors that tend to be less well-off than the rich. In one sense, this could be thought of as inefficient redistribution. So, if, subsidies have been an inefficient way of redistributing toward the poor, demonetization could be seen as an inefficient way of redistributing away from the rich.
2.49 Yet, at least so far, demonetization has commanded popular support, including and especially from those—the relatively less well affluent—who have borne much of the short term costs.10 The resonance of demonetization stems from the sense that there is not a level playing field and that some—the rich—gain from, and game, the system in ways that are perceived to be unfair and illegitimate.
2.50 There are lessons here for inefficient redistribution, and the legitimacy of the private sector and the state that may prove crucial as India moves along on the next stage of its economic journey. One such is that further reforms are not just a matter of overcoming vested interests that obstruct them. Broader societal shifts in underlying ideas and vision will be critical.
2.51 Ideas rule.
References
1 Acemoglu, Daron, and James A. Robinson. “Economics versus politics: Pitfalls of policy advice.” The Journal of Economic Perspectives 27.2 (2013): 173-192.
2 Banerjee, Abhijit, and Rohini Somanathan. “The political economy of public goods: Some evidence from India.” Journal of Development Economics 82.2 (2007): 287-314.
3 Basu, Kaushik. “Economic Development, Importance of Institutions in and Social Aspects of.”, Encyclopedia of India, Thomson Gale.
4. Bhagwati, Jagdish, and Arvind Panagariya. Why growth matters: How economic growth in India reduced poverty and the lessons for other Developing countries. Public Affairs, 2013.
5. Deaton, Angus. The great escape: health, wealth, and the origins of inequality. Princeton University Press, 2013.
6. Easterly, William, and Ross Levine. “Africa’s growth tragedy: policies and ethnic divisions.” The Quarterly Journal of Economics (1997): 1203-1250.
7. Fukuyama, “What is governance?.” Governance 26.3 (2013): 347-368.
8. Guha, Ramachandra. “Democrats and ”, Penguin Random House India Private Limited, 2016.
9. Hirschman, Albert. O. “Exit, Voice and ”, World Politics Vol 31, No. 1 (1978): 90-107.
10. Kochhar, Kalpana, et al. “India’s Pattern of Development: What happened, What Follows?.” Journal of Monetary Economics 5 (2006): 981-1019.
11. Kohli, Atul. “State and redistributive development in India.” Growth, Inequality and Social Development in India”. Palgrave Macmillan UK, 2012. 194-226.
12. Mangla, Akshay. “Bureaucratic Norms and State Capacity in India.” Asian Survey 5 (2015): 882-908.
13. North, Douglass C., and Barry Weingast. “Constitutions and commitment: the evolution of institutions governing public choice in seventeenth-century England.” The journal of Economic History 49.04 (1989): 803-832.
14. Parussini, Gabriele. “India’s Central Bank cuts interest rates”, Wall Street Journal (2016).
15. Pritchett, Lant. “Is India a Flailing State? Detours on the Four Lane Highway to ” (2009), mimeo.
16. Rice, Susan and Patrick, Steward. “Index of State Weakness in the Developing World”, Brooking Foreign Policy.
17. Rodrik, Dani, and Arvind Subramanian. “From ‘Hindu Growth’ to Productivity Surge: The Mystery of the Indian Growth Transition.” IMF Staff Papers, 52, no. 2, 2005, pp. 193–228. www. jstor.org/stable/30035894.
18. Rodrik, “The past, present, and future of economic growth.” Challenge 57.3 (2014): 5-39.
Saint-Paul, Gilles, and Thierry Verdier. “Education, democracy and growth.” Journal of development Economics 42.2 (1993): 399-407.
19. Subramanian, Arvind. “Incentivising Pulses Production Through Minimum Support Price and Related Policies”, Ministry of Finance, Government of


