.. real development cannot ultimate/y take place in one corner of India while the other is neglected.”
– Pandit Jawaharlal Nehru
Despite rapid overall growth, there is striking evidence of divergence, or widening gaps in income and consumption across the Indian states, in sharp contrast to patterns within China and across the world. This trend is particular puzzling since that the forces of equalization—trade in goods and movement of people—are stronger within India than they are across countries, and they are getting stronger over time. This raises the possibility that governance traps are impeding equalization within India. In contrast, health outcomes are converging within India. Compared to international standards and accounting for levels of income, India does well on life expectancy, not-so-well on infant mortality rate, and strikingly well on fertility rate.
I. INTRODUCTION
10.1. As Chapter 1 has documented , India’s economic performance has been remarkable in the aggregate. Its continued success as a federation depends on the progress of each of its individual states. What can be a reasonable standard for assessing how well the states are doing? One intuitive metric can be to see how well individual states have done over time on two broad sets of indicators: economic and health/demographic indicators. This analysis starts from the 1980s because it allows for a longer term perspective; but also because that is the time when the structural break from the previous era of the “Hindu Growth Rate” (to use the late Professor Raj Krishna’s term) occurred (De Long, 2001; Williamson and Zagha, 2002; Rodrik and Subramanian, 2004).
10.2. Figure 1 plots the level of real per capital GSDP over time between 1983 and 2014 (the latest year for which comprehensive data is available). It is clear that, especially during the last decade, there has been an across-the-board improvement reflected in the whole distribution shifting right. For example, between 1984 and 2014, the least developed state (Tripura) increased its per capital GSDP 5.6 fold; (from per capital GSDP of Rs. 11,537 in 1984 to Rs. 64,712 in 2014) and the median state (Himachal Pradesh) increased its income level 4.3 fold.
10.3. Figures 2A, 2B and 2C show plots
Figure 1. Income Levels over the years in India, All Indian States
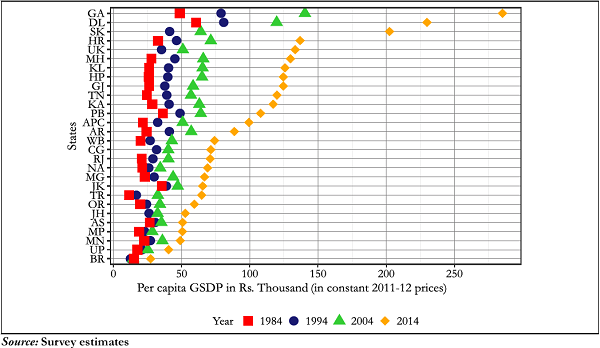
Figure 2A. Life Expectancy Levels Over Time in India
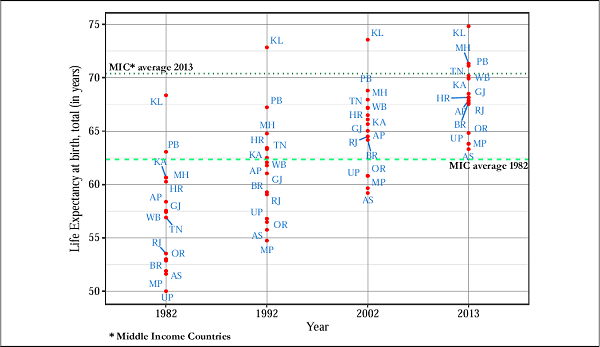
for life expectancy, infant mortality rate, and total fertility rate for Indian states2. Life expectancy at birth (LE) indicates the number of years a newborn would live if prevailing patterns of mortality at the time of its birth were to stay the same throughout its life.
Figure 2B. Infant Mortality Rate (IMR) Levels Over Time in India
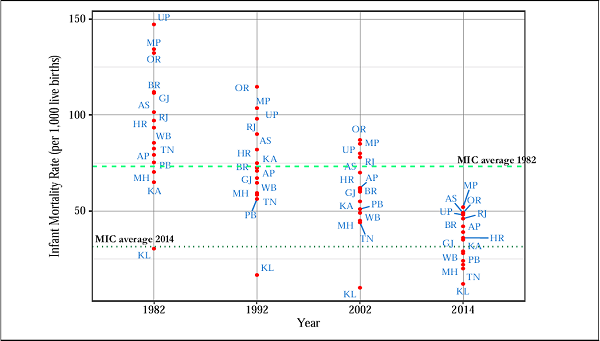
Figure 2C. Total Fertility Rate (TFR) Levels Over Time in India
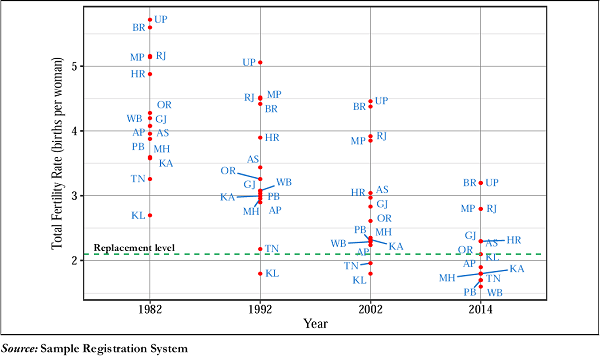
Infant mortality rate (IMR) is defined as the number of infants dying before reaching one year of age, per 1,000 live births in a given year. Total fertility rate (TFR) is defined as the number of children that would be born to a woman if she were to live to the end of her childbearing years and bear children in accordance with age-specific fertility rates in a given year.
10.4. Across these health and demographic indicators, there have been dramatic improvements: over the last 3 decades, the poorest performer (UP) has increased its life expectancy by 13.8 years, reduced its IMR by 99 points, and lowered its TFR by 2.5 points (with a level of 3.2 TFR in 2014). The corresponding numbers for the median state are: a rise in life expectancy by 12.5 years (West Bengal), a fall in IMR by 36 points (Karnataka), and a drop in TFR by 1.8 points (Assam).
10.5. While these developments are encouraging, they don’t allow a full assessment because there is no obvious benchmark to measure these improvements. How has Odisha done relative to Kerala? How have Odisha and Kerala done relative to other states? Economic theory provides one metric to make such comparisons: convergence (or unconditional convergence).
10.6. Convergence means that a state that starts off at low performance levels on an outcome of importance, say the level of income or consumption, should see faster growth on that outcome over time, improving its performance so that it catches up with states which had better starting points. For
example, since the per capital GSDP of Odisha in 1984 was 25 percent lower than the per capita GSDP of Kerala, traditional convergence theory would suggest that Odisha would experience higher growth rates over time, thereby reducing the gap between the two states.
10.7. Convergenceis thus anintuitivemeasure of absolute and relative performance, allowing national and international comparisons. It measures the rate of catch-up, in particular whether less developed states have caught up with richer ones and hence whether regional dispersion is increasing.
10.8. In this chapter, we focus on two broad economic indicators—income and consumption—and three indicators of health and demographic outcomes—life expectancy, infant mortality rate and total fertility rate. We report three major findings.


