An ideal society should be mobile, should be full of channels for conveying a change taking place in one part to other parts.
– Dr. B.R. Ambedkar
The popular impression is one of an India where labour flows are relatively low. Based on two new data sets and methodologies, this chapter finds high levels of internal work-related migration in India. Analysing the changes in same-age cohorts using Census data yields an annual inter-state migration of about 5-6.5 million between 2001 and 2011. Railway passenger data analysis suggests an annual inter-state migration flow of close to 9 million since 2011. Clearly, rising growth after the 1980s has led to an acceleration of labour migration flows as the rewards of better economic opportunities have overcome the costs of moving. This chapter also documents patterns of railway passenger flows across states and districts which are consistent with priors but also throw up surprises. One such is that language does not seem to be a serious barrier to internal economic integration which if true would vindicate the founding fathers’ permissive approach to India’s linguistic cleavage. Of course, the striking findings of this chapter and the previous one on trade is deeply puzzling. Across India, income and consumption outcomes are diverging in the face of the equalizing forces of rapid internal integration of goods, people and capital.
I. INTRODUCTION AND MAIN FINDINGS
12.1 On Chinese New Year, a staggering 277 million migrants1– about 25 percent of the workforce – board trains to return home. In China, high economic growth rates have been accompanied by mass migration from the rural hinterlands to urban hotspots, mainly along the coast.
12.2 Historically, migration of people for work and education has been a phenomenon that accompanies the structural transformation of economies, and has paved the way for the release of “surplus labour” from relatively low-productive agricultural activities to sectors enjoying higher productivity. The resulting remittance flows increase household spending in the receiving regions and further the economic development of less-developed regions.
12.3 Given that higher labour migration bodes well for a country’s economic future, how does India compare to its neighbor? The traditional view, based on a straightforward reading of the 2001 Census, is that the stock of migrants in India is low (around 33 million), and not increasing very rapidly. This chapter instead takes a different view and arrives at a much larger estimate of labour migration in India by analyzing 2011 Census data and railway passenger traffic flows data provided by the Ministry of Railways2.
12.4 The pattern of flows of people found in this study are broadly consistent with popular conception – less affluent states see more people migrating out while the most affluent states are the largest recipients of migrants. The cost of moving for people is about twice as much as it is for goods – another confirmation of priors (Helliwell, 1997). There are three noteworthy findings that emerge.
12.5 First, India is increasingly on the move – and so are Indians. A new Cohort-based Migration Metric3(CMM)—shows that annually inter-state labour mobility averaged 5-6 million people between 2001 and 2011, yielding an inter-state migrant population of about 60 million and an inter-district migration as high as 80 million4. The first-ever estimates of internal work-related migration using railways data for the period 2011-2016 indicate an annual average flow of close to 9 million people between the states. Both these estimates are significantly greater than the annual average number of about 3.3 million suggested by successive Censuses and higher than previously estimated by any study5.
12.6 Second, migration is accelerating. In the period 2001-11, according to Census estimates, the annual rate of growth of labour migrants nearly doubled relative to the previous decade, rising to 4.5 per cent per annum in 2001-11 from 2.4 per cent in 1991- 2001. There is also a doubling of the stock of out-migrants to 11.2 million in the 20- 29 year-old cohort alone. This acceleration has been accompanied by the surge of the economy. As growth increased in the 2000s relative to the 1 990s, the returns to migration might have increased sufficiently to offset the costs of moving, resulting in much greater levels of migration.
12.7 Third, and a potentially exciting finding, for which there is tentative not conclusive evidence, is that while internal political borders impede the flow of people, language does not seem to be a demonstrable barrier to the flow of people. Results from a gravity model indicate that political borders depress the flows of people, reflected in the fact that, controlling for distance, labour migrant flows within states are 4 times the labour migrant flows across states. However, language barriers appear not to create comparable frictions to the movement of goods (See Chapter 11) and people within India. The prescient permissiveness of the founding fathers in not dictating a lingua franca for the country appears to have succeeded in making language less salient an axis of cleavage across India, a remarkable achievement given the early anxieties about linguistic divisions (Guha, 2007).
12.8 Of course, all these interesting results throw up a deep puzzle as to why greater internal integration has not led to a narrowing of income and consumption gaps across states, as we document in Chapter 10: the co-existence of diverging incomes and consumption alongside the equalizing forces of internal integration of goods, people and capital is a mystery waiting to be deciphered.
II. BASELINE CENSUS DATA: MIGRATION LEVELS AND GROWTH
12.9 Before the new estimates and new methodologies are discussed, the basic data provided by the Census is presented. These figures are significant under-estimates (see Box 1), but they still convey the same basic picture, of a surge in labour mobility.
12.10 Table 1 shows that between 1991 and 2001 the growth rates of the workforce and migrants for economic reasons were nearly identical, at 2.4 per cent per annum. But as GDP growth started to soar over the next decade, the two began to diverge. The growth rate of migrants rose spectacularly to 4.5 per cent per annum, while the workforce growth rate actually fell. Thus, the migrants’ share of the workforce rose substantially. A breakdown by gender reveals that the acceleration of migration was particularly pronounced for females. In the 1990s female migration was extremely limited, and migrants were shrinking as a share of the female workforce. But in the 2000s the picture turned around completely: female migration for work not only grew far more rapidly than the female workforce, but increased at nearly twice the rate of male migration.
Table 1. Workforce and Migration for Economic reasons, Census 1991-2011
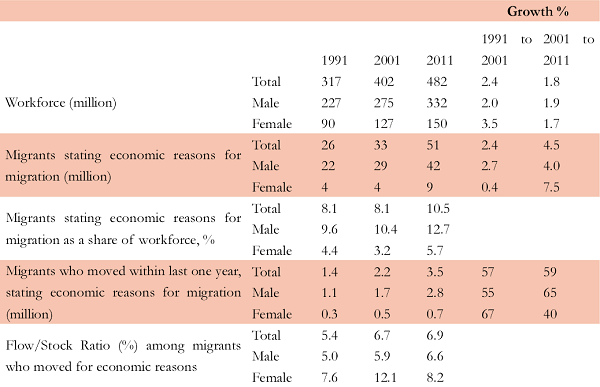
Source: Census 1991, 2001 and 2011. Figures for 1991 adjusted for Census absence in J&K in 1991. Migration data for 2011 are taken from provisional D-5 tables. Economic reasons include work, employment and business. Flow/ Stock ratio is migration for duration less than a year divided by total stock of migrants. Compound annual growth rates taken for stocks and simple growth rate used for annual flows.
III. RE-ESTIMATING MIGRATION: TWO TIME PERIODS, TWO DATA SOURCES, TWO NEW APPROACHES
12.11 This section presents two new approaches to estimating migration within India. The first is based on comparing similar cohorts across the two census periods, 2001 and 2011. The second is based on data on railway passenger traffic in the unreserved category for the period 2011-2016. Each is described in turn.
A. Cohort-based Migration Metric (CMM)
12.12 In order to further analyze recent trends in labour mobility, a Cohort-based Migration Metric (CMM) is developed to gauge net migration at the state and district level6. This metric considers net migration to be the percentage change in population between the 10-19 year-old cohort in an initial census period and the 20-29 year-old cohort in the same area a decade later, after correcting for mortality effects (See Appendix I)7.It is likely to capture labour migration, as other bilateral movements for reasons such as marriage are netted out in the equation8.
12.13 Figure 1 and Table 2 show the change in CMM scores from the 1990s to the 2000s. Among net in-migration states, Karnataka is a recent entrant (see the northwest quadrant of the figure). Internal migration rates have dipped in Maharashtra and surged in Tamil Nadu and Kerala reflecting the growing pull of southern states in India’s migration dynamics. Out-migration rates increased in Madhya Pradesh, Bihar and Uttar Pradesh and have dipped in Assam.
Box 1. Estimating the Size of the Migrant Workforce in India
Traditional views on labour mobility in India have held it to be low and stagnant over the years. According to Census 2001, 33 million people or 8.1% of the Indian workforce were migrants for economic reasons. Over 80% of these migrants were male. Labour mobility also appears to be low because urbanization rates have not picked up sharply over the years, changing by roughly three percentage points per decade, irrespective of the urban definition used.
Recent research has however questioned this view. First, labour migration in India tends to be circular1 in nature in both short and long-term migration streams and is not adequately captured by Census data. Using sectoral workforce data, Deshingkar and Akter (2009) argue that the number of migrant workers exceeds 100 million. Similarly, using National Sample Survey data of 2007-08 that captures short-term migration better than the Census, Mazumdar et. al. (2013) document nearly 70 million migrant workers in India comprising 17% of the workforce of the survey year. Second, female migration for work is concealed in ‘reason-for-migration’ statistics because the principal reason given to the enumerator is ‘marriage’ or ‘moved with household.’ Using NSS 2007-08 data separately on migration and worker status, it can be shown that migrants comprise 29% of the workforce (GoI 2017, Srivastava 2011). Alternatively, nearly 20% of rural households had at least one out-migrant for work in 2007-08 (Tumbe 2015). Third, commuter migration for work across the rural-urban divide is also substantial in India, exceeding 10 million people in 2009-10 (Chandrasekhar 2011). Fourth, the slow pace of Indian urbanization is rooted in the demographic divergence between rural and urban natural growth rates and not necessarily in low or stagnant rates of migration (Tumbe, 2016).
While Census migration data is useful to understand certain aspects of migration, it has its limitations in capturing circular migration and female migration for work. Alternative estimates noted above place the share of migrants in the workforce to lie between 17% and 29%. As per Census 2011, the size of the workforce was 482 million people and based on extrapolation, this figure will exceed 500 million in 2016. If the share of migrants in the workforce is estimated to be even 20%, the size of the migrant workforce can be estimated to be over 100 million in 2016 in absolute terms.


Firstly, i admit that i am not competent to comment on ? is said above. BUT I laugh loudly at conveying that India’s economic status is developing.
First remember India is not a country of creating anything which is not in the nature. india is a country of using the eatables and non eatables to his / her advantage. FROM this stage it raised to using machinery and material created elesewhere in the world to his / her advantage.
in the process some changes may take place in the society like migration. Migration can’t be an indicator of progress.