Against the backdrop of robust macro-economic stabiity, the year was marked by two major domestic policy developments, the passage of the Constitutional amendment, paving the way for implementing the transformational Goods and Services Tax (GST), and the action to demonetise the two highest denomination notes. The GST will create a common Indian market, improve tax compliance and governance, and boost investment and growth; it is also a bold new experiment in the governance of India’s cooperative federalism. Demonetisation has had short-term costs but holds the potential for long-term benefits. Follow-up actions to minimize the costs and maximise the benefits include: fast, demand-driven, remonetisation; further tax reforms, including bringing land and real estate into the GST, reducing tax rates and stamp duties; and acting to allay anxieties about over-zealous tax administration. These actions would allow growth to return to trend in 2017-18, following a temporary decline in 2016-17. Looking further ahead, societal shifts in ideas and narratives will be needed to overcome three long-standing meta-challenges: inefficient redistribution, ambivalence about the private sector and property rights, and improving but still-challenged state capacity. In the aftermath of demonetisation, and at a time of gathering gloom about globalisation, articulating and embracing those ideational shifts will be critical to ensuring that India’s sweet spot is enduring not evanescent.
1. Introduction
1.1 The Economic Survey of 2014-15 spoke about the sweet spot for the Indian economy that could launch India onto a trajectory of sustained growth of 8-10 percent. Last year’s Survey assessed that “for now, but not indefinitely, that sweet spot is still beckoningly there.” This year’s stock-taking suggests that shifts in the underlying vision will be needed to overcome the major challenges ahead, thereby accelerating growth, expanding employment opportunities, and achieving social justice (Chapter 2 in this Survey). In the aftermath of demonetisation, and because cyclical developments will make economic management harder, articulating and embracing those shifts will be critical to ensuring that that sweet spot is enduring not evanescent.
1.2 This year has been marked by several historic economic policy developments. On the domestic side, a constitutional amendment paved the way for the long-awaited and transformational goods and services tax (GST) while demonetisation of the large currency notes signaled a regime shift to punitively raise the costs of illicit activities. On the international front, Brexit and the US elections may herald a tectonic shift, forbiddingly laden with darker possibilities for the global, and even the Indian, economy.
1.3 Start first with demonetisation. A radical governance-cum-social engineering measure was enacted on November 8, 2016. The two largest denomination notes, Rs 500 and Rs 1000—together comprising 86 percent of all the cash in circulation—were “demonetised” with immediate effect, ceasing to be legal tender except for a few specified purposes.1 These notes were to be deposited in the banks by December 30, while restrictions were placed on cash withdrawals. In other words, restrictions were placed on the convertibility of domestic money and bank deposits.
1.4 The aim of the action was fourfold: to curb corruption, counterfeiting, the use of high denomination notes for terrorist activities, and especially the accumulation of “black money”, generated by income that has not been declared to the tax authorities. The action followed a series of earlier efforts to curb such illicit activities, including the creation of the Special Investigation Team (SIT) in the 2014 budget, the Black Money Act, 2015; the Benami Transactions Act of 2016; the information exchange agreement with Switzerland, changes in the tax treaties with Mauritius and Cyprus, and the Income Disclosure Scheme.
1.5 Demonetisation was aimed at signaling a regime change, emphasizing the government’s determination to penalize illicit activities and the associated wealth. In effect, the tax on illicit activities as well as on legal activities that were not disclosed to the tax authorities was sought to be permanently and punitively increased.
1.6 The public debate on demonetisation has raised three questions. First, broader aspects of management, as reflected in the design and implementation of the initiative. Second, its economic impact in the short and long run. And, third, its implications for the broader vision underlying the future conduct of economic policy. This Survey is not the forum to discuss the first question.
1.7 Chapter 3 addresses in detail the second question. The broad conclusion is that demonetisation will create short-term costs and provide the basis for long run benefits.
1.8 Short-term costs have taken the form of inconvenience and hardship, especially those in the informal and cash-intensive sectors of the economy who have lost income and employment. These costs are transitory, and may be minimised in recorded GDP because the national income accounts estimate informal activity on the basis of formal sector indicators, which have not suffered to the same extent. But the costs have nonetheless been real and significant. The benefits of lower interest rates and dampened price pressure may have cushioned the short-term macro-economic impact.
1.9 At the same time, demonetisation has the potential to generate long-term benefits in terms of reduced corruption, greater digitalization of the economy, increased flows of financial savings, and greater formalization of the economy, all of which could eventually lead to higher GDP growth, better tax compliance and greater tax revenues.
1.10 The magnitudes of short-term costs remain uncertain, as do the timing and extent of long-term benefits. (Chapter 3 identifies certain markers to assess the latter.) These magnitudes will depend importantly on how policyresponds to the current situation. Needed actions include: remonetizing the economy expeditiously by supplying as much cash as necessary, especially in lower denomination notes; and complementing demonetisation with more incentive-compatible actions such as bringing land and real estate into the GST, reducing taxes and stamp duties, and ensuring that the follow-up to demonetisation does not lead to over-zealous tax administration.
1.11 The third question on the broader vision will also be critical to shaping the medium term trajectory of the economy. Here the government has taken important steps over the past year. The highlight was, of course, the transformational GST bill, which will create a common Indian market, improve tax compliance, boost investment and growth – and improve governance; the GST is also a bold new experiment in the governance of cooperative federalism. In addition, the government:
- Overhauled the bankruptcy laws so that the “exit” problem that pervades the Indian economy–with deleterious consequences highlighted in last year’s Survey–can be addressed effectively and expeditiously;
- Codified the institutional arrangements on monetary policy with the Reserve Bank of India (RBI), to consolidate the gains from macroeconomic stability by ensuring that inflation control will be less susceptible to the whims of individuals and the caprice of governments; and
- Solidified the legal basis for Aadhaar, to realise the long-term gains from the JAM trifecta (Jan Dhan-Aadhaar-Mobile), as quantified in last year’s Survey.
1.12 Had the government announced such an agenda early in 2016, its ambition would have elicited skepticism, probably deserved. Yet a year on this agenda has been achieved, and in nearly all cases through legislative action that commanded near-political unanimity.
1.13 Beyond these headline reforms were other less-heralded but nonetheless important actions. The government enacted a package of measures to assist the clothing sector that by virtue of being export-oriented and labor-intensive could provide a boost to employment, especially female employment. The National Payments Corporation of India (NPCI) successfully finalized the Unified Payments Interface (UPI) platform. By facilitating inter-operability it will unleash the power of mobile phones in achieving digitalization of payments and financial inclusion, and making the “M” an integral part of the government’s flagship “JAM”-Jan Dhan, Aadhaar, Mobile– initiative. Further FDI reform measures were implemented, allowing India to become one of the world’s largest recipients of foreign direct investment.
1.14 These measures cemented India’s reputation as one of the few bright spots in an otherwise grim global economy. India is not only among the world’s fastest growing major economies, underpinned by a stable macro-economy with declining inflation and improving fiscal and external balances. It was also one of the few economies enacting major structural reforms. Yet there is a gap between this reality of macro-economic stability and rapid growth, on the one hand, and the perception of the ratings agencies on the other. Why so? Box 1 elaborates on the possible reasons.
1.15 But much more needs to be done. Especially after 1991, India has progressively distanced itself from statism and made considerable strides in improving the management of the economy. Yet a broader stock-taking (discussed in Chapter 2) suggests that India has to traverse a considerable distance to realize its ambitions on growth, employment and social justice. Broader societal shifts are required in ideas and narratives to address
Box 1. Poor Standards? The Rating Agencies, China & India
In recent years, the role of ratings agencies has increasingly come into question. In the US financial crisis, questions were raised about their role in certifying as AAA bundles of mortgage-backed securities that had toxic underlying assets (described in Michael Lewis’ The Big Short). Similarly, their value has been questioned in light of their failure to provide warnings in advance of financial crises—often ratings downgrades have occurred post facto, a case of closing the stable doors after the horses have bolted (IMF, 2010; Krugman, September, 201 52).
But it is also worth assessing their role in more normal situations. In the case of India, Standard & Poor’s in November 2016 ruled out the scope for a ratings upgrade for some considerable period, mainly on the grounds of its low per capita GDP and relatively high fiscal deficit. The actual methodology to arrive at this rating was clearly more complex. Even so, it is worth asking: are these variables the right key for assessing India’s risk of default?
Consider first per capita GDP. It is a very slow moving variable. Lower middle income countries experienced an average growth of 2.45 percent of GDP per capita (constant 2010 dollars) between 1970 and 2015. At this rate, the poorest of the lower middle income countries would take about 57 years to reach upper middle income status. So if this variable is really key to ratings, poorer countries might be provoked into saying, “Please don’t bother this year, come back to assess us after half a century.”
Consider next fiscal variables. The practice of ratings agencies is to combine a group of countries and then assess comparatively their fiscal outcomes. So, India is deemed an outlier because its general government fiscal deficit ratio of 6.6 percent (2014) and debt of 67.1 percent are out of line with its emerging market “peers” (See Table 1 in Chapter 5).
But India could be very different from the comparators used by the ratings agencies. After all, many emerging markets are struggling. But India has a strong growth trajectory, which coupled with its commitment to fiscal discipline exhibited over the last three years suggests that its deficit and debt ratios are likely to decline significantly over the coming years. Even if this scenario does not materialise, India might still be able to carry much more debt than other countries because it has an exceptionally high “willingness to pay”, as demonstrated by its history of not defaulting on its obligations (Reinhart, Rogoff and Savastano, 2003).

Source: WDI and S&P; for 2016, India’s credit data are from RBI and Credit Suisse; for 2016, China’s credit number is obtained by adding flows of total social financing (TSF) from the Bank for International Settlements (BIS) to the 2015 stock obtained from the WDI.
India also compares favourably to other countries on other metrics known to be closely related to the risk of default. Consider the contrast with China. In 2009, China launched an historic credit expansion, which has so far seen the credit-GDP ratio rise by an unprecedented about 63 percentage points of GDP, much larger than the stock of India’s credit-GDP (Figure ). At the same time, Chinese growth has slowed from over 10 percent to 6.5 percent.
How did Standard and Poor’s react to this ominous scissors pattern, which has universally been acknowledged as posing serious risks to China and indeed the world? In December 2010, it increased China’s rating from A+ to AA- and it has never adjusted it since, even as the credit boom has unfolded and growth has experienced a secular decline.
In contrast, India’s ratings have remained stuck at the much lower level of BBB-, despite the country’s dramatic improvement in growth and macro-economic stability since 2014.
These contrasting experiences raise a question: can they really be explained by an economically sound methodology?
three major challenges: reducing “inefficient redistribution,” strengthening state capacity in delivering essential services and regulating markets, and dispelling the ambivalence about protecting property rights and embracing the private sector. In other words, addressing these challenges is not just about the political will to overcome vested interests.
1.16 These structural challenges have their proximate policy counterparts. Chapter 9 discusses India’s extensive efforts at redistribution. The central government alone runs about 950 central sector and centrally sponsored schemes and sub-schemes which cost about 5 percent of GDP. Clearly, there are rationales for many of them. But there may be intrinsic limitations in terms of the effectiveness of targeting.
1.17 The government has made great progress in improving redistributive efficiency over the last few years, most notably by passing the Aadhaar law, a vital component toward realizing its vision of JAM. (The pilots for Direct Benefit Transfers in fertilizer represent a very important new direction in this regard.) At the same time, prices facing consumers in many sectors are yet to move closer toward market levels. Even on the GST, concerns about ensuring low tax rates for essentials, risks creating an unduly complicated structure with multiple and excessively high peak rates, thereby foregoing large services efficiency gains.
1.18 On state capacity, delivery of essential services such as health and education, which are predominantly the preserve of state governments, remains impaired. Regulatory institutions are still finding their way. The deepest puzzle here is the following: while competitive federalism has been a powerful agent of change in relation to attracting investment and talent, it has been less in evidence in relation to essential service delivery. There have, of course, been important exceptions, such as the improvement of the public distribution system (PDS) in Chhattisgarh, the incentivization of agriculture in Madhya Pradesh, reforms in the power sector in Gujarat which improved delivery and cost recovery, the efficiency of social programs in Tamil Nadu, and the recent use of technology to help make Haryana kerosene-free. But on health and education there are insufficient instances of good models that can travel widely within India and that are seen as attractive political opportunities. Competitive populism needs a counterpart in competitive service delivery.
1.19 Equally, signs of a political dynamic that would banish the ambivalence toward the private sector and property rights have not been strongly evident for decades. This ambivalence is manifested in: the difficulties in advancing strategic disinvestment; the persistence of the twin balance sheet problem—over-indebtedness in the corporate and banking sectors—which requires difficult decisions about burden-sharing and perhaps even forgiving some burden on the private sector; the legacy issues of retroactive taxation, which remain mired in litigation even though the government has made clear its intentions for the future; agriculture, where the protection of intellectual property rights, for example in seeds, remains a challenge; reform in the civil aviation sector, which has been animated as much by an interventionist as liberalizing spirit; in the fertilizer sector, where it is proving easier to rehabilitate unviable plants in the public sector rather than facilitate the exit of egregiously inefficient ones; frequent recourse to stock limits and controls on trade in agriculture, which draws upon the antiquated Essential Commodities Act, and creates uncertainty for farmers.
1.20 In each of these examples, there may be valid reasons for the status quo but overall they indicate that the embrace of markets— even in the modest sense of avoiding intrusive intervention, protecting property rights, disposing of unviable public sector assets and exiting from areas of comparative non-advantage, and allowing economic agents to face market prices—remains a work-in-progress.
1.21 Even as the domestic agenda remains far from complete, the international order is changing, posing new challenges. The impact of Brexit and the US elections, though still uncertain, risk unleashing paradigmatic shifts in the direction of isolationism and nativism. The post war consensus in favour of globalisation of goods, services and labor in particular, and market-based economic organization more broadly, is under threat across the advanced economies.
1.22 For India that is a late “converger”— that is an economy whose standards of living are well below countries at the frontier—these events have immense consequences. Given that India’s growth ambitions of 8-10 percent require export growth of about 15-20 percent, any serious retreat from openness on the part of India’s trading partners would jeopardize those ambitions (see Box 2).
1.23 To these structural domestic and external developments must be added the proximate macro-economic challenges. Since the decline in oil prices from their peak in June 2014 there has been a lift to incomes which combined with government actions imparted dynamism by increasing private consumption and facilitating public investment, shoring up an economy buffeted by the headwinds of weak external demand and poor agricultural production. This year that important source of short-term dynamism may be taken away as international oil prices are now on the rise. Moreover, private investment remains weak because of the twin balance sheet problem that has been the economy’s festering wound for several years now (Chapter 4). Re-establishing private investment and exports as the predominant and durable sources of growth is the proximate macro-economic challenge.
1.24 In sum, the steady progress on structural reforms made in the last few years needs to be rapidly built upon, and the unfinished agenda completed. Especially after demonetisation and given the ever-present late-term challenges, anxieties about the vision underlying economic policy and about the forgoing of opportunities created by the sweet spot need to be decisively dispelled.
II. Global context
1.25 For India, three external developments are of significant consequence. In the short-run, the change in the outlook for global interest rates as a result of the US elections and the implied change in expectations of US fiscal and monetary policy will impact on India’s capital flows and exchange rates. Markets are factoring in a regime change in advanced countries, especially US macroeconomic policy, with high expectations of fiscal stimulus and unwavering exit from unconventional monetary policies. The end of the 20-year bond rally and end to the corset of deflation and deflationary expectations are within sight.
1.26 Second, the medium-term political outlook for globalisation and in particular for the world’s “political carrying capacity for globalisation” may have changed in the wake of recent developments. In the short run a strong dollar and declining competitiveness might exacerbate the lure of protectionist policies. These follow on ongoing trends— documented widely—about stagnant or declining trade at the global level (figure in Box 2). This changed outlook will affect India’s export and growth prospects described in Box 2.
1.27 Third, developments in the US, especially the rise of the dollar, will have implications for China’s currency and currency policy. If China is able to successfully re-balance its economy, the spillover effects on India and the rest of the world will be positive. On, the other hand, further declines in the yuan, even if dollar-induced, could interact with underlying vulnerabilities to create disruptions in China that could have negative spillovers for India (these are discussed in detail in Section VI.B). For China, there are at least two difficult balancing acts with respect to the currency. Domestically, a declining currency (and credit expansion) prop up the economy in the short run but delay rebalancing while also adding to the medium term challenges. Internationally, allowing the currency to weaken in response to capital flight risks creating trade frictions
Box 2. Political Carrying Capacity of the West for Openness and Impact on India
If as T.S. Eliot said that humankind cannot bear too much reality, recent events suggest that the world cannot bear too much globalisation either. What does this mean for India’s exports?
The first figure plots the trade-GDP ratio for the world since 1870 and highlights four phases. There were two phases of globalisation (1 870-1914, 1945-1985), one phase of hyperglobalisation (Subramanian and Kessler, 2014) between 1985-2008, and one phase of deglobalisation in the inter-war period. The question today is what is likely to happen going forward represented by the three arrows: further globalisation, deglobalisation, or stagnation? These will have potentially important consequences for Indian exports and growth.
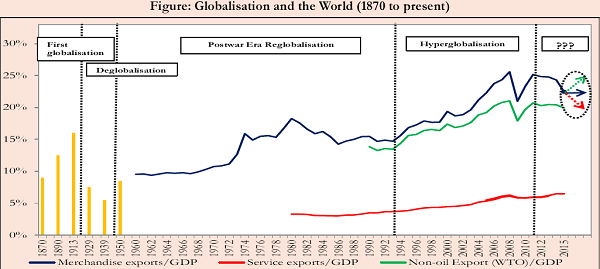
During the boom years between 2003-2011 India’s real GDP growth averaged 8.2 percent, and exports grew at an annual rate of between 20 and 25 percent (in real dollar terms, for goods and services). So, assume conservatively that India aims to grow at 8 percent for the next decade and that that requires growth in exports of goods and services of 15 percent, respectively.
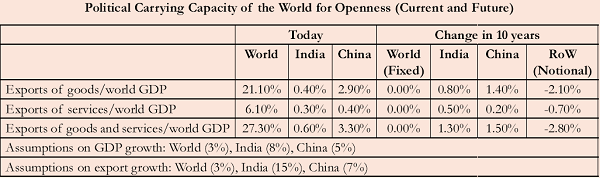
Next, assume that the world will continue to grow at 3 percent growing forward. Define the political carrying capacity of the world for globalisation as the world’s export-to-GDP ratio. The latest figure for that is about 21 percent; assume that it remains stable. (Note that if world trade continues to grow more slowly than overall GDP, as it has done in recent years, the equilibrium carrying capacity—the world’s export-GDP ratio—would actually fall.)
Source: Survey Calculation.
In these circumstances, the problem is the following. India’s GDP and export growth alone will imply an increase in the world’s export-to-GDP ratio of about 1.3 percentage points. If China’s export growth continues at the pace of the last 6 years (7 percent in real terms), that will lead to a further increase in the world’s export-GDP ratio of another 1.4 percentage points. In other words, India’s export growth will run up against the world’s carrying capacity for globalisation. The squeeze will get worse if the world’s trade-GDP ratio declines, and considerably worse if China’s export juggernaut continues.
From India’s perspective, the political carrying capacity for globalisation is relevant not just for goods but also services. The world’s service exports-GDP ratio is about 6.1 percent. If India grows rapidly on the back of dynamic services exports, the world’s service exports-GDP ratio will increase by 0.5 percentage points—which would be a considerable proportion of global exports. Put differently, India’s services exports growth will test the world’s globalisation carrying capacity in services. Responses could take not just the form of restrictions on labor mobility but also restrictions in advanced countries on outsourcing.
It is possible that the world’s carrying capacity will actually be much greater for India’s services than it was for China’s goods. After all, China’s export expansion over the past two decades was imbalanced in several ways: the country exported far more than it imported; it exported manufactured goods to advanced countries, displacing production there, but imported goods (raw materials) from developing countries; and when it did import from advanced economies, it often imported services rather than goods.3 As a result, China’s development created relatively few export-oriented jobs in advanced countries, insufficient to compensate for the jobs lost in manufacturing – and where it did create jobs, these were in advanced services (such as finance), which were not possible for displaced manufacturing workers to obtain. In contrast, India’s expansion may well prove much more balanced. India has tended to run a current account deficit, rather than a surplus; and while its service exports might also displace workers in advanced countries, their skill set will make relocation to other service activities easier; indeed, they may well simply move on to complementary tasks, such as more advanced computer programming in the IT sector itself. On the other hand, since skilled labour in advanced economies will be exposed to Indian competition, their ability to mobilize political opinion might also be greater.
In sum, the political backlash against globalisation in advanced countries, and China’s difficulties in rebalancing its economy, could have major implications for India’s economic prospects .They will need to be watched in the year – and decade – ahead.
but imposing capital controls discourages FDI and undermines China’s ambitions to establish the yuan as a reserve currency. China with its underlying vulnerabilities remains the country to watch for its potential to unsettle the global economy.
III. Review of developments In 2016-17
A. GDP and Inflation
1.28 Since the Survey was presented eleven months ago, the Indian economy has continued to consolidate the gains achieved in restoring macroeconomic stability.
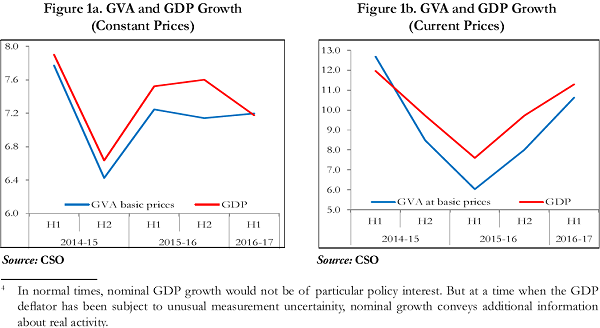
1.29 Real GDP growth in the first half of the year was 7.2 percent, on the weaker side of the 7.0-7.75 per cent projection in the Economic Survey 2015-16 and somewhat lower than the 7.6 percent rate recorded in the second half of 2015-16 (Figure 1a). The main problem was fixed investment, which declined sharply as stressed balance sheets in the corporate sector continued to take a toll on firms’ spending plans. On the positive side, the economy was buoyed by government consumption, as the 7th Pay Commission salary recommendations were implemented, and by the long-awaited start of an export recovery as demand in advanced countries began to accelerate. Nominal GDP growth recovered to respectable levels, reversing the sharp and worrisome dip that had occurred in the first half of 2015-16 (Figure 1b).4
1.30 The major highlights of the sectoral growth outcome of the first half of 2016-17 were: (i) moderation in industrial and non-government service sectors; (ii) the modest pick-up in agricultural growth on the back of improved monsoon; and (iii) strong growth in public administration and defence services— dampeners on and catalysts to growth almost balancing each other and producing a real Gross Value Addition (GVA) growth (7.2 per cent), quite similar to the one (7.1 per cent) in H2 2015-16 (Figure 1a).
1.31 Inflation this year has been characterized by two distinctive features (Figure 2). The Consumer Price Index (CPI)-New Series inflation, which averaged 4.9 per cent during April-December 2016, has displayed a downward trend since July when it became apparent that kharif agricultural production in general, and pulses in particular would be bountiful. The decline in pulses prices has contributed substantially to the decline in CPI inflation which reached 3.4 percent at end-December.
1.32 The second distinctive feature has been the reversal of WPI inflation, from a trough of (-)5.1 percent in August 2015 to 3.4 percent at end-December 2016 (Figure 2), on the back of rising international oil prices. The wedge between CPI and WPI inflation, which had serious implications for the measurement of GDP discussed in MYEA (Box 3, Chapter 1, MYEA 2015-16), has narrowed considerably. Core inflation has, however, been more stable, hovering around 4.5 percent to 5 percent for the year so far.
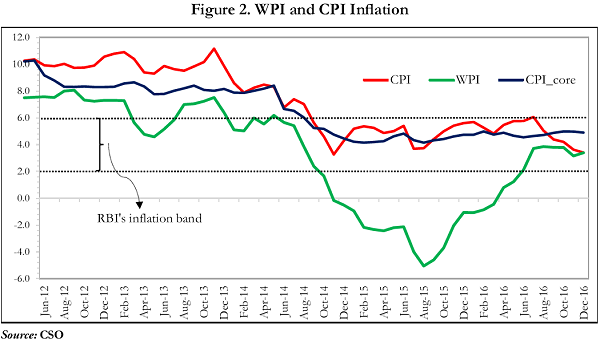
1.33 The outlook for the year as a whole is for CPI inflation to be below the RBI’s target of 5 percent, a trend likely to be assisted by demonetisation.
B. External Sector
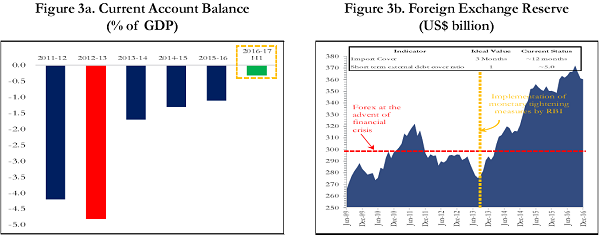
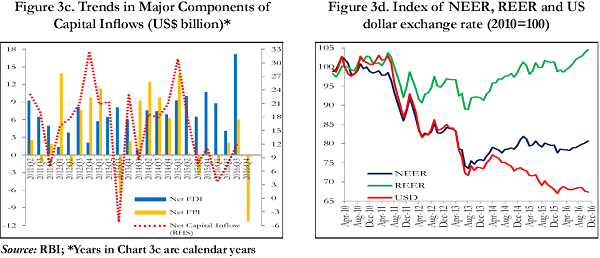
1.34 Similarly, the external position appears robust having successfully weathered the sizeable redemption of Foreign Currency Non-Resident (FCNR) deposits in late 2016, and the volatility associated with the US election and demonetisation. The current account deficit has declined to reach about 0.3 percent of GDP in the first half of FY2017. Foreign exchange reserves are at comfortable levels, having have risen from around US$350 billion at end-January 2016 to US$ 360 billion at end-December 2016 and are well above standard norms for reserve adequacy. In part, surging net FDI inflows, which grew from 1.7 percent of GDP in FY2016 to 3.2 percent of GDP in the second quarter of FY2017, helped the balance-of-payments (Figures 3a to 3d).
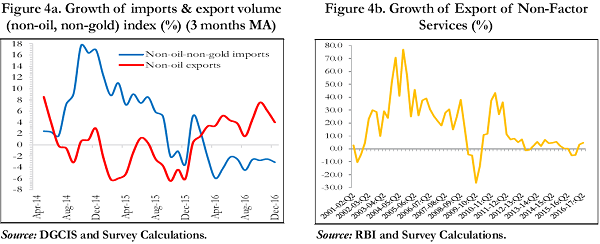
1.35 The trade deficit declined by 23.5 per cent in April-December 2016 over corresponding period of previous year. During the first half of the fiscal year, the main factor was the contraction in imports, which was far steeper than the fall in exports. But during October-December, both exports and imports started a long-awaited recovery, growing at an average rate of more than 5 per cent (Figure 4a). The improvement in exports appears to be linked to improvements in the world economy, led by better growth in the US and Germany. On the import side, the advantage on account of benign international oil prices has receded and is likely to exercise upward pressure on the import bill in the short to medium term.
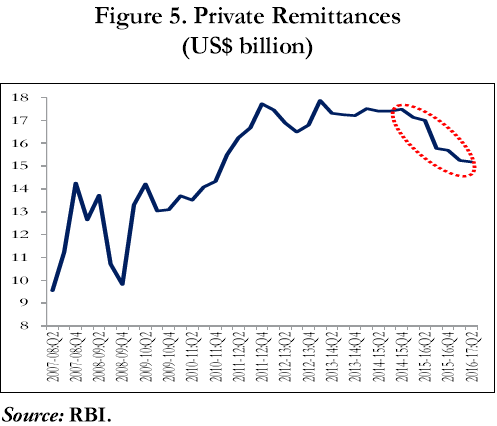
1.36 Meanwhile, the net services surplus declined in the first half, as software service exports slowed and financial service exports declined (Figure 4b). Net private remittances declined by $4.5 bn in the first half of 2016- 17 compared to the same period of 2015-16, weighed down by the lagged effects of the oil price decline, which affected inflows from the Gulf region (Figure 5).