In general, global economic shocks in the past were severe but spaced out in time. This changed in the third decade of this millennium. At least three shocks have hit the global economy since 2020. It all started with the pandemic-induced contraction of the global output, followed by the Russian-Ukraine conflict leading to a worldwide surge in inflation. Then, the central banks across economies led by the Federal Reserve responded with synchronised policy rate hikes to curb inflation. The rate hike by the US Fed drove capital into the US markets causing the US Dollar to appreciate against most currencies. This led to the widening of the Current Account Deficits (CAD) and increased inflationary pressures in net importing economies. The rate hike and persistent inflation also led to a lowering of the global growth forecasts for 2022 and 2023 by the IMF in its October 2022 update of the World Economic Outlook. The frailties of the Chinese economy further contributed to weakening the growth forecasts. Slowing global growth apart from monetary tightening may also lead to a financial contagion emanating from the advanced economies where the debt of the non-financial sector has risen the most since the global financial crisis. With inflation persisting in the advanced economies and the central banks hinting at further rate hikes, downside risks to the global economic outlook appear elevated.
The Indian economy, however, appears to have moved on after its encounter with the pandemic, staging a full recovery in FY22 ahead of many nations and positioning itself to ascend to the pre-pandemic growth path in FY23. Yet in the current year, India has also faced the challenge of reining in inflation that the European strife accentuated. Measures taken by the government and RBI, along with the easing of global commodity prices, have finally managed to bring retail inflation below the RBI upper tolerance target in November 2022. However, the challenge of the depreciating rupee, although better performing than most other currencies, persists with the likelihood of further increases in policy rates by the US Fed. The widening of the CAD may also continue as global commodity prices remain elevated and the growth momentum of the Indian economy remains strong. The loss of export stimulus is further possible as the slowing world growth and trade shrinks the global market size in the second half of the current year.
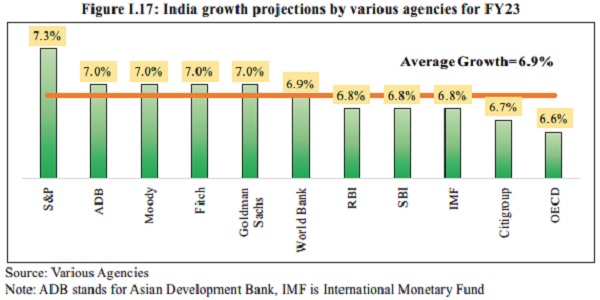
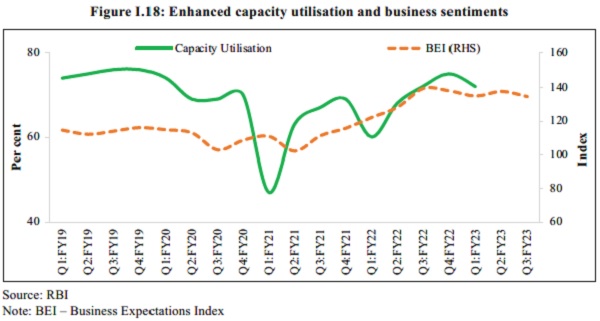
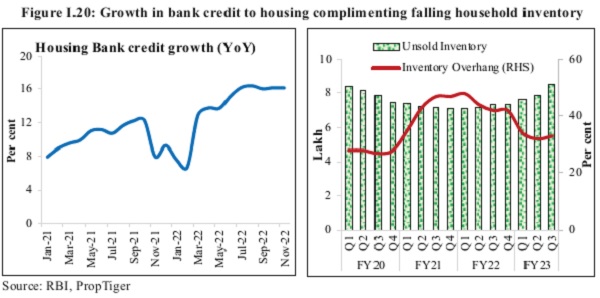
Despite these, agencies worldwide continue to project India as the fastest-growing major economy at 6.5-7.0 per cent in FY23. These optimistic growth forecasts stem in part from the resilience of the Indian economy seen in the rebound of private consumption seamlessly replacing the export stimuli as the leading driver of growth. The uptick in private consumption has also given a boost to production activity resulting in an increase in capacity utilisation across sectors. The rebound in consumption was engineered by the near-universal vaccination coverage overseen by the government that brought people back to the streets to spend on contact-based services, such as restaurants, hotels, shopping malls, and cinemas, among others. The world’s second-largest vaccination drive involving more than 2 billion doses also served to lift consumer sentiments that may prolong the rebound in consumption. Vaccinations have facilitated the return of migrant workers to cities to work in construction sites as the rebound in consumption spilled over into the housing market. This is evident in the housing market witnessing a significant decline in inventory overhang to 33 months in Q3 of FY23 from 42 months last year.
The Capital Expenditure (Capex) of the central government, which increased by 63.4 per cent in the first eight months of FY23, was another growth driver of the Indian economy in the current year, crowding in the private Capex since the January-March quarter of 2022. On current trend, it appears that the full year’s capital expenditure budget will be met. A sustained increase in private Capex is also imminent with the strengthening of the balance sheets of the Corporates and the consequent increase in credit financing it has been able to generate. A much-improved financial health of well-capitalised public sector banks has positioned them better to increase the credit supply. Consequently, the credit growth to the Micro, Small, and Medium Enterprises (MSME) sector has been remarkably high, over 30.6 per cent, on average during Jan-Nov 2022, supported by the extended Emergency Credit Linked Guarantee Scheme (ECLGS) of the Union government. The increase in the overall bank credit has also been influenced by the shift in borrower’s funding choices from volatile bond markets, where yields have increased, and external commercial borrowings, where interest and hedging costs have increased, towards banks. If inflation declines in FY24 and if real cost of credit does not rise, then credit growth is likely to be brisk in FY24.
India’s economic growth in FY23 has been principally led by private consumption and capital formation. It has helped generate employment as seen in the declining urban unemployment rate and in the faster net registration in Employee Provident Fund. Still, private capex soon needs to take up the leadership role to put job creation on a fast track. Recovery of MSMEs is proceeding apace, as is evident in the amounts of Goods and Services Tax (GST) they pay, while the Emergency Credit Linked Guarantee Scheme (ECGLS) is easing their debt servicing concerns. The Mahatma Gandhi National Rural Employment Guarantee Scheme (MGNREGS) has been directly providing jobs in rural areas and indirectly creating opportunities for rural households to diversify their sources of income generation. Schemes like PM-Kisan and PM Garib Kalyan Yojana have helped in ensuring food security in the country, and their impact was also endorsed by the United Nations Development Programme (UNDP)1. The results of the National Family Health Survey (NFHS) also show improvement in rural welfare indicators from FY16 to FY20, covering aspects like gender, fertility rate, household amenities, and women empowerment.
Global growth has been projected to decline in 2023 and is expected to remain generally subdued in the following years as well. The slowing demand will likely push down global commodity prices and improve India’s CAD in FY24. However, a downside risk to the Current Account Balance stems from a swift recovery driven mainly by domestic demand and, to a lesser extent, by exports. The CAD needs to be closely monitored as the growth momentum of the current year spills over into the next. Growth is expected to be brisk in FY24 as a vigorous credit disbursal, and capital investment cycle is expected to unfold in India with the strengthening of the balance sheets of the corporate and banking sectors. Further support to economic growth will come from the expansion of public digital platforms and path-breaking measures such as PM GatiShakti, the National Logistics Policy, and the Production-Linked Incentive schemes to boost manufacturing output.
The global economy battles through a unique set of challenges
1.1 In the last century, several events can be recollected that have had an adverse impact on the global economy. The two world wars are still vivid in public memory, along with the Spanish flu and the great depression. Regional conflicts have been several, as also intermittent oil shocks. The previous millennium closed with the East Asian crisis, and the new millennium in its first decade opened with the technology bust, followed several years later by the global financial crisis. The second decade, apart from minor episodes of the taper tantrum and growing trade tensions between the super-powers, had gone relatively incident-free globally, although Europe had its moments of stress during the decade. Before the third decade of the new millennium commenced, incidents of global economic turbulence were generally spaced out, allowing economies breathing time to recover before preparing for the next challenge.
1.2 The Covid-19 pandemic (‘pandemic’ hereinafter) notified by the WHO in January 2020 was the first challenge of the third decade that hit global growth. Two years later, as the global economy was recovering from the pandemic-induced output contraction, the Russia-Ukraine conflict broke out in February 2022, triggering a swing in commodity prices and, thus, accelerating existing inflationary pressures. This posed the second challenge. Soon after, the third challenge emerged when nations undertook monetary tightening to rein in inflation causing growth to weaken. Monetary tightening also drove capital flows to safe-haven US markets, contributed to rising sovereign bond yields, and depreciation of most currencies against the US dollar. The consequent increase in borrowing costs also stressed high levels of public and private debt, threatening the financial system. Faced with the prospects of global stagflation, nations, feeling compelled to protect their respective economic space, slowed cross-border trade, which posed the fourth challenge to growth. All along, the fifth challenge was festering as China experienced a considerable slowdown induced by its policies. The sixth medium-term challenge to growth was seen in the scarring from the pandemic brought in by the loss of education and income-earning opportunities. A simultaneous occurrence of several challenges to growth is perhaps unprecedented. Like the rest of the world, India, too, faced this extraordinary set of challenges but withstood them better than most economies.
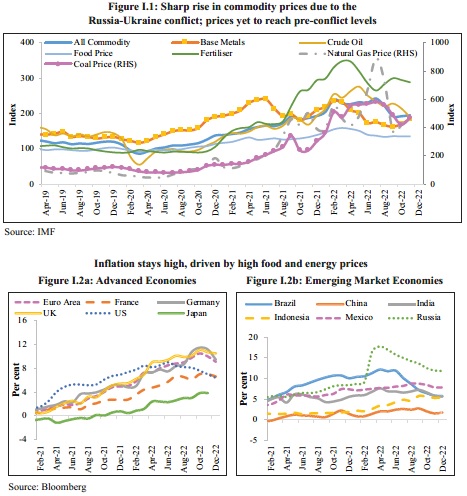
1.3 Global economic recovery was well on track until the Russia-Ukraine conflict broke out in February 2022. The conflict has now continued for almost a year, disrupting the restoration of the supply chains disrupted earlier by lockdowns and limited trade traffic. In the last eleven months, the world economy has faced almost as many disruptions as caused by the pandemic in two years. The conflict caused the prices of critical commodities such as crude oil, natural gas, fertilisers, and wheat to soar. This strengthened the inflationary pressures that the global economic recovery had triggered, backed by massive fiscal stimuli and ultra-accommodative monetary policies undertaken to limit the output contraction in 2020. Inflation in Advanced Economies (AEs), which accounted for most of the global fiscal expansion and monetary easing, breached historical highs. Rising commodity prices also led to higher inflation in the Emerging Market Economies (EMEs), which otherwise were in the lower inflation zone by virtue of their governments undertaking a calibrated fiscal stimulus to address output contraction in 2020.
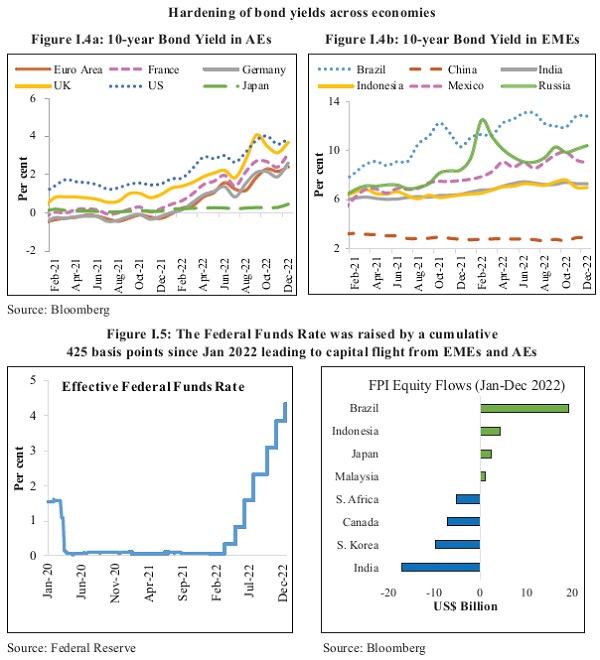
1.4 Central banks, which were slow to react to price pressures building up during the nascent recovery from the pandemic, regarded them as transient only to realise, belatedly, the necessity and the inevitability of a strong monetary policy response. Led by the US Federal Reserve, central banks have been hiking policy rates and rolling back liquidity to rein in inflation synchronously. The pace of this tightening cycle has been rapid – the Federal Reserve’s pace of rate hikes is the quickest since the inflationary episode of the 1970s, with the central bank having raised interest rates by 425 basis points since March 2022. As the impact of monetary policy actions is felt with a lag, inflation rates remained stubbornly high during the early phase of the rate hike cycle but have begun to decline lately. At the same time, synchronised rate hikes by the central banks have not tightened financial conditions sufficiently enough for central banks to end their tightening campaign.
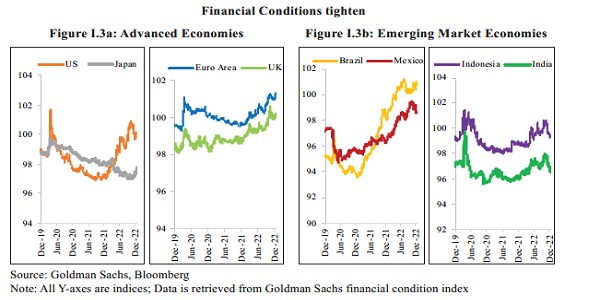
1.5 Inflation and monetary tightening led to a hardening of bond yields across economies and resulted in an outflow of equity capital from most of the economies around the world into the traditionally safe-haven market of the US. Unlike the past when the capital flight was more out of the EMEs given their relatively greater vulnerabilities, or the perception thereof, this time around, capital has also flown out from the advanced economies. The capital flight subsequently led to the strengthening of the US Dollar against other currencies – the US Dollar index strengthened by 16.1 per cent between January and September 2022. The consequent depreciation of other currencies has been widening the CAD and increasing inflationary pressures in the net importing economies.
1.6 Rising inflation and monetary tightening led to a slowdown in global output beginning in the second half of 2022. The global PMI composite index has been in the contractionary zone since August 2022, while the yearly growth rates of global trade, retail sales, and industrial production have significantly declined in the second half of 2022. The consequent dampening of the global economic outlook, also compounded by expectations of a further increase in borrowing costs, was reflected in the lowering of growth forecasts by the IMF in its October 2022 update of the World Economic Outlook (WEO).
| Growth Projections(per cent) | Change from WEo Update(July 2022) (per cent) | |||
| 2022 | 2023 | 2022 | 2023 | |
| World | 3.2 | 2.7 | 0 | –0.2 |
| Advanced Economies | 2.4 | 1.1 | –0.1 | –0.3 |
| United States | 1.6 | 1 | –0.7 | 0 |
| Euro Area | 3.1 | 0.5 | 0.5 | –0.7 |
| UK | 3.6 | 0.3 | 0.4 | –0.2 |
| Japan | 1.7 | 1.6 | 0 | –0.1 |
| Emerging Market Economies | 3.7 | 3.7 | 0.1 | –0.2 |
| China | 3.2 | 4.4 | –0.1 | –0.2 |
| India* | 6.8 | 6.1 | –0.6 | 0 |
Source: IMF
Note: Projection for India is for its fiscal year (Apr-Mar), while for the other economies, it is from Jan-Dec.

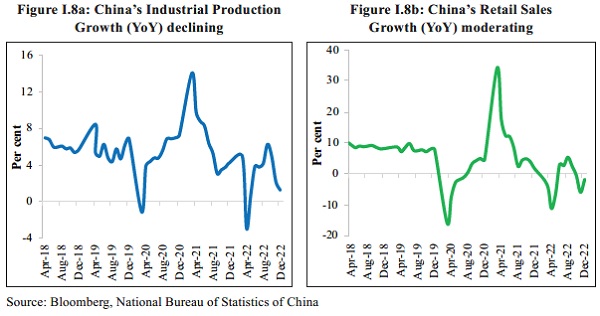
1.7 Compounding the bleak global growth outlook have been the slowdown in economic activity in China caused by the government’s zero Covid policy, a contracting real estate sector, and a tepid fiscal expansion. However, China has ended or relaxed most of its restrictive policies relating to Covid. It is possible that economic activity picks up in China sooner than expected. But it is too soon to tell.
1.8 Further tightening of monetary policy may aggravate fragilities built up in the financial system over the years, such as private and government debt structures, the effects of which could trigger financial contagion. Non-financial sector debt of most economies has increased considerably as a percentage of GDP since Q1 of 2008 when the global financial crisis struck. India is, however, one of the few countries whose debt burden has declined over this period, mainly because of the country’s banking sector balance sheet clean-up and the corporate sector’s deleveraging exercise undertaken during the last decade. Yet, an increase in the general government debt burden in India has attracted much attention, even as systemic risks of a financial breakdown are concentrated in other parts of the world.
Table I.2: Core Debt of most major economies except |
India is higher as compared to 2008 |
|||||||
Core debt of the non-financial sector |
Change since Q2 2008 |
|||||||
(Q2 2022, % of GDP) |
||||||||
Debt/GDP (Avg %) |
Household |
Pvt Non- Financial |
Government |
Total |
Household |
Pvt Non-
|
Government |
Total |
Global Avg |
62 |
160 |
88 |
248 |
-4 |
15 |
27 |
38 |
Australia |
117 |
181 |
52 |
232 |
7 |
-9 |
42 |
33 |
Brazil |
35 |
88 |
91 |
179 |
17 |
-36 |
28 |
66 |
Mainland China |
62 |
220 |
74 |
295 |
43 |
107 |
47 |
155 |
France |
67 |
231 |
114 |
345 |
19 |
71 |
47 |
118 |
Germany |
56 |
128 |
67 |
195 |
-4 |
0.4 |
2 |
3 |
Italy |
43 |
113 |
151 |
264 |
4 |
-4 |
47 |
43 |
Japan |
69 |
187 |
238 |
426 |
9 |
29 |
94 |
122 |
South Korea |
106 |
222 |
45 |
268 |
35 |
61 |
23 |
84 |
Mexico |
16 |
40 |
41 |
81 |
3 |
12 |
20 |
33 |
South Africa |
35 |
67 |
71 |
138 |
-9 |
-13 |
45 |
32 |
Spain |
57 |
155 |
118 |
273 |
-26 |
-56 |
82 |
26 |
UK |
84 |
150 |
107 |
257 |
-11 |
-28 |
62 |
34 |
US |
76 |
155 |
108 |
264 |
-22 |
-15 |
48 |
33 |
Source: BIS (based on information from their 5th December 2022 update of ‘Credit to the non-financial sector’)
1.9 In the developed world, inflationary pressures are abating but they are still on the higher side historically and relative to the inflation targets that many countries have adopted. Major central banks have reduced the pace of interest rate hikes in their latest rounds of monetary policy reviews to assess the impact thus far. Still, they have reiterated that terminal policy rates will be significantly higher than market expectations. Strong employment data and sharply lower headline inflation for December have raised hopes of the US economy achieving a softer landing. Similarly, in Europe, warmer winter weather has neutralised the risk of a near-term energy crisis. Lately, however, banks have reported much weaker earnings growth, and technology companies have begun to announce layoffs in America. Therefore, on balance, downside risk to the global economic outlook dominates.
Macroeconomic and Growth challenges in the Indian Economy
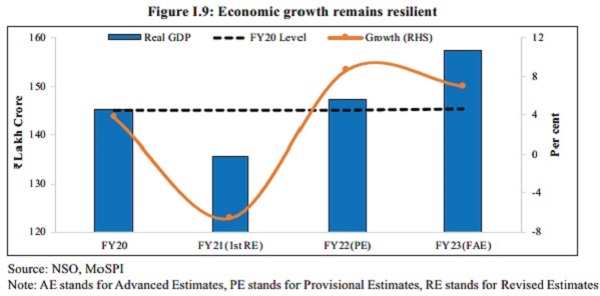
1.10 The impact of the pandemic on India was seen in a significant GDP contraction in FY21. The following year, FY22, the Indian economy started to recover despite the Omicron wave of January 2022. This third wave did not affect economic activity in India as much as the previous waves of the pandemic did since its outbreak in January 2020. Mobility enabled by localised lockdowns, rapid vaccination coverage, mild symptoms and quick recovery from the virus contributed to minimising the loss of economic output in the January-March quarter of 2022. Consequently, output in FY22 went past its pre-pandemic level in FY20, with the Indian economy staging a full recovery ahead of many nations. The experience with the Omicron variant engendered a cautious optimism that it was possible to stay physically mobile and engage in economic activities despite the pandemic. FY23 thus opened with a firm belief that the pandemic was rapidly on the wane and that India was poised to grow at a fast pace and quickly ascend to the pre-pandemic growth path.
–
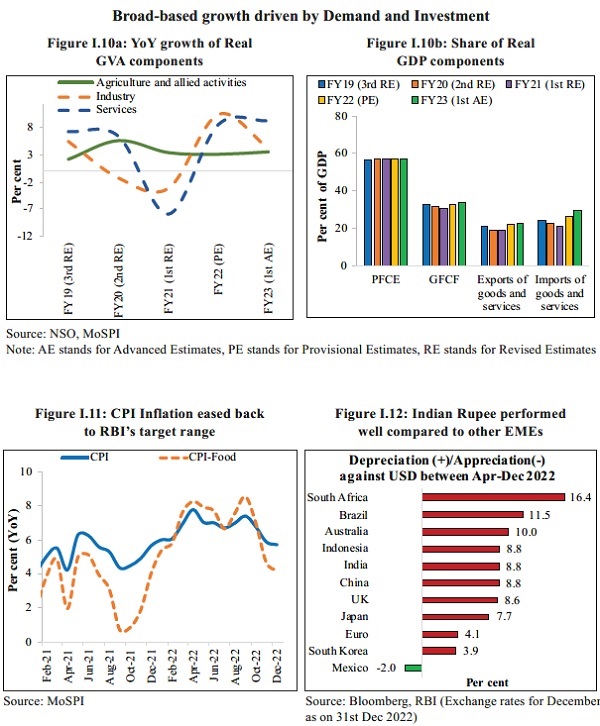
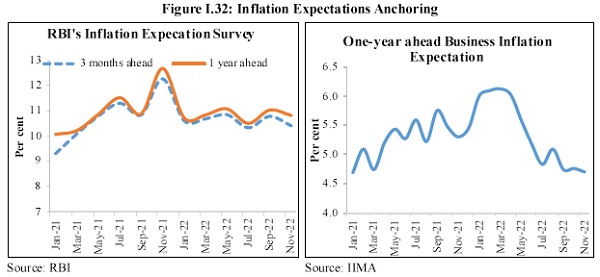
1.11 However, the conflict in Europe necessitated a revision in expectations for economic growth and inflation in FY23. The country’s retail inflation had crept above the RBI’s tolerance range in January 2022. It remained above the target range for ten months before returning to below the upper end of the target range of 6 per cent in November 2022. During those ten months, rising international commodity prices contributed to India’s retail inflation as also local weather conditions like excessive heat and unseasonal rains, which kept food prices high. The government cut excise and customs duties and restricted exports to restrain inflation while the RBI, like other central banks, raised the repo rates and rolled back excess liquidity.
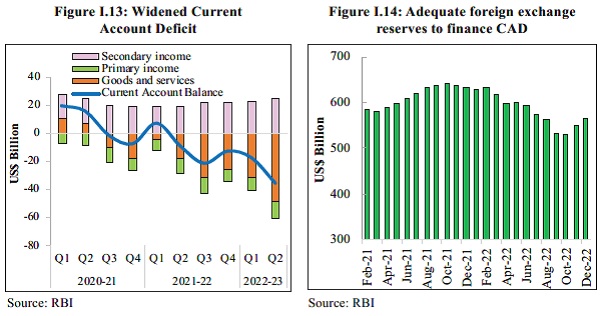
1.12 With monetary tightening, the US dollar has appreciated against several currencies, including the rupee. However, the rupee has been one of the better-performing currencies worldwide, but the modest depreciation it underwent may have added to the domestic inflationary pressures besides widening the CAD. Global commodity prices may have eased but are still higher compared to pre-conflict levels. They have further widened the CAD, already enlarged by India’s growth momentum. For FY23, India has sufficient forex reserves to finance the CAD and intervene in the forex market to manage volatility in the Indian rupee.
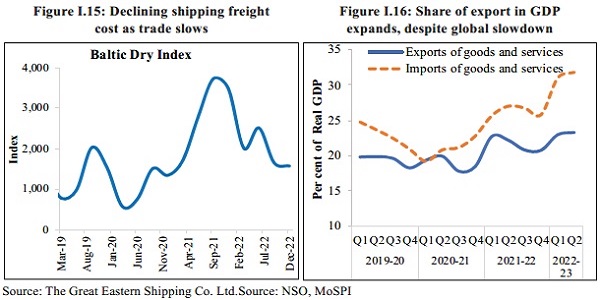
1.13 For many countries around the world, including India, 2021 was a period of recovery for health and economies from the impact of the pandemic. For the advanced economies, in particular, the enormous fiscal stimulus earlier injected by their governments supported a strong demand revival. Growth in world trade subsequently followed, of which India was also a beneficiary. India’s exports surged in FY22, and the momentum lasted up to the first half of FY23. Export growth was strong enough to increase India’s share in the world market of merchandise exports. However, due to aggressive and synchronised monetary tightening, global economic growth has started to slow, and so has world trade. As per United Nations Conference on Trade and Development (UNCTAD) latest global trade update, global trade growth turned negative during the H2:2022, and geopolitical frictions, persisting inflationary pressures, and subdued demand are expected to suppress global trade further in 2023. This is likely to affect many countries, including India, with the prospects of sluggish exports continuing into FY24, compared to the promise shown at the beginning of the current year.
India’s economic Resilience and Growth Drivers
1.14 Monetary tightening by the RBI, the widening of the CAD, and the plateauing growth of exports have essentially been the outcome of geopolitical strife in Europe. As these developments posed downside risks to the growth of the Indian economy in FY23, many agencies worldwide have been revising their growth forecast of the Indian economy downwards. These forecasts, including the advance estimates released by the NSO, now broadly lie in the range of 6.5-7.0 per cent. Despite the downward revision, the growth estimate for FY23 is higher than for almost all major economies and even slightly above the average growth of the Indian economy in the decade leading up to the pandemic. IMF estimates India to be one of the top two fast-growing significant economies in 2022. Despite strong global headwinds and tighter domestic monetary policy, if India is still expected to grow between 6.5 and 7.0 per cent, and that too without the advantage of a base effect, it is a reflection of India’s underlying economic resilience; of its ability to recoup, renew and re-energise the growth drivers of the economy.
1.15 India’s economic resilience can be seen in the domestic stimulus to growth seamlessly replacing the external stimuli. The growth of exports may have moderated in the second half of FY23. However, their surge in FY22 and the first half of FY23 induced a shift in the gears of the production processes from mild acceleration to cruise mode. Manufacturing and investment activities consequently gained traction. By the time the growth of exports moderated, the rebound in domestic consumption had sufficiently matured to take forward the growth of India’s economy. Private Consumption as a percentage of GDP stood at 58.4 per cent in Q2 of FY23, the highest among the second quarters of all the years since 2013-14, supported by a rebound in contact-intensive services such as trade, hotel and transport, which registered sequential growth of 16 per cent in real terms in Q2 of FY23 compared to the previous quarter.
1.16 Although domestic consumption rebounded in many economies, the rebound in India was impressive for its scale. It contributed to a rise in domestic capacity utilisation. Domestic private consumption remains buoyant in November 2022, as indicated by Motilal Oswal’s Economic Activity Index. The index estimates that private consumption grew at a five-month high pace of 5.6 per cent YoY, driven by auto sales and broad-based expansion of services.2
1.17 The near-universal coverage of vaccination in India overseen by the government was the single most important reason that brought people out to the streets to re-experience the “bazaar” as the marketplace was rapidly populated with service providers returning to resume business. The contact-based service providers like restaurants, hotels, shopping malls, cinemas, and tourist destinations, among others, soon ran up a thriving business and have significantly contributed to keeping up the consumer sentiments, as captured in repeated surveys. If, on the one hand, the universal vaccination coverage saved lives, on the other, it served as a health stimulant to raise consumer sentiments and thus the recovery and growth of the economy.
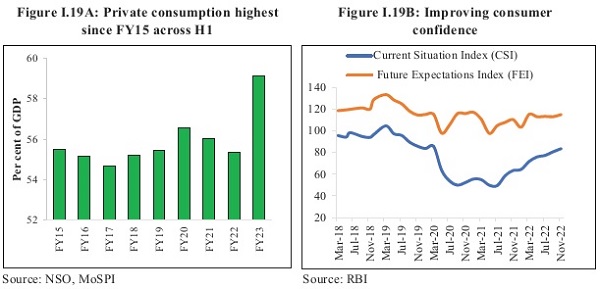
1.18 The rebound in consumption has also been supported by the release of “pent-up” demand, a phenomenon not again unique to India but nonetheless exhibiting a local phenomenon influenced by a rise in the share of consumption in disposable income. Since the share of consumption in disposable income is high in India, a pandemic-induced suppression of consumption built up that much greater recoil force. Hence, the consumption rebound may have lasting power. Accelerating growth in personal loans in India testifies to an enduring release of “pent-up” demand for consumption. RBI’s most recent survey3 of consumer confidence released in December 2022 pointed to improving sentiment with respect to current and prospective employment and income conditions.
1.19 The “release of pent-up demand” was reflected in the housing market too. Demand for housing loans picked up. Consequently, housing inventories have declined, prices are firming up, and construction of new dwellings is picking up pace. This has stimulated innumerable backward and forward linkages that the construction sector is known to carry. The universalisation of vaccination coverage also has a significant role in lifting the housing market as, in its absence, the migrant workforce could not have returned to construct new dwellings.
1.120 Apart from housing, construction activity, in general, has significantly risen in FY23 as the much-enlarged capital budget (Capex) of the central government and its public sector enterprises is rapidly being deployed. Going by the Capex multiplier estimated for the country, the economic output of the country is set to increase by at least four times the amount of Capex.4,5 States, in aggregate, are also performing well with their Capex plans. Like the central government, states also have a larger capital budget supported by the centre’s grant-in-aid for capital works and an interest-free loan repayable over 50 years.
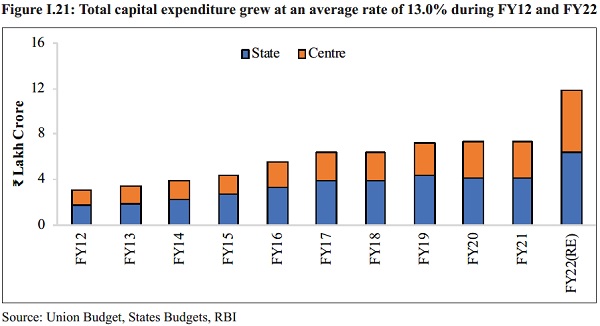
1.21 A capex thrust in the last two budgets of the Government of India was not an isolated initiative meant only to address the infrastructure gaps in the country. It was part of a strategic package aimed at crowding-in private investment into an economic landscape broadened by the vacation of non-strategic PSEs (disinvestment) and idling public sector assets. Three developments support this6. First, the significant increase in the Capex budget in FY23, as well as its high rate of spending. Second, direct tax revenue collections have been highly buoyant, and so have GST collections, which should ensure the full expending of the Capex budget within the budgeted fiscal deficit. The growth in revenue expenditure has also been limited to pave the way for higher growth in Capex. Third, the pick-up in private sector investment since the January-March quarter of 2022. Evidence shows an increasing trend in announced projects and capex spending by the private players. Surveys of leading industry CEOs also reveal their plans and commitment to increasing Capex.
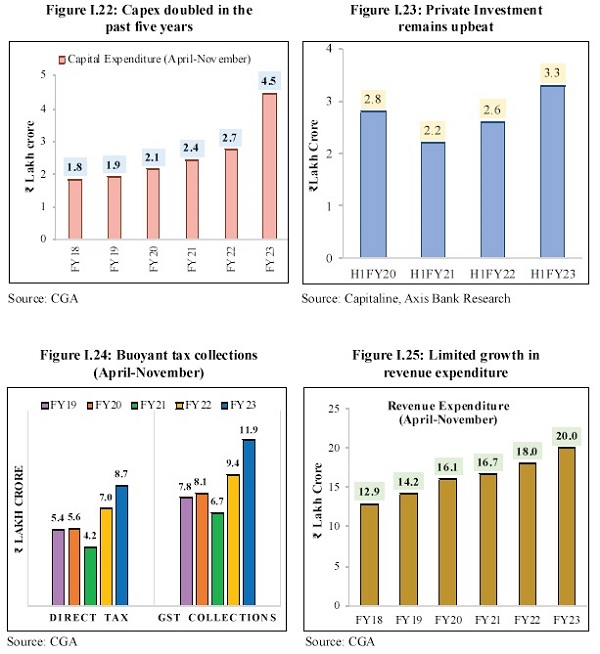
1.22 While an increase in export demand, rebound in consumption, and public capex have contributed to a recovery in the investment/manufacturing activities of the corporates, their stronger balance sheets have also played a big part equal measure to realising their spending plans. As per the data on non-financial debt from the Bank for International Settlements, in the course of the last decade, Indian non-financial private sector debt and non-financial corporate debt as a share of GDP declined by nearly thirty percentage points. This limited the increase in interest costs, which, together with possible savings on overheads during lockdowns, contributed to the recent fortification of corporate balance sheets by higher profits. In FY22, the surge in exports also contributed to increasing profits in the corporate world. After-tax profits were also boosted by the lower taxes announced in 2019. Better profitability helped corporates pay down debt. Consequently, not only do corporates have more scope to borrow now, but their improved financial health has also reassured their prospective lenders to expand their credit portfolios. As per Axis Bank Business and Economic Research, Capex by the Corporate sector increased to ₹3.3 lakh crore in H1 of FY23, driven by heavy investments in electricity, steel, chemicals, auto and pharmaceuticals sectors.
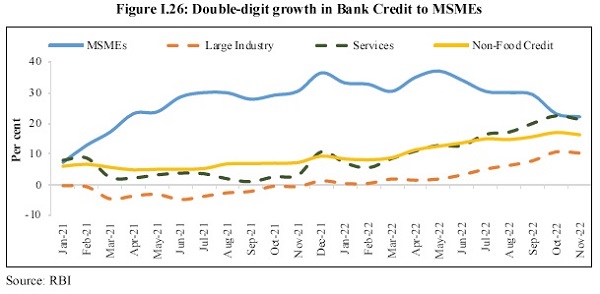
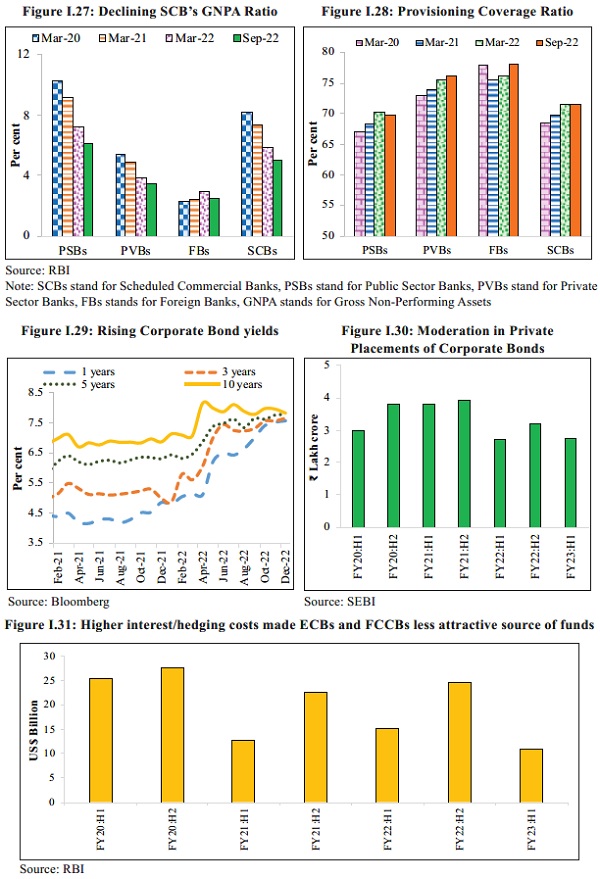
1.23 The banking sector in India has responded in equal measure to the demand for credit. The Year-on-Year growth in credit since the January-March quarter of 2022 has moved into double-digits and is rising across most sectors. The credit growth to the MSME sector has been remarkably high, over 30.5 per cent, on average, during Jan-Nov 2022, supported by the extended ECLGS of the central government. The aggressive supply of credit by the banking sector has as much been triggered by their improved financial health as that of the corporates. The finances of the public sector banks have seen a significant turnaround, with profits being booked at regular intervals and their Non-Performing Assets (NPAs) being fast-tracked for quicker resolution/liquidation by the Insolvency and Bankruptcy Board of India (IBBI). At the same time, the government has been providing adequate budgetary support for keeping the PSBs well-capitalized, ensuring that their Capital Risk-Weighted Adjusted Ratio (CRAR) remains comfortably above the threshold levels of adequacy. The successful macro stress tests performed on the banking sector further testify to its financial strength. It does help that the banking sector has negligible cross-border claims in times when currency risk is high. Nonetheless, financial strength has helped banks make up for lower debt financing provided by corporate bonds and External Commercial Borrowings (ECBs) so far in FY23. Rising yields on corporate bonds and higher interest/hedging costs on ECBs have made these instruments less attractive than the previous year.
–
1.24 RBI has projected headline inflation at 6.8 per cent in FY23, which is outside its target range. At the same time, it is not high enough to deter private consumption and also not so low as to weaken the inducement to invest. Moderately high inflation has further ensured the anchoring of inflationary expectations preventing prices from weakening demand and growth in India. Additionally, with inflation on the declining path, the interest cost of domestic credit will likely decline, inducing a further increase in demand for credit by corporates and retail borrowers.
India’s Inclusive Growth
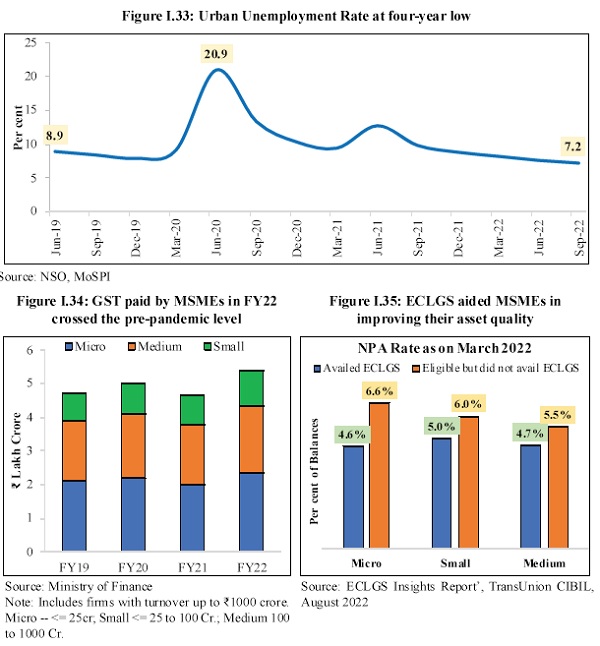
1.25 Growth is inclusive when it creates jobs. Both official and unofficial sources confirm that employment levels have risen in the current financial year. The Periodic Labour Force Survey (PLFS) shows that the urban unemployment rate for people aged 15 years and above declined from 9.8 per cent in the quarter ending September 2021 to 7.2 per cent one year later (quarter ending September 2022). This is accompanied by an improvement in the labour force participation rate (LFPR) as well, confirming the emergence of the economy out of the pandemic-induced slowdown early in FY23. Job creation appears to have moved into a higher orbit with the initial surge in exports, a strong release of the “pent-up” demand, and a swift rollout of the capex. Since export growth is plateauing and the “pent-up” release of demand will have a finite life, it is essential that capex continues to grow to facilitate employment in the economy, at least until such time the global economy rebounds and, through the export channel, provides an additional window to India for job creation. Thankfully, the private sector has all the necessary pre-conditions lined up to step up to the plate and do the capex heavy lifting. Their internal resource generation is good, capacity utilisation is high, and the demand outlook continues to improve. Capital markets are willing to finance new investments, as are financial institutions.
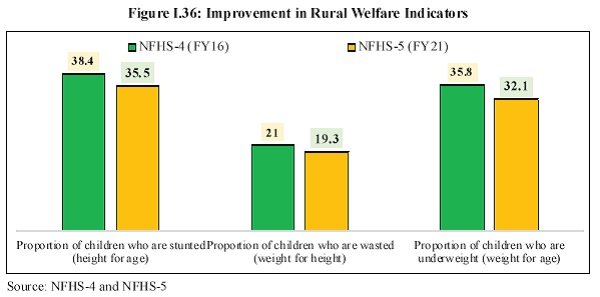
1.26 In FY21, the Government announced the Emergency Credit Line Guarantee Scheme. The scheme has succeeded in shielding micro, small and medium enterprises from financial distress. A recent CIBIL report (ECLGS Insights, August 2022) showed that the scheme has supported MSMEs in facing the covid shock, with 83 per cent of the borrowers that availed of the ECLGS being micro-enterprises. Among these micro units, more than half had an overall exposure of less than ₹10 lakh. Furthermore, CIBIL data also shows that ECLGS borrowers had lower non-performing asset rates than enterprises that were eligible for ECLGS but did not avail of it. Further, the GST paid by MSMEs after declining in FY21 has been rising since and now has crossed the pre-pandemic level of FY20, reflecting the financial resilience of small businesses and the effectiveness of the pre-emptive government intervention targeted towards MSMEs.
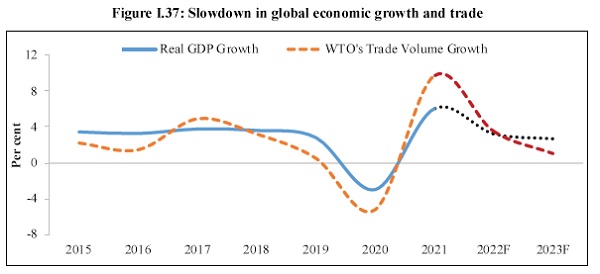
1.27 The scheme implemented by the government under the Mahatma Gandhi National Rural Employment Guarantee Act (MGNREGA) has been rapidly creating more assets in respect of “Works on individual’s land” than in any other category. The share of this category rose to about 60 per cent in FY22, indicating that MGNREGA, besides generating daily wage employment, has also been creating assets for individual households to diversify their sources of income and lift their supplementary incomes. Details on asset creation under MGNREGA are further discussed in Chapters 6 “Social Infrastructure and Employment: Big Tent”. In addition, schemes like PM-KISAN, which benefits households covering half the rural population, and PM Garib Kalyan Anna Yojana have significantly contributed to lessening impoverishment in the country. The UNDP Report of July 2022 stated that the recent inflationary episode in India would have a low poverty impact due to well-targeted support. In addition, the National Family Health Survey (NFHS) in India shows improved rural welfare indicators from FY16 to FY20, covering aspects like gender, fertility rate, household amenities, and women empowerment.
1.28 The year FY23 so far for India has reinforced the country’s belief in its economic resilience. The economy has withstood the challenge of mitigating external imbalances caused by the Russian-Ukraine conflict without losing growth momentum in the process. India’s stock markets had a positive return in CY22, unfazed by withdrawals by foreign portfolio investors. India’s inflation rate did not creep too far above its tolerance range compared to several advanced nations and regions. A relatively higher growth forecast among major economies, projected retail inflation only slightly higher than the tolerance limit, and an estimated current account deficit financeable with normal capital inflows and forex reserves large enough to finance close to a year’s imports are clear evidence of economic resilience amidst a global polycrisis. Strong consumption rebound, robust revenue collections, sustained capex in both the public and the private sector, growing employment levels in the urban as well as the rural areas, and targeted social security measures further underpin the prospects for economic and social stability and sustained growth. India is the third-largest economy in the world in PPP terms and the fifth-largest in market exchange rates. As expected of a nation of this size, the Indian economy in FY23 has nearly “recouped” what was lost, “renewed” what had paused, and “re-energised” what had slowed during the pandemic and since the conflict in Europe.
outlook: 2023-24
1.29 India’s recovery from the pandemic was relatively quick, and growth in the upcoming year will be supported by solid domestic demand and a pickup in capital investment. The current growth trajectory will be supported by multiple structural changes that have been implemented over the past few years. The private sector – financial and non-financial – was repairing balance sheets, which led to a slowdown in capital formation in the previous decade. The financial system stress experienced in the second decade of the millennium, evidenced by rising non¬performing assets, low credit growth and declining growth rates of capital formation, caused by excessive lending witnessed in the first decade-plus, is now behind us. Aided by healthy financials, incipient signs of a new private sector capital formation cycle are visible. More importantly, compensating for the private sector’s caution in capital expenditure, the government raised capital expenditure substantially. Budgeted capital expenditure rose 2.7X in the last seven years, from FY16 to FY23, re-invigorating the Capex cycle. Structural reforms such as the introduction of the Goods and Services Tax and the Insolvency and Bankruptcy Code enhanced the efficiency and transparency of the economy and ensured financial discipline and better compliance.
Source: IMF, WTO
Note: F stands for Forcast
1.30 Even as India’s outlook remains bright, global economic prospects for the next year have been weighed down by the combination of a unique set of challenges expected to impart a few downside risks. Multi-decadal high inflation numbers have compelled central banks across the globe to tighten financial conditions. The impact of monetary tightening is beginning to show in slowing economic activity, especially in Advanced Economies. Besides this, adverse spillovers from the prolonged strains in supply chains and heightened uncertainty due to geo-political conflict have further deteriorated the global outlook. Hence, global growth is forecasted to slow from 3.2 per cent in 2022 to 2.7 per cent in 2023 as per IMF’s World Economic Outlook, October 2022. A slower growth in economic output coupled with increased uncertainty will dampen trade growth. This is seen in the lower forecast for growth in global trade by the World Trade Organisation, from 3.5 per cent in 2022 to 1.0 per cent in 2023.
1.31 On the external front, risks to the current account balance stem from multiple sources. While commodity prices have retreated from record highs, they are still above pre-conflict levels. Strong domestic demand amidst high commodity prices will raise India’s total import bill and contribute to unfavourable developments in the current account balance. These may be exacerbated by plateauing export growth on account of slackening global demand. Should the current account deficit widen further, the currency may come under depreciation pressure.
1.32 Another risk to the outlook originates from the ongoing monetary tightening exercise. While the pace of rate hikes has slowed, major central banks have reaffirmed their hawkish stance on inflation. Entrenched inflation may prolong the tightening cycle, and therefore, borrowing costs may stay ‘higher for longer’. In such a scenario, global economy may be characterised by low growth in FY24. However, the scenario of subdued global growth presents two silver linings – oil prices will stay low, and India’s CAD will be better than currently projected. The overall external situation will remain manageable.
1.33 The upside to India’s growth outlook arises from (i) limited health and economic fallout for the rest of the world from the current surge in Covid- 19 infections in China and, therefore, continued normalisation of supply chains; (ii) inflationary impulses from the reopening of China’s economy turning out to be neither significant nor persistent; (iii) recessionary tendencies in major AEs triggering a cessation of monetary tightening and a return of capital flows to India amidst a stable domestic inflation rate below 6 per cent; and (iv) this leading to an improvement in animal spirits and providing further impetus to private sector investment.
1.34 Against this backdrop, the survey projects a baseline GDP growth of 6.5 per cent in real terms in FY24. The projection is broadly comparable to the estimates provided by multilateral agencies such as the World Bank, the IMF, and the ADB and by RBI, domestically. The actual outcome for real GDP growth will probably lie in the range of 6.0 per cent to 6.8 per cent, depending on the trajectory of economic and political developments globally.
******


