Post the massive, unexpected disruption to human lives caused by the global pandemic, the year 2022 was when humanity once again picked up the threads and took small steps to get back to a semblance of normalcy. However, the challenges posed by the aftermath of this crisis, subsequent waves of the pandemic and the ensuing Russia-Ukraine conflict have impacted the global as well as India’s development trajectory. There was a stress on key aspects of social well being of citizens such as health, education and social security etc. and the Government stepped in to continue its support towards social infrastructure development. Standing on the brink of FY23, various indicators of social development appear to have recouped. Focus on long-term goals of human development and “sabka sath, sabka vikas” have assumed salience. The social sector expenditure outlay of the Centre and State Governments has increased steadily to stand at ₹21.3 lakh crore in FY23 (BE), with its share in total General Government expenditure standing at 26.6 per cent.
Demonstrating the on-track progress to attain Sustainable Development Goal (SDG) of halving poverty by 2030, more than 41 crore people exited poverty between 2005-06 and 2019-21 according to the UN Mutilidimensional Poverty Index. Bouquet of social protection schemes, customised for different sections of the population such as elderly, unorganised workers, have been prioritised ensuring a shield of dignity for every member of society. The special focus on aspirational districts has resulted in steady improvements across health, education, financial inclusion, and basic infrastructure. Transforming welfare through technology, Aadhaar and JAM trinity have revolutionalised the universe of state-citizen interaction, enabling targeted delivery of Direct Benefit Transfers (DBT) through 318 Central schemes and over 720 State DBT schemes, seamless portability of ration card across States through ‘One Nation One Ration Card’ and national database of unorganised workers ‘eShram portal’. The broad-based improvement in employment indicators is observed in data covering both the supply side and demand side of the labour market.
Labour markets have recovered beyond pre-Covid levels, in both urban and rural areas, as observed in supply-side and demand-side employment data. Quarterly urban employment data shows progress beyond pre-pandemic levels as the unemployment rate declined from 8.3 per cent in July-September 2019 to 7.2 per cent in July-September 2022. Reflecting rising formalisation of employment, net addition to EPFO payroll is steadily moving upward after swiftly rebounding from Covid-19, with the majority share coming from the youth. As per Annual Survey of Industries 2019-20, employment in the organised manufacturing sector has maintained a steady upward trend over time, with the employment per factory also increasing gradually. Employment has been rising faster in factories employing more than 100 workers than in smaller ones, suggesting scaling up of manufacturing units. Year-on-Year (YoY) decline in monthly demand for Mahatma Gandhi National Rural Employment Guarantee Scheme (MGNREGS) work is emanating from normalisation of the rural economy due to strong agricultural growth and a swift bounce-back from Covid-19.
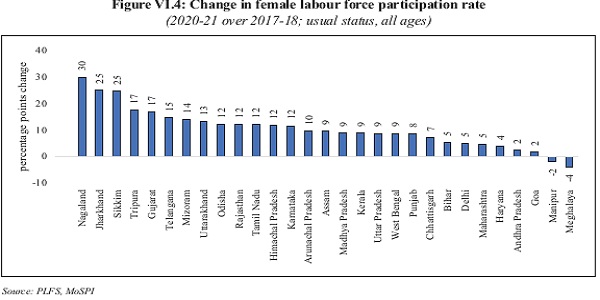
The noticeable rise in Rural Female Labour Force Participation Rate (FLFPR) from 19.7 per cent in 2018-19 to 27.7 per cent in 2020-21 is a positive development. Notably, India’s female LFPR is likely to be underestimated, with reforms in survey design and content required to capture the reality of working females more accurately. Self-Help Groups (SHGs), having demonstrated their resilience and flexibility during Covid, can be an effective conduit to tap the rising willingness of females to work. The 1.2 crore SHGs, comprising of 88 per cent all women SHGs, cater to 14.2 crore households.
On the human capital formation front, the twin pillars of education and health are being strengthened from the core. Within the progressive framework of the National Education Policy (NEP), the improvement in basic facilities in schools and the rising availability of teachers is expected to yield dividends which will enrich the nation’s growth and development prospects in the decades to come. The Government has also strengthened the health infrastructure and prepared itself to address present and future needs . Ensuring the provision of quality health facilities to citizens, the share of government health expenditure in total health expenditure has increased from 28.6 per cent in FY14 to 40.6 per cent in FY19, with a concomitant decline in out-of-pocket expenditure as a percentage of total health expenditure from 64.2 per cent in FY14 to 48.2 per cent in FY19. Augmenting the rural public healthcare system, the number of Sub-centres, Primary Health Centres (PHCs), and Community Health Centres (CHCs) have improved substantially, along with a rise in doctors, nurses, and other medical personnel in the past eight years. Consequently, a host of health-related indicators such as institutional births, immunisation and, coverage of health insurance, have witnessed an uptrend, as borne out by National Family Health Survey (NFHS) data. The progress of the path-breaking Ayushman Bharat programme, with nearly 22 crore beneficiaries, is being further tech-enabled through digital health IDs ‘ABHA’ and telemedicine through e-Sanjeevani.
In the Amrit Kaal, the lives of two-thirds of the Indian populace residing in rural India look remarkably better than a few years back, aided by the policy focus on basic amenities and efficient programme implementation. Outcome-oriented statistics concerning the quality of rural lives establish tangible progress in access to electricity, presence of improved drinking water sources, coverage under health insurance schemes, women empowerment, etc. The emphasis on digital land records through SVAMITVA is structural reform in rural land management and individual economic empowerment.
As India marches ahead, the ground lost as regards social sector improvements due to the pandemic has largely been recouped, powered by prompt policymaking and efficient implementation interwoven with technology. Going forward with the vision of ‘Minimum Government, Maximum Governance’, further developments will hold the key to attaining more equitable economic growth.
Introduction
6.1 The socio-economic milieu and unique ethos of India reside in the diverse and expansive populace transcending innumerable cultures, languages, and geographies, constituting the real wealth of the country. Realising the immense potential harboured by the young and aspirational citizens spanning numerous cities and villages requires ambitious vision and meticulous implementation, customising for the diversity of circumstances and special needs of different sections. The foundational services and structures that support society in availing various amenities important for a better quality of life, i.e the social infrastructure, indirectly contributes to economic development by laying the foundation for enhancement in income and employment opportunities, productivity growth, and technological advancement. That said, quality employment opportunities and working conditions are the essential instruments to chisel this potential into long-term sustainable growth. In its Amrit Kaal for the next 25 years, India envisions rewarding itself with the dividends that can come from demographics.
6.2 With the overall development of the economy, the concept of quality of life has enlarged to include many more elements than the traditional metrics of income (which determine the availability of basic requirements such as food and shelter) and education levels. It now encompasses access to clean drinking water, sanitation, employment prospects, health care, social security, connectivity, etc. All these together determine the quality of life. Research studies have concluded that quality of life depends upon the fulfilment of basic needs and being able to live in an affable environment.1 Cognisant of this fact, the Government places a high priority on the development of the social infrastructure of the country.
6.3 This is all the more pertinent in the contemporary scenario as India has adopted the UN SDGs 2030, which are a set of comprehensive, far-reaching, and people-centric universal and transformative goals and targets. Many of these seventeen goals concern the social well-being of individuals, resolving as follows:
“We resolve, between now and2030, to endpoverty and hunger everywhere; to combat inequalities within and among countries; to build peaceful, just, and inclusive societies; to protect human rights and promote gender equality and the empowerment of women and girls; and to ensure the lasting protection of the planet and its natural resources. We resolve also to create conditions for sustainable, inclusive and sustained economic growth, shared prosperity and decent work for all, taking into account different levels of national development and capacities.”2
6.4 The country continues to make good progress in increasing incomes and improving the standard of living over the past decades. As detailed in the chapter, many social indicators have continued to improve. The years 2020 and 2021 were the peak years of the pandemic, which tested the strength of the country’s social and health infrastructure, hampering education, loss of job opportunities, etc. Several measures were taken to meet the growing needs of the health pandemic during this time, extending into 2022. FY23 has been a year of rejuvenation for the sector, having withered the storm of the pandemic and come out stronger. Various dimensions of the sector are recouping lost grounds and are on the path of reenergising to meet the vision of “sabka sath, sabka vikas and sabka vishwas”.
6.5 India is entering the Amrit Kal with better-equipped schools, affordable healthcare, increasing formal employment, empowered women’s collectives, and far-reaching access to basic amenities such as sanitation, drinking water and electricity. This Chapter presents emerging evidence of the achievements on these fronts. It reviews the progress on the social infrastructure front and the enhancement of employment opportunities in the country. It covers various aspects of the social sector, including trends in the Government’s expenditure on the social sector; the progress on the human development front; multiple measures being taken to ensure basic necessities to all citizens; the trends in employment and education and measures to enhance the quality of life and governance in rural areas. It dwells on various Government initiatives towards attaining different SDGs and the outcomes thereof.
Social Sector Expenditure Keeping Pace with Growing importance of the Sector
6.6 The Government’s spending on social services3 has shown a rising trend since FY16 with a focus on many aspects of the social well-being of citizens of the country. The share of expenditure on social services in the total expenditure of the Government has been around 25 per cent from FY18 to FY20. It increased to 26.6 per cent in FY23 (BE). The social services expenditure witnessed an increase of 8.4 per cent in FY21 over FY20 and another 31.4 per cent increase in FY22 over FY21, being the pandemic years, which required enhanced outlay, especially in the health4 and education5 sectors. While the social sector expenditure outlay of the Centre and State governments was `12.8 lakh crore in FY19, it has increased steadily to stand at `21.3 lakh crore in FY23 (BE).
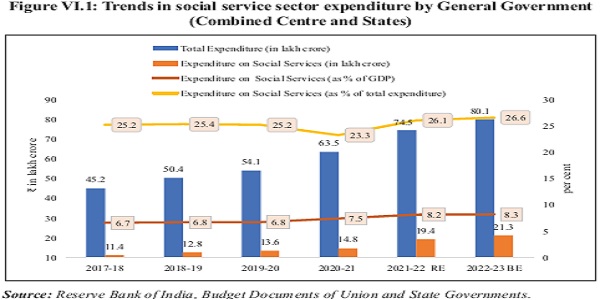
6.7 The share of expenditure on health in the total expenditure on social services, has increased from 21 per cent in FY19 to 26 per cent in FY23 (BE). The National Health Policy, 2017 envisages as its goal “the attainment of the highest possible level of health and well-being for all at all ages, through a preventive and promotive healthcare orientation in all developmental policies, and universal access to good quality healthcare services without anyone having to face financial hardship as a consequence. This would be achieved through increasing access, improving quality, and lowering the cost of healthcare delivery.” Accordingly, the policy recommended an increase in the Government’s health expenditure from the existing 1.2 per cent to 2.5 per cent of GDP by 2025. Also, the Fifteenth Finance Commission, in its report, had recommended that public health expenditure of Union and States together should be increased in a progressive manner to reach 2.5 per cent of GDP by 2025 (FFC report, para 9.41, iii). In keeping with this objective, Central and State Governments’ budgeted expenditure on the health sector reached 2.1 per cent of GDP in FY23 (BE) and 2.2 per cent in FY22 (RE), against 1.6 per cent in FY21.
Table VI.1: Trends in social services expenditure by General Government
(Combined Centre and States)
(` crore)
| Items 2015-16 2016-17 2017-18 2018-19 2019-20 2020-21 2021-22 RE 2022-23 BE | ||||||||
| Total Expenditure | 3760611 | 4265969 | 4515946 | 5040747 | 5410887 | 6353359 | 7453320 | 8008684 |
| Expenditure on Social Services | 915500 | 1040620 | 1139524 | 1278124 | 1364906 | 1479389 | 1944013 | 2132059 |
| of which: | ||||||||
| Education | 391881 | 434974 | 483481 | 526481 | 579575 | 575834 | 681396 | 757138 |
| Health | 175272 | 213119 | 243388 | 265813 | 272648 | 317687 | 516427 | 548855 |
| Others | 348348 | 392527 | 412655 | 485829 | 512683 | 585868 | 746191 | 826065 |
| As per cent of GDP | ||||||||
| Expenditure on Social Services | 6.6 | 6.8 | 6.7 | 6.8 | 6.8 | 7.5 | 8.2 | 8.3 |
| of which: | ||||||||
| Education | 2.8 | 2.8 | 2.8 | 2.8 | 2.9 | 2.9 | 2.9 | 2.9 |
| Health | 1.3 | 1.4 | 1.4 | 1.4 | 1.4 | 1.6 | 2.2 | 2.1 |
| Others | 2.5 | 2.6 | 2.4 | 2.6 | 2.6 | 3.0 | 3.2 | 3.2 |
| As per cent of total expenditure | ||||||||
| Expenditure on Social Services | 24.3 | 24.4 | 25.2 | 25.4 | 25.2 | 23.3 | 26.1 | 26.6 |
| of which: | ||||||||
| Education | 10.4 | 10.2 | 10.7 | 10.4 | 10.7 | 9.1 | 9.1 | 9.5 |
| Health | 4.7 | 5.0 | 5.4 | 5.3 | 5.0 | 5.0 | 6.9 | 6.9 |
| Others | 9.3 | 9.2 | 9.1 | 9.6 | 9.5 | 9.2 | 10.0 | 10.3 |
| As per cent of social services | ||||||||
| Education | 42.8 | 41.8 | 42.4 | 41.2 | 42.5 | 38.9 | 35.1 | 35.5 |
| Health | 19.1 | 20.5 | 21.4 | 20.8 | 20.0 | 21.5 | 26.6 | 25.7 |
| Others | 38.0 | 37.7 | 36.2 | 38.0 | 37.6 | 39.6 | 38.4 | 38.7 |
The ratios to GDP at current market prices are based on 2011-12 base till 2021-22.
GDP for 2022-23 is as per Union Budget 2022-23.
Sources: Budget Documents of Union and State Governments.
Social Infrastructure and Employment: Big Tent
Improving Human Development Parameters
6.8 ‘Human Development’ is the key enabler for upward social mobility. The challenges posed by the aftermath of the peak of the Covid-19 pandemic in 2020 and 2021 and the ensuing Russia-Ukraine conflict in 2022 have impacted the development trajectory of India and the world. In the wake of these developments, there was a global decline in human development. According to United Nations Development Programme (UNDP) report, 90 per cent of countries have registered a reduction in their Human Development Index (HDI)6 value in 2020 or 2021, indicating that human development across the world has stalled for the first time in 32 years. India ranked 132 out of 191 countries and territories in the 2021/2022 HDI report7. India’s HDI value of 0.633 in 2021 places the country in the medium human development category, lower than its value of 0.645 in 2019. However, India’s HDI value continues to exceed South Asia’s8 average human development. It has been steadily increasing and moving towards the world average since 1990 due to priority placed on investment in social infrastructure, including ensuring universal health and education.
6.9 On the parameter of gender inequality, India’s Gender Inequality Index (GII)9 value is 0.490 in 2021 and is ranked 122. This score is better than that of the South Asian region (value: 0.508) and close to the world average of 0.465. This reflects the Government’s initiatives and investments towards more inclusive growth, social protection, and gender-responsive development policies. The country’s progress in dealing with multidimensional poverty is presented in Box VI.1.
Table VI.2: India’s position and trends in the Global HDI 2021
| HDI 2021 | HDI Rank2020 |
Life expectancy at birth (years) |
Expected years of schooling (years) | Mean years of schooling(years) |
Gross national income per capita (2017 PPP $) |
||
| Rank | Value | ||||||
| Switzerland | 1 | 0.962 | 3 | 84.0 | 16.5 | 13.9 | 66,933 |
| Norway | 2 | 0.961 | 1 | 83.2 | 18.2 | 13.0 | 64,660 |
| United Kingdom | 18 | 0.929 | 17 | 80.7 | 17.3 | 13.4 | 45,225 |
| Japan | 19 | 0.925 | 19 | 84.8 | 15.2 | 13.4 | 42,274 |
| United States | 21 | 0.921 | 21 | 77.2 | 16.3 | 13.7 | 64,765 |
| China | 79 | 0.768 | 82 | 78.2 | 14.2 | 7.6 | 17,504 |
| Brazil | 87 | 0.754 | 86 | 72.8 | 15.6 | 8.1 | 14,370 |
| South Africa | 109 | 0.713 | 102 | 62.3 | 13.6 | 11.4 | 12,948 |
| Indonesia | 114 | 0.705 | 116 | 67.6 | 13.7 | 8.6 | 11,466 |
| India | 132 | 0.633 | 130 | 67.2 | 11.9 | 6.7 | 6,590 |
| South Asian region |
0.632 | 67.9 | 11.6 | 6.7 | 6,481 | ||
| World average | 0.732 | 71.4 | 12.8 | 8.6 | 16,752 | ||
Source: 2021/2022 Human Development Report, UNDP
Box VI.1: uNDP Multidimensional Poverty Index 2022
Generally, poverty is primarily measured in terms of lack of monetary means for a decent living. However, by definition ‘poverty’ has wider implications and leads to multiple disadvantages at the same time – such as poor health or malnutrition, lack of sanitation, clean drinking water or electricity, poor quality of education etc. Focusing on one factor alone, such as income, is not enough to capture the reality of poverty.
Multidimensional poverty measures are hence used to create a more comprehensive picture. It reveals who is poor and how they are poor and the range of different deprivations experienced by them.
One such measure is the United Nations Development Programme’s (UNDP) global Multidimensional Poverty Index (MPI) which measures acute multidimensional poverty across more than 100 developing countries. The methodology involves measuring each person’s overlapping deprivations across 10 indicators in three equally weighted dimensions: health, education, and standard of living. The health and education dimensions are based on two indicators each, while the standard of living is based on six indicators. All the indicators needed to construct the MPI for a country are taken from the same household survey. Each indicator is equally weighted within its dimension, so the health and education indicators are weighted 1/6 each, and the standard of living indicators are weighted 1/18 each. The MPI ranges from 0 to 1, and higher values imply higher multidimensional poverty. The MPI complements the international US$ 1.90-a-day poverty line by identifying who is multidimensionally poor and shows the composition of multidimensional poverty.
MPI for India
The 2022 report of the UNDP on MPI was released in October 2022 and covers 111 developing countries. As regards India, the survey data for 2019-21 has been used. Based on these estimates, 16.4 per cent of the population in India (228.9 million people in 2020) is multidimensionally poor while an additional 18.7per cent is classified as vulnerable to multidimensional poverty (260.9 million people in 2020). The intensity of deprivation in India, which is the average deprivation score among people living in multidimensional poverty, is 42 per cent. The MPI value, which is the share of the population that is multidimensionally poor adjusted by the intensity of the deprivations, is 0.069
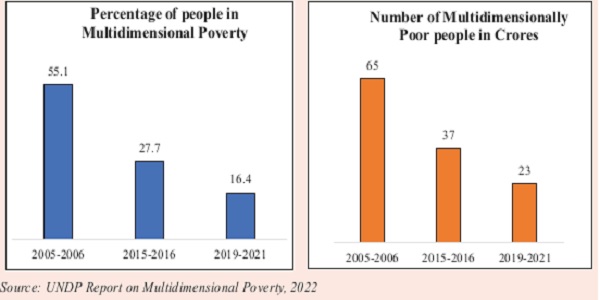
The report also compares multidimensional poverty with monetary poverty measured by the percentage of the population living below the 2011 PPP of US$1.90 per day. It shows that monetary poverty does not present the complete picture. The headcount or incidence of multidimensional poverty is 6.1 percentage points lower than the incidence of monetary poverty. This implies that individuals living below the monetary poverty line may have access to non-income resources. The findings of the report suggest that in India, 41.5 crore people exited poverty between 2005-06 and 2019-21, demonstrating that the SDG target 1.2 of reducing at least by half the proportion of men, women, and children of all ages living in poverty in all its dimensions according to national definitions by 2030 is possible to achieve. The poorest states and groups (children, lower castes and those living in rural areas) reduced poverty the fastest in absolute terms, although the data do not reflect post-Covid-19 pandemic changes. Among the multidimensionally poor, deprivation prevalence declined across deprivation categories.

Cting an example of how things are changing at the ground level, Dr. Sundipto Mundle, Chairman, Centre for Development Studies, in a newspaper article “Villages at the periphery and the changing face of backwardness”, Live Mint, 24 November 2022, informs about his visit to four backward villages in Jharkhand, and reports about considerable progress in physical infrastructure such as roads, houses, digital connectivity, adequate irrigation facilities, Public Distribution System (PDS), education facilities etc. With the intervention of the State and the general market development, extreme deprivation and hunger have been eliminated in these villages.10
Transformation of Aspirational Districts Programme
6.10 The Government of India launched the ‘Transformation of Aspirational Districts’ (Aspirational Districts Programme (ADP)) initiative in January 2018 with a vision of a New India by 2022 wherein the focus is to raise living standards of its citizens and ensuring inclusive growth of all in the burgeoning economy. The districts are prodded and encouraged first to catch up with the best district of their state, and subsequently aspire to become one of the best in the country, by competing with and learning from others in the spirit of competitive and cooperative federalism.
6.11 117 Aspirational Districts (ADs) across 28 States/UTs have been identified by NITI Aayog based upon composite indicators ranging from health and nutrition, education, agriculture, and water resources, financial inclusion and skill development, and basic infrastructure which have an impact on HDI. The broad contours of the programme are Convergence (of Central & State Schemes), Collaboration (of Central, State level Nodal Officers & District Collectors), and Competition among districts through monthly delta ranking; all driven by a mass movement.
6.12 With States as the main drivers, this programme focuses on the strength of each district, identifying low-hanging fruits for immediate improvement and measuring progress by ranking districts every month. The ranking is based on the incremental progress made across 49 Key Performance Indicators (KPI) under five broad socio-economic themes mentioned above.
6.13 NITI Aayog has developed a broad template for the formulation of district plans. Since different districts have different opportunities and challenges, they have been advised to customise the template. A primer comprising steps to be taken to improve each of the indicators, compiled from the inputs received from respective Ministries, has also been developed with the help of Central Ministries and the States and shared with district administration.
6.14 Achievements of the programme
(a) Many ADs have surpassed the average state values in several indicators under the Health and Nutrition theme monitored under the programme. For instance, in 10 indicators of health, 73 ADs have surpassed the state averages.
(b) The programme monitors progress across five focus sectors. All districts have made significant improvements across different indicators for instance, under Health and Nutrition, 46 districts have improved by up to 45 per cent, and 23 districts have improved by up to 69 per cent in critical indicators related to pregnant women’s health which have a bearing on the Maternal and Infant Mortality Rates such as frequency and coverage of antenatal care check-ups; regularity of supplementary nutrition intake by pregnant women, and timely Anaemia detection and treatment rate. Under education, 46 districts have improved by up to 34 per cent, and 29 districts have improved by up to 49 per cent in critical indicators which affect learning outcomes attained by students such as the percentage of elementary schools complying with Right to Education Act, 2009 (RTE) specified Pupil-Teacher Ratio; percentage of schools with functional drinking water facility and percentage of schools with functional girls’ toilets.
(c) While monitoring the outcome of financial inclusion, it was seen that ADs have performed better than non-aspirational districts. This means more people have access to bank accounts, more have been covered under the fold of government insurance schemes and more can secure MUDRA loans in ADs.
(d) Several ADs have reported saturation in the basic infrastructure indicators like the percentage of households with electricity connection; percentage of habitations with access to all-weather roads under Pradhan Mantri Gram Sadak Yojana (PMGSY); cumulative number of kilometres of all-weather road work completed as a percentage of total sanctioned kilometres in the district under PMGSY; and percentage of households with individual household washrooms, etc.
Template of Good Governance
6.15 The ADP has emerged as a template for good governance, especially in remote and difficult areas. At present, two programmes have been conceptualised along the lines of ADP design, one is ‘Mission Utkarsh’ and the other is ‘Aspirational Blocks Programme’ (ABP). On 22 January 2022, ‘Mission Utkarsh’ was launched, under which 15 Central Ministries, having an interface with the public, have identified their low performing 10-15 districts. Following the ADP template, the Ministries have launched actions to bring these districts at par with an average district in the state in one year and close to the all-India average in another.
6.16 The Central Government and States have come together to use the ADP template to identify backward blocks and use similar data monitoring and competition-based programme to improve the most under-developed blocks in the country. In order to further strengthen this initiative, 500 most backward blocks across States and UTs have been identified for rapid development.
Progressing Labour Reform Measures
6.17 In 2019 and 2020, 29 Central Labour Laws were amalgamated, rationalised, and simplified into four Labour Codes, viz., the Code on Wages, 2019 (August 2019), the Industrial Relations Code, 2020, the Code on Social Security, 2020, and the Occupational Safety, Health & Working Conditions Code, 2020 (September 2020). The new laws are in tune with the changing labour market trends and, at the same time, accommodate the minimum wage requirement and welfare needs of the unorganised sector workers, including the self-employed and migrant workers, within the legislation framework. The Labour Codes have been aligned with the present economic scenario and technological advancements along with reduction in multiplicity of definitions and authorities. The Codes also ease compliance mechanism aiming to promote ease of doing business/setting up of enterprises and catalyse creation of employment opportunities while ensuring safety, health and social security of every worker. Use of technology, such as, web-based Inspection has been introduced in order to ensure transparency and accountability in enforcement. Decriminalisation of minor offences has also been provided in the Labour Codes.
6.18 Rules made under the Codes have been entrusted to Central Government, State Government and at appropriate level. There is a requirement for pre-publication of Rules in their official Gazettes for public consultation. As of 13 December 2022, 31 States also have pre-published the draft rules under the Code on Wages, 28 States under Industrial Relations Code, 28 States under Code on Social Security, and 26 States under Occupational Safety Health and Working Conditions Code.
Table Vi.3: Status of Rules by States/uTs under the four Labour Codes
|
Name of Code |
Name of States which have pre-published the draft Rules |
| The Code on Wages, 2019 |
Andhra Pradesh, Arunachal Pradesh, Assam, Bihar, Chhattisgarh, Goa, Gujarat, Haryana, Himachal Pradesh, Jharkhand, Karnataka, Kerala, Madhya Pradesh, Maharashtra, Manipur, Mizoram, Odisha, Punjab, Rajasthan, Sikkim, Tamil Nadu, Telangana, Tripura, Uttarakhand, Uttar Pradesh, UTs of Andaman & Nicobar Islands, Chandigarh, Jammu & Kashmir, Ladakh, NCT of Delhi and Puducherry (31) |
| The Industrial Relations Code, 2020 | Andhra Pradesh, Arunachal Pradesh, Assam, Bihar, Chhattisgarh, Goa, Gujarat, Haryana, Himachal Pradesh, Jharkhand, Karnataka, Kerala, Madhya Pradesh, Maharashtra, Manipur, Mizoram, Odisha, Punjab, Tamil Nadu, Telangana, Tripura, Uttarakhand, Uttar Pradesh, Sikkim, UTs of Chandigarh, Jammu & Kashmir, Ladakh and Puducherry (28) |
| The Code on Social Security, 2020 | Andhra Pradesh, Arunachal Pradesh, Assam, Bihar, Chhattisgarh, Goa, Gujarat, Haryana, Himachal Pradesh, Jharkhand, Karnataka, Kerala, Madhya Pradesh, Maharashtra, Manipur, Mizoram, Odisha, Punjab, Telangana, Tripura, Uttarakhand, Uttar Pradesh, Sikkim, UTs of Andaman & Nicobar Islands, Chandigarh, Jammu & Kashmir, Ladakh and Puducherry (28) |
| The Occupational Safety Health and working Conditions Code, 2020 | Andhra Pradesh, Arunachal Pradesh, Assam, Bihar, Chhattisgarh, Goa, Gujarat, Haryana, Himachal Pradesh, Jharkhand, Karnataka, Kerala, Madhya Pradesh, Maharashtra, Manipur, Odisha, Punjab, Tamil Nadu, Telangana, Tripura, Uttarakhand, Uttar Pradesh, UTs of Chandigarh, Jammu & Kashmir, Ladakh and Puducherry (26) |
Source: Ministry of Labour & Employment; status as of 13 December 2022
e-Shram portal
6.19 The Government has been working on improving life and dignity of labour force of country by protecting and safeguarding the interest of workers, promoting their welfare and providing social security both in organised and unorganised sectors. Accordingly, Ministry of Labour and Employment (MoLE) has developed eShram portal for creating a National database of unorganised workers, which is verified with Aadhaar. It captures details of workers like name, occupation, address, occupation type, educational qualification, and skill types etc., for the optimum realisation of their employability and extend the benefits of the social security schemes to them. It is the first-ever national database of unorganised workers, including migrant workers, construction workers, gig and platform workers, etc.Currently, e-Shram portal has been linked to NCS portal and ASEEM portal for seamless facilitation of services.
6.20 As on 31 December 2022, total over 28.5 crore unorganised workers have been registered on eShram portal. Female registrations stood at 52.8 per cent of the total and 61.7 per cent of total registrations belonged to the age group 18-40 years. State-wise, Uttar Pradesh (29.1 per cent), Bihar (10.0 per cent), and West Bengal (9.0 per cent) accounted for nearly half of total registrations. Agriculture sector workers contributed to 52.4 per cent of the total registrations, followed by domestic and household workers (9.8 per cent), and construction workers (9.1 per cent).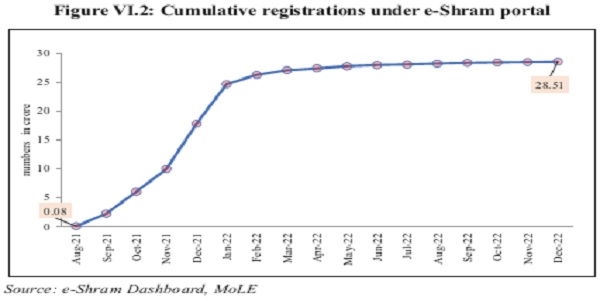
Aadhaar: The Many Achievements of the Unique Identity
6.21 Aadhaar, a 12-digit unique identification number provides a digital identity to the residents of India and ensures authentication. It connects the Government and the individual, replacing the disentangled web of multiple IDs for multiple purposes, and secures the social contract between the State and the Citizen. It is because of the initiative taken in 2010 that today, the nation is consistently building and strengthening a digital economy which will ultimately give a global competitive advantage in how money and goods move around the country over its competitors.
6.22 Paul Romer, a Nobel laureate and former World Bank Chief Economist, has described what 135 crore citizens of India, which is 94 per cent of the population and 100 per cent of the adult (>18 years), have as “the most sophisticated ID programme in the world.”11 Aadhaar provides a conclusive connection between the photograph of the Aadhaar holder, his/her fingerprints, and iris scan details.
Achievements of Aadhaar
6.23 Aadhaar is an essential tool for social delivery by the State. 318 Central schemes and over 720 state DBT schemes are notified under section 7 of the Aadhaar Act, 2016, and all these schemes use Aadhaar for targeted delivery of financial services, subsidies, and benefits. Aadhaar is the foundation of India’s digital integration, as shown by the following statistics (as of November 2022):
- Aadhaar Generated- 135.2 crore
- Aadhaar Updated- 71.1 crore
- Authentication Done- 8621.2 crore
- eKYC Done-1350.2 crore
- 3 crore residents have linked their Aadhaar with ration cards to avail of ration
- 9 crore residents linked Aadhaar with cooking gas connection for LPG subsidy
- 4 crore bank accounts are linked with Aadhaar & 1549.8 crore transactions via Aadhaar Enabled Payment Systems
6.24 The key usages of Aadhaar in the daily lives of citizens are:
- Aadhaar – Usage in DBT: When linked with a bank account, an Aadhaar becomes the ‘Financial Address’ of an individual, which helps to accomplish the country’s goal of financial inclusion. The number is sufficient to transfer any payment to an individual’s bank account through Aadhaar Payment Bridge (APB), thus eliminating the need to give other details, viz. the bank account, IFSC Code, and bank branch details to the Government/ Institutions.
- Aadhaar Enabled Payment Systems (AEPS): AEPS helps an individual to do basic banking transactions, viz. withdrawal, cash deposit, transfer of funds from his bank account, etc., by simply using his Aadhaar. This has immensely facilitated providing door-step banking services and helped mitigate the hardships of the people due to the Covid-19 pandemic.
- JAM (Jan-Dhan, Aadhaar, and Mobile) trinity, combined with the power of DBT, has brought the marginalised sections of society into the formal financial system, revolutionising the path of transparent and accountable governance by empowering the people. Till November 2022, multiple large central schemes, including PAHAL, MGNREGS, etc., have paid over `7,66,055.9 crore through over 1,010 crore successful transactions.12
- One Nation One Ration Card (ONORC) Scheme: Aadhaar has played a key role in the implementation of the ONORC Scheme. While Aadhaar seeding of the PDS database has resulted in significant savings due to eliminating ghost and duplicate beneficiaries. Grain disbursal through Aadhaar-based Biometric Authentication has brought meaningful transparency and back-office improvement of the logistic network of PDS. Free distribution of food grains under ‘Pradhan Mantri Garib Kalyan Yojana’ (PMGKY) has greatly mitigated the Covid pandemic’s impact, especially for the weakest and most vulnerable sections of society.
- PM Kisan Samman Nidhi: Aadhaar platform forms the backbone for the implementation of this scheme, right from registration through Aadhaar eKYC to DBT through the APB.
- Co-WIN: Successful management of the Covid pandemic without the Co-WIN platform would not have been possible. Aadhaar played a vital role in developing the Co-WIN platform and in the transparent administration of over 2 billion vaccine doses.
- Face Authentication: The use of face as an additional modality of authentication is increasing. This has helped, especially the elderly, to get ‘Jeevan Praman’ through their smartphones to avail of pension.
The Aadhaar Ecosystem
6.25 The Unique Identification Authority of India (UIDAI) is mandated to develop the policy, procedure, and system for issuing an Aadhaar number to each resident individual and performing authentication. It also has the responsibility to take necessary measures to ensure that the information stored in the Central Identities Data Repository (CIDR) is secured and protected against unauthorised access or misuse. The ecosystem required for the purpose now consists of the following (as of 30 November 2022):
- 66,103 Aadhaar counters and 34,834 Child Enrolment Lite Client devices are functional
- 180 Active Registrars
- 507 Active Enrolment Agencies
- UIDAI run 88 Aadhaar Sewa Kendra are functional in 72 cities
- 15,002 Village Level Entrepreneurs operational as Banking Correspondents permitted to undertake Aadhaar updates services
- Around 53,750 postmen/Grameen Dak Sewaks under India Post Payment Bank have been approved to provide mobile number update facility
- 178Aadhaar User Agencies
- 169 e-KYC user agencies
Improving Employment Trends
6.25 Employment trends can be studied from the supply side of labour through household surveys such as the PLFS conducted by the Ministry of Statistics and Programme Implementation (MoSPI), and the demand side of labour through enterprise or establishment surveys such as the Annual Survey of Industries (ASI) by MoSPI, Quarterly Employment Survey (QES) by Labour Bureau, etc. These enable a complete view of the labour market and the trends therein.
6.27 The broad-based improvement in employment indicators can be observed in data covering both the supply side and demand side of the labour market. Labour markets have recovered beyond pre-Covid levels, in both urban and rural areas, with unemployment rates falling from 5.8 per cent in 2018-19 to 4.2 per cent in 2020-21, and a noticeable rise in rural FLFPR from 19.7 per cent in 2018-19 to 27.7 per cent in 2020-21. More recent urban employment data shows progress beyond pre-pandemic levels as the unemployment rate declined from 8.3 per cent in July-September 2019 to 7.2 per cent in July-September 2022.
The net addition to EPFO payroll is steadily moving upward, with the majority share coming from the youth. Employment in nine major sectors has increased by 10 lakh over the year 2021-22 as per the QES. Employment in the organised manufacturing sector has also been rising over the years, as per the ASI 2019-20 data. The steady increase in employment levels can be attributed to multiple measures taken to cushion the impact of Covid-19 on MSMEs, street vendors, and manufacturing units and provide job opportunities through various targeted schemes and measures as detailed in later in the chapter. The trends in employment on the supply and demand side, as available from various data sources, are presented below.
Supply Side of Employment
Annual Periodic Labour Force Survey
6.28 As per usual status13, the labour force participation rate (LFPR)14, worker population ratio (WPR)15 and unemployment rate (UR)16 in PLFS 2020-21(July-June)17 have improved for both males and females in both rural and urban areas compared to PLFS 2019-20 and 2018-19.
TableVi.4: Employment trends as per usual status
(principal status + subsidiary status) for persons of all ages(per cent)
| Rural | Urban | Rural + Urban | ||||||||
| 2018-19 2019-20 2020-21 | 2018-19 2019-20 2020-21 | 2018-19 2019-20 2020-21 | ||||||||
| Male | LFPR | 55.1 | 56.3 | 57.1 | 56.7 | 57.8 | 58.4 | 55.6 | 56.8 | 57.5 |
| WPR | 52.1 | 53.8 | 54.9 | 52.7 | 54.1 | 54.9 | 52.3 | 53.9 | 54.9 | |
| UR | 5.6 | 4.5 | 3.9 | 7.1 | 6.4 | 6.1 | 6.0 | 5.1 | 4.5 | |
| Female | LFPR | 19.7 | 24.7 | 27.7 | 16.1 | 18.5 | 18.6 | 18.6 | 22.8 | 25.1 |
| WPR | 19.0 | 24.0 | 27.1 | 14.5 | 16.8 | 17 | 17.6 | 21.8 | 24.2 | |
| UR | 3.5 | 2.6 | 2.1 | 9.9 | 8.9 | 8.6 | 5.2 | 4.2 | 3.5 | |
| Person | LFPR | 37.7 | 40.8 | 42.7 | 36.9 | 38.6 | 38.9 | 37.5 | 40.1 | 41.6 |
| WPR | 35.8 | 39.2 | 41.3 | 34.1 | 35.9 | 36.3 | 35.3 | 38.2 | 39.8 | |
| UR | 5.0 | 4.0 | 3.3 | 7.7 | 7.0 | 6.7 | 5.8 | 4.8 | 4.2 | |
Source: Annual PLFS 2017-18 to 2020-21, MoSPI
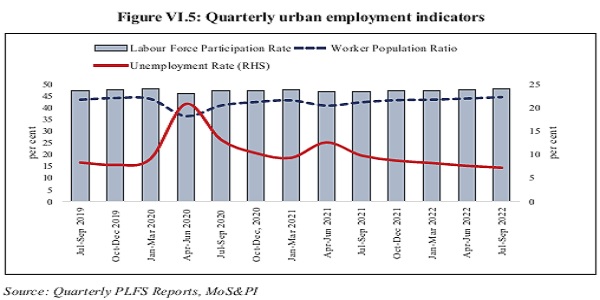
6.29 While usual status has a long reference period of one year, current weekly status (CWS)18 is a stricter benchmark. It can capture the loss in duration of employment during events such as a pandemic, with a reference period of one week. As per CWS, labour market indicators recovered swiftly from 2019-20 (July-June) to 2020-21, and for both males and females, with improvement in employment indicators. Region-wise, while rural labour market indicators have been improving for both males and females, the urban labour market is slightly behind pre-Covid levels in 2020-21 (July-June). However, taking a cue from the Quarterly PLFS reports for urban areas available for more recent quarters, the recovery of urban labour markets beyond pre-Covid levels is discernible. Quarterly urban unemployment rate declined from pre-pandemic level of 8.3 per cent in July-September 2019 to 7.2 per cent in July-September 2022, accompanied by a rise in LFPR from 47.3 per cent to 47.9 per cent during the same period, as discussed in paraghaphs 6.33 and 6.34.
Table Vi.5: Employment trends as per current weekly status
(for ages 15-plus)
(per cent)
| 2018-19 | Rural | Urban | Rural + Urban | |||||||
| 2018-19 2019-20 2020-21 | 2018-19 2019-20 2020-21 | 2018-19 2019-20 2020-21 | ||||||||
| Male | LFPR | 75.5 | 76.7 | 76.7 | 73.7 | 73.8 | 73.8 | 74.9 | 75.8 | 75.8 |
| WPR | 69.0 | 70.1 | 71.2 | 67.2 | 66.0 | 66.8 | 68.4 | 68.8 | 69.9 | |
| UR | 8.6 | 8.7 | 7.1 | 8.8 | 10.5 | 9.4 | 8.7 | 9.3 | 7.8 | |
| Female | LFPR | 22.5 | 28.3 | 30.0 | 19.7 | 22.1 | 21.7 | 21.6 | 26.3 | 27.5 |
| WPR | 20.9 | 26.7 | 28.6 | 17.4 | 19.4 | 19.0 | 19.8 | 24.4 | 25.7 | |
| UR | 7.3 | 5.5 | 4.8 | 12.1 | 12.4 | 12.2 | 8.7 | 7.3 | 6.6 | |
| Person | LFPR | 49.1 | 52.5 | 53.4 | 47.1 | 48.2 | 48.0 | 48.5 | 51.2 | 51.8 |
| WPR | 45.0 | 48.4 | 50.0 | 42.7 | 43.0 | 43.1 | 44.3 | 46.7 | 47.9 | |
| UR | 8.3 | 7.8 | 6.5 | 9.5 | 11.0 | 10.1 | 8.7 | 8.8 | 7.5 | |
Source: Annual PLFS 2017-18 to 2020-21, MoSPI
Note: 2020-21 refers to the period July 2020-June 2021 and likewise for 2019-20 and 2018-19
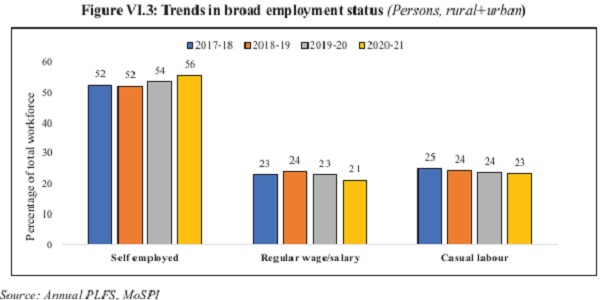
6.30 According to broad status in employment, the share of self-employed increased and that of regular wage/salaried workers declined in 2020-21 vis-à-vis 2019-20, driven by trend in both rural and urban areas. The share of casual labour declined slightly, driven by rural areas.
6.31 Based on the industry of work, the share of workers engaged in agriculture rose marginally from 45.6 per cent in 2019-20 to 46.5 per cent in 2020-21, the share of manufacturing declined faintly from 11.2 per cent to 10.9 per cent, the share of construction increased from 11.6 per cent to 12.1 per cent, and share of trade, hotel & restaurants declined from 13.2 per cent to 12.2 per cent, over the same period. This could be attributable to the impact of Covid on manufacturing and services employment (2020-21 data covers July 2020 to June 2021 period), while agricultural growth remained strong during the period. An upturn in the FLFPR (rising by 9.5 percentage points (pp) in 2017-18 to 2020-21 for usual status and by 8.3 pp for CWS) is a positive development on the gender aspect of employment, which could be attributable to rising rural amenities freeing up women’s time, and high agricultural growth over the years. Box VI.2 provides a perspective on measurement aspects of FLPFR.
Box Vi.2: measurement issues in female labour force participation rate
The common narrative of Indian women’s low LFPR misses the reality of working females integral to the economy of the household and the country. Measurement of employment through the survey design and content can make a significant difference to final LFPR estimates, and this matters more for measuring female LFPR than male LFPR. Here, three main measurement issues have been highlighted: overly broad categories, reliance on a single question to categorize labour force status, and the narrow approach of limiting productive work to labour force participation.
Use of overly broad categories clubbing productive work (collection of firewood, poultry farming, etc.) with domestic duties can in one sweep shift a significant proportion of women in the labour force into the out-of- labour-force category. For example, unless the production of primary goods is identified as the main activity by the respondent, the PLFS questionnaire would categorize women who do both domestic activities and primary goods production/collection into ‘Activity Code
Adding the proportion of women in Activity code 93 to the official LFPR yields an “Augmented Female LFPR” of 46.2 per cent for FY21 for ages 15 years and above, much higher than the 32.5 per cent estimated by the conventional definition (PLFS data for usual status). A similar attempt has been made in an International Labour Organization (ILO) research paper20, arriving at a female LFPR of 56.4 per cent in India for 2012, against the far lower official estimate of 31.2 per cent for 2012.

Augmented FLPR calculations estimated using NSO data
Note: 1. Usual activity (ps+ss) status (for age group 15 years & above) in per cent
- NSS-EUS and PLFS may not be comparable, given different sampling weights, frequencies, and data collection techniques.
No Recovery questions in the plFS questionnaire: The survey design relies mainly on a single question for measuring the labour force status of an individual, which eliminates the scope to rectify any error in self-reporting, considering the large rural population and literacy levels. Contrary to ILO recommendations, there are no additional questions (‘recovery questions’) in the PLFS questionnaire to double-check individuals’ labour force status, relying too much on how the individual self-identifies in the first instance. ILO recommends using multiple probing or recovery questions such as “whether the person helped in the family business” and “whether the person worked in own business in last one week/year” and “whether person helped the family with job”.
In a World Bank and ILO study in Sri Lanka21, such methodological issues accounted for close to eight percentage point underestimation of the female employment-to-population ratio.
Measurement of “Work” alongside “Employment”: There is a need to broaden the horizon of measuring work, which constitutes the whole universe of productive activities alongside employment. According to the latest ILO standards22, limiting productive work to labour force participation is narrow and only measures work as a market product. It does not include the value of women’s unpaid domestic work, which can be seen as expenditure-saving work such as collecting firewood, cooking, tutoring children, etc, and contributes significantly to the household’s standard of living. Thus, a wholesome measurement of “work” may require improved quantification through redesigned surveys.
That said, there is further significant scope to nullify the gender-based disadvantages to enable free choice of women to join the labour market. Ecosystem services, including affordable creches, career counselling/handholding, lodging and transportation, etc., can further help unlock the gender dividend for inclusive and broad-based growth.
6.32 It may be noted that more than 75 per cent of rural female workers are employed in the agricultural sector. This implies a need to upskill and create employment for women in agriculture-related sectors such as food processing. Here, the self-help groups (SHGs) can play a crucial role in shaping rural women’s potential into concrete developmental outcomes of financial inclusion, livelihood diversification, and skill development as discussed in Box VI.3.
Box Vi.3: role of Self-Help groups in Women’s empowerment
The Self-Help Groups (SHGs)23 movement, based on the principles of group solidarity and microfinance, has existed in India for 50 years in one form or another, with its roots tracing back to the formation of the Self-Employed Women’s Association in 1972. The transformative potential of SHGs, exemplified through their key role in the on-ground response to Covid-19, has served as the fulcrum of rural development through women empowerment.
India has around 1.2 crore SHGs, 88 per cent being all-women SHGs. Success stories include Kudumbashree in Kerala, Jeevika in Bihar, Mahila Arthik Vikas Mahila Mandal in Maharashtra, and recently, Looms of Ladakh.
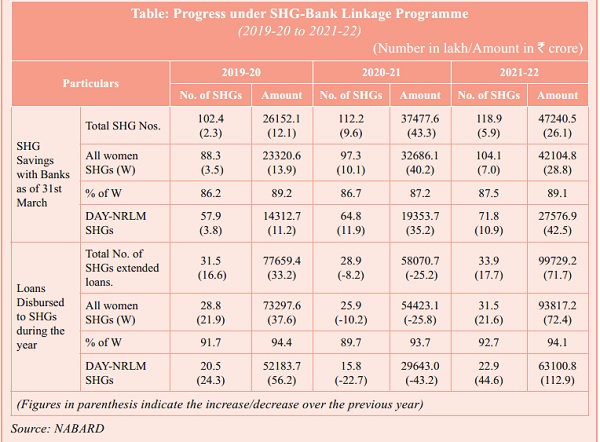
The SHG Bank Linkage Project (SHG-BLP), launched in 1992, has blossomed into the world’s largest microfinance project. The SHG movement, now in its 30th year, has emerged as a powerful intervention to cover the small and marginalised sections. Currently, bank-linked SHGs are promoted through Central Government, State Governments, NGOs, etc. They must practice the ‘Panchasutra’ of regular meetings, regular savings, regular inter-loaning, timely repayment and up-to-date books of accounts to avail of loans from banks. With the active collaboration of stakeholders, the SHG-BLP covers 14.2 crore families through 119 lakh SHGs with savings deposits of `47,240.5 crore and 67 lakh groups with collateral-free loans outstanding of `1,51,051.3 crore, as on 31 March 2022. The number of SHGs credit linked has grown at a CAGR of 10.8 per cent during the last ten years (FY13 to FY22), while credit disbursement per SHG has grown at a CAGR of 5.7 per cent during the same period. Notably, SHGs’ bank repayment is more than 96 per cent, underscoring their credit discipline and reliability.
Table: progress under SHg-bank linkage programme
Impact of SHgs: empowered Women, empowered Hinterland
Women’s economic SHGs have a positive, statistically significant effect on women’s economic, social, and political empowerment, with positive effects on empowerment achieved through various pathways such as familiarity with handling money, financial decision-making, improved social networks24, asset ownership25 and livelihood diversification26.
According to an recent assessment27 of DAY-National Rural Livelihood Mission, which is being undertaken through the SHGs, (for details see para 6.104) both participants and functionaries perceived high impacts of the programme in areas related to women empowerment, self-esteem enhancement, personality development, reduced social evils; and additionally, medium impacts in terms of better education, higher participation in village institutions and better access to government schemes.
covid-19 response as a montage of SHg’s potential
Government’s Covid-19 Package for SHGs
- Under PMGKY, the limit for collateral-free loans for women’s SHGs was doubled from `10 lakh to `20 lakh. This is expected to benefit 63 lakh women SHGs and 6.85 crore households.
- NRLM allowed for an additional Vulnerability Reduction Fund of `1.5 lakh to be extended to Village Organisations (VOs) in Covid hotspot areas and for vulnerable groups.
SHGs in action during Covid
The years of pestilence acted as an opportunity towards mobilising SHG women to unite, transcend their group identity and collectively contribute to crisis management. They emerged as pivotal players in crisis management, leading from the front in – producing masks (with cultural variants such as Gamusa Masks in Assam), sanitisers, and protective gear, creating awareness about the pandemic (e.g. Patrakar Didis of Jharkhand), delivering essential goods (e.g. Floating supermarkets in Kerala), running community kitchens (e.g. Prerna Canteens in Uttar Pradesh), supporting farm livelihoods (e.g. Pashu Sakhis for animal health care services, Aajeevika Farm Fresh Online selling and distribution mechanism for vegetables in Jharkhand), convergence with MGNREGS (in UP, Bihar, Chhattisgarh), and in delivery of financial services (e.g. Bank Sakhis managing bank rush for
availing Covid-relief DBT cash transfers). The production of masks by SHGs has been a noteworthy contribution, enabling access to and use of masks by communities in remote rural areas and providing vital protection against the Covid-19 virus. As on 4 January 2023, more than 16.9 crore masks were produced by SHGs under DAY-NRLM.
Way forward
SHGs are well-placed to facilitate overall rural development owing to their access to the last mile, ability to draw on communities’ trust and solidarity, knowledge of local dynamics, and ability to swiftly manufacture simple products and services through the aggregation of members’ economic activities. The demonstration of their resilience and flexibility during crises, including Covid, needs to be thus regularised for long-run rural transformation. This includes, among other things, addressing inter-regional disparity in the deepening of the SHG movement, graduating SHG members into micro-entrepreneurs, culturally contextualised skill development for moving up the value chain in products and services, and including the least privileged under the SHG umbrella.
Quarterly plFS for urban areas
6.33 The PLFS conducted by the MoSPI at a quarterly level for urban areas is available till July-September 2022. The data shows an improvement in all the key labour market indicators in the quarter ending September 2022 both sequentially and over the last year, as per the CWS. The labour participation rate increased to 47.9 per cent in July-September 2022 from 46.9 per cent a year ago, while the worker-population ratio strengthened from 42.3 per cent to 44.5 per cent in the same period. The unemployment rate declined from 9.8 per cent in July-September 2021 to 7.2 per cent in July-September 2022.This trend highlights that the labour markets have recovered from the Covid impact.
6.34 The composition of the urban workforce for the broad status of employment has been stable over the past four quarters, with the share of self-employed at 39.7 per cent, regular wage/ salaried at 48.7 per cent, and casual labour at 11.6 per cent in July-September 2022. Similar stability is visible in the work industry, with the share of workers engaged in the secondary sector at 33.4 per cent, and the share of the tertiary sector at 60.9 per cent in July-September 2022.
Demand Side of Employment
Quarterly Employment Survey (QES)
6.35The QES, conducted by the Labour Bureau, covers establishments with ten or more workers in nine major sectors viz. manufacturing, construction, trade, transport, education, health, accommodation & restaurants, IT/BPOs, and financial services. These nine sectors account for around 83 per cent of the total employment in establishments with ten or more workers as per the 6th Economic Census (2013-14) conducted by MoSPI.
6.36 So far, results of four rounds of the QES have been released, covering four quarters of FY22.28 The estimated total employment in the nine selected sectors according to the fourth round of QES (January to March 2022) stood at 3.2 crore, which is nearly ten lakh higher than the estimated employment from the first round of QES (April-June 2021). The increase in estimates of workers from Q1FY22 to Q4FY22 was driven by rising employment in sectors such as IT/BPO (by 17.6 lakh), health (7.8 lakh), and education (1.7 lakh), due to rising digitisation and resurgence of services sector economy.
6.37 Regarding terms of employment, regular employees constituted the majority of workers across sectors, with a share of 86.4 per cent in the total workforce in Q4FY22. Contractual employees formed a relatively small proportion of the workforce in these nine sectors, except Manufacturing (12.4 per cent) and Construction (19.0 per cent). Further, out of the total employed in the fourth round of QES, 98.0 per cent are employees while 1.9 per cent are self-employed. Gender-wise, 31.8 per cent of the total estimated employed are women and 68.2 per cent are men.
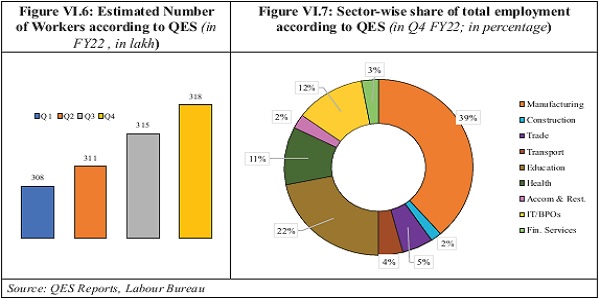
Table Vi.6: Sector-wise estimated number of workers as per QeS (in lakh)

Table VI.7: Sector-wise distribution of workers according to terms of employment as per QES
(per cent, for Jan-Mar 2022)
| Sectors | Self-
Employed |
Regular (Not on contract) Employee |
Contractual Employee |
Fixed Term Employee |
Casual Employee |
| Manufacturing | 2.5 | 80.2 | 12.4 | 1.0 | 4.0 |
| Construction | 1.3 | 73.4 | 19.0 | 0.5 | 5.7 |
| Trade | 4.2 | 90.1 | 3.5 | 0.3 | 2.0 |
| Transport | 0.6 | 91.9 | 5.1 | 0.6 | 1.8 |
| Education | 1.2 | 91.1 | 6.4 | 0.5 | 0.8 |
| Health | 0.6 | 89.0 | 9.1 | 0.5 | 0.9 |
| Accommodation & Restaurants | 6.7 | 84.5 | 5.2 | 0.6 | 3.0 |
| IT /BPOs | 0.1 | 94.7 | 4.8 | 0.0 | 0.4 |
| Financial Services | 6.4 | 87.7 | 1.9 | 0.4 | 3.6 |
| Total | 2.0 | 86.4 | 8.7 | 0.7 | 2.3 |
Source: QES Reports, Labour Bureau
Annual Survey of Industries (ASI) 2019-2029
6.38 The ASI, conducted by MoSPI, is an important source of industrial statistics of the registered organised manufacturing sector of the economy. It covers all factories registered under Sections 2m(i) and 2m(ii) of the Factories Act, 1948, i.e., those factories employing ten or more workers using power; and those employing twenty or more workers without using power.
6.39 As per the latest ASI FY20, employment in the organised manufacturing sector has maintained a steady upward trend over time, with the employment per factory increasing gradually. In terms of share of employment (total persons engaged)30, the food products industry (11.1 per cent) remained the largest employer, followed by wearing apparel (7.6 per cent), basic metals (7.3 per cent), and motor vehicles, trailers, and semi-trailers (6.5 per cent). State-wise, Tamil Nadu had the largest number of persons engaged in factories (26.6 lakh), followed by Gujarat (20.7 lakh), Maharashtra (20.4 lakh), Uttar Pradesh (11.3 lakh), and Karnataka (10.8 lakh).

Note: States/UTs with at least one lakh total persons engaged in factory sector have been shown in the chart.
6.40 In terms of employment size, the data shows a skewed distribution of a larger number of factories with low employment sizes and a few factories with higher employment sizes. For example, out of an estimated 1,98,628 factories in operation, 1,34,577 factories are found to employ less than 50 employees each. However, the distribution of persons engaged is more balanced and right-skewed, with larger factories accounting for a greater share of employment. For instance, 77.3 per cent of the total persons engaged are in factories engaging more than 100 persons. Over time, there is a visible trend towards bigger factories employing more than 100 workers, their numbers rising by 12.7 per cent from FY17 to FY20, compared to a broadly constant number of smaller factories. Between FY17 and FY20, total persons engaged in larger factories rose by 13.7 per cent, compared to 4.6 per cent in smaller factories. Resultantly, the share of larger factories in the total number of factories has increased from 18 per cent in FY17 to 19.8 per cent in FY20, and their share in total persons engaged shows a similar expansion from 75.8 per cent in FY17 to 77.3 per cent in FY20. Thus, in terms of total persons engaged, employment has been rising in larger factories (employing more than 100 workers) than in smaller ones, suggesting scaling up of manufacturing units.
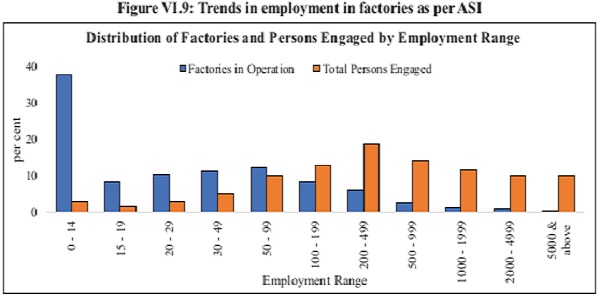
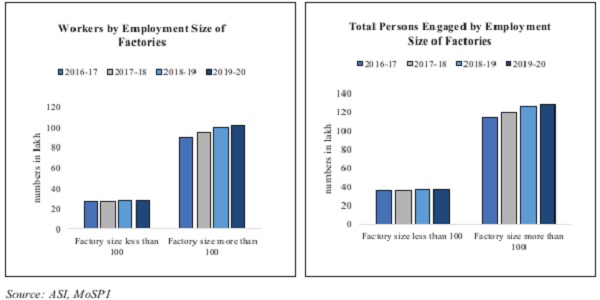
Formal Employment
6.41 Employment generation coupled with improving employability is the priority of the Government. Following this path, the organised sector job market conditions measured by payroll data for Employees’ Provident Fund Organisation (EPFO) and Employees’ State Insurance Corporation (ESIC) reveal the benefits of the government initiatives towards improvement in the labour market. EPFO data indicates a consistent YoY increase in payroll addition, pointing towards improved formalisation as economic activities picked up. The net addition in EPF subscriptions during FY22 was 58.7 per cent higher than in FY21 and 55.7 per cent higher than that in the pre-pandemic year 2019. In FY23, net average monthly subscribers added under EPFO increased from 8.8 lakh in April-November 2021 to 13.2 lakh in April-November 2022.
6.42 The swift rebound of formal sector payroll addition can be attributed to the Aatmanirbhar Bharat Rojgar Yojana (ABRY), launched in October 2020 to boost the economy, increase the employment generation in post Covid-19 recovery phase, and to incentivise creation of new employment along with social security benefits and restoration of employment lost during the pandemic. As on 7 January 2023, total registration under the scheme is 75.1 lakh, and total benefits of `8,210 crore have been given to 60.2 lakh beneficiaries through 1.5 lakh establishments.
6.43 Average monthly subscriber additions under ESIC for April-October period improved from 11.9 lakhs in 2021 to 14.4 lakh in 2022. Similarly, under National Pension Scheme (NPS), the average monthly net subscriptions increased from 61.9 thousand in 2021 to 63.2 thousand in 2022 for the April-October period.31

Note: Net addition in payroll = No. of new subscribers + No. of exited members who re-joined – No. of members exited.
6.44 In terms of industrial composition, expert services (consisting of manpower agencies, private security agencies, and small contractors, etc.) form the largest share of EPFO payroll addition (41.1 per cent in FY23, April-November), followed by trading-commercial establishments (6.9 per cent). Across age groups, the age group of 18-25 years contributed to 48.5 per cent of the net payroll addition in April-November 2022. With nearly 62.7 per cent of net payroll addition coming from less than 29 years of age (in the same period), new jobs in the organised sector are mainly going to the youth. In the 18-25 years age group, Maharashtra (21.4 per cent), Karnataka (12.1 per cent), Tamil Nadu (10.9 per cent), Haryana (9.0 per cent), Gujarat (8.4 per cent), and Delhi (7.6 per cent) contributed to nearly 70 per cent of the net payroll addition in Apr-Nov 2022.
Table VI.8: EpFo payroll data for main industries across all age groups (in lakhs)
| Industry | 2019-20 | 2020-21 | 2021-22 | 2022-23 (Apr-Nov) | % Share in
2022-23 |
| Expert Services | 35.2 | 37.0 | 51.7 | 43.4 | 41.1 |
| Trading – Commercial Establishments | 5.2 | 3.4 | 8.7 | 7.3 | 6.9 |
| Others | 1.5 | 2.6 | 7.3 | 7.1 | 6.8 |
| Engineers – Engg. Contractors | 4.1 | 4.9 | 6.2 | 5.6 | 5.4 |
| Building and Construction Industry | 5.1 | 4.7 | 6.0 | 5.5 | 5.2 |
| Elec., Mech. or Gen. Engg. Products | 3.8 | 3.8 | 4.9 | 4.9 | 4.7 |
| Establishment engaged in Manufacture, Marketing Servicing, Usage of Computers | 2.7 | 2.0 | 4.4 | 2.9 | 2.7 |
| Establishments engaged in Cleaning, Sweeping Services | 1.8 | 2.5 | 3.3 | 3.0 | 2.8 |
| Textiles | 1.7 | 1.7 | 3.1 | 2.0 | 1.0 |
| Grand Total (All Industries) | 78.6 | 77.1 | 122.3 | 105.4 | 100.0 |
Source: EPFO, MoLE
Note: Main Industries is a subset of all industries
Demand for work under MGNREGS
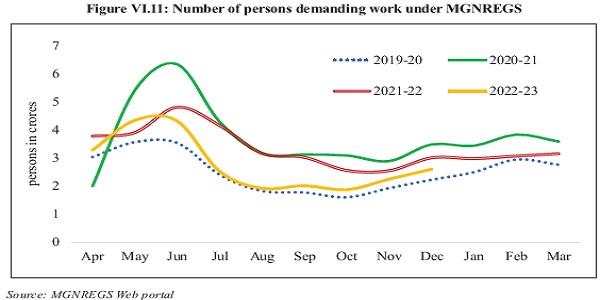
6.45 The number of persons demanding work under MGNREGS was seen to be trending around pre-pandemic levels from July to November 2022. This could be attributed to the normalisation of the rural economy due to strong agricultural growth and a swift recovery from Covid induced slowdown, culminating in better employment opportunities. In FY23, as on 24 January 2023, 6.49 crore households demanded employment under MGNREGS, and 6.48 crore households were offered employment out of which 5.7 crore availed employment.
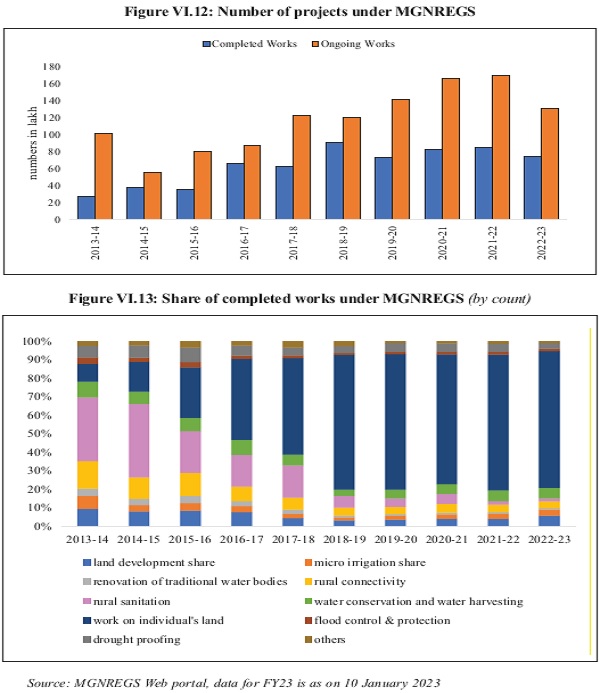
6.46 The number of works done under MGNREGS has steadily increased over the years, with 85 lakh completed works in FY22 and 70.6 lakh completed works so far in FY23 (as on 9 January 2023). Regarding the composition of works, the share of “works done on individual’s land” (included in the permissible work list in 2009 and expanded since then) has increased from 16 per cent of the total completed works in FY15 to 73 per cent in FY22. These works include creating household assets such as animal sheds, farm ponds, dug wells, horticulture plantations, vermicomposting pits etc., in which the beneficiary gets both labour and material costs as per standard rates. Empirically, within a short span of 2-3 years, these assets have been observed to have a significant positive impact on agricultural productivity, production-related expenditure, and income per household, along with a negative association with migration and fall in indebtedness, especially from non-institutional sources.32 This has long-term implications for aiding income diversification and infusing resilience into rural livelihoods.
6.47 The Government has been taking several measures to enhance the reach of employment opportunities to all eligible and willing to work. One such measure is the National Career Service (NCS) project, which is detailed in Box VI.4.
Box Vi.4: national career Service project
The ‘National Career Service (NCS’)project was launched in July 2015, as a one-stop solution providing an array of employment and career-related services. It works towards bridging the gap between candidates and employers; candidates seeking training and career guidance and agencies providing training and career counselling. NCS portal has a job fair module to streamline the process of job fair activity on a single online platform by engaging all stakeholders i.e. model career centres, nodal officers, job seekers and employers. It is also supported by a dedicated helpline (multi-lingual) for assisting users.
As on 5 January 2023, 2.8 crore jobseekers and 6.8 lakh employers have registered in NCS portal, 2.5 lakh active vacancies and 1.2 crore total vacancies have been mobilised, and more than 9,100 job fairs have been organised as part of the Project.
NCS has partnered with private sector under DigiSaksham programme to offer a free, self-paced Online/Offline Training Programme on “Career Skills”, to equip the jobseekers with an array of soft and digital skills with the mandate of improving their employability. This programme also includes advanced computing areas and is being provided free of cost.
NCS is also working closely with Ministry of Education All India Council for Technical Education and All India Survey of Higher Education ) to ensure that its benefits are reaching to prospective students/ candidates. Online integration with EPFO and ESIC has also been done to link the willing employers for enabling them to shortlist right candidates through a countrywide database of workforce on NCS portal. NCS has also integrated with DigiLocker to enable candidates to upload their documents/ certificates and make them available to the employers to quicken the hiring process.
As per budget announcement of 2022-23, NCS portal has been successfully interlinked with e-Shram, Udyam and Skill India portal (primary data source of ASEEM portal). This has resulted in development of an employment ecosystem to facilitate job search and matching for both jobseekers and employers. So far, more than 10 lakh candidates from e-Shram have registered on NCS out of which, more than 1.2 lakh candidates have been shortlisted by employers for jobs. More than 46 lakh skilled candidates of Skill India portal have been registered on NCS through data exchange. These candidates can showcase their skills to the prospective employers, thus enhancing their opportunity to get a job. Integration between Udyam and NCS has facilitated more than 4,76,650 MSME employers in getting seamless registration on NCS portal.
NCS has recently added ‘International Job’ module on the portal in March 2022, which facilitates employers registered with the Ministry of External Affairs to post international job opportunities on the NCS portal and the jobseekers to search and apply for these opportunities via the NCS portal. So far, more than 400 plus Recruting Agents have registered on the NCS portal and posted around 1400 plus international vacancies.
The trend in rural wages
6.48 Nominal rural wages have increased at a steady positive rate during FY23 (till November 2022). In agriculture, the YoY rate of growth of nominal wage rates in agriculture was 5.1 per cent for men and 7.5 per cent for women, during the period April-November 2022. In non- agricultural activities, the growth of nominal wage rates was 4.7 per cent for men and 3.7 per cent for women, during the same period. However, growth in real rural wages has been negative due to elevated inflation. Going forward, as inflation is expected to soften with the easing of international commodity prices and domestic food prices, it is expected that this will translate into a rise in real wages.

Ensuring Quality Education for All
6.49 The importance of education for all cannot be overemphasised as it is the foundation of every individual and society’s development. As remarked by Dr. A.P.J Abdul Kalam – ‘Learning gives creativity, creativity leads to thinking, thinking leads to knowledge, and knowledge makes you great !’
6.50 Education, apart from enhancing the employability of the working-age population, also has an equalising impact in breaking the cycles of poverty and social marginalisation. “Quality Education” which is enlisted as Goal 4 under UN SDGs (SDG4), aims to “Ensure inclusive and equitable quality education and promote lifelong learning opportunities for all” by 2030. This goal is of critical importance because of the transformative effects that it can have on most other SDGs, such as “no poverty”, “zero hunger”, “gender equality” etc. Sustainable development, in fact, hinges on every child receiving quality education, offering them the tools to develop to their full potential and become productive citizens aiding their own socioeconomic progress and that of their nation.
6.51 It is in this context that the NEP 2020 was laid down as the first education policy of the 21st century, aiming to address the many growing developmental imperatives of the country. Recognising that education is the lifeblood of human capital formation for a young country like India, this policy provided for the revision and revamping of all aspects of the education structure. This includes its regulation and governance, creation of a new system that is aligned with the aspirational goals of 21st century-education, including SDG4, while building upon India’s traditions and value systems. The NEP provides for nurturing all-around development and skill acquisition by youth in an inclusive, accessible, and multilingual set-up.
6.52 As part of the whole-of-ecosystem approach, the Union Government launched Samagra Shiksha in 2018 as an overarching programme for the school education sector extending from pre-school to class XII with an aim to ensure inclusive and equitable quality education at all levels of school education.
School Enrolment
6.53 The year FY22 saw improvement in Gross Enrolment Ratios (GER)34 in schools and improvement in gender parity. GER in the primary-enrolment in class I to V as a percentage of the population in age 6 to 10 years – for girls as well as boys have improved in FY22. This improvement has reversed the declining trends between FY17 and FY19. GER in Upper-Primary (enrolment in class VI to VIII as a per cent of the population in age 11-13 years), which was stagnant between FY17 and FY19, improved in FY22. In corresponding age groups in Primary and Upper-Primary levels, girls’ GER is better than boys.
Table Vi.9: School Gross Enrolment Ratios
(in per cent)
| Year | Primary | Upper Primary | Secondary | ||||||
| Girls | Boys | Total | Girls | Boys | Total | Girls | Boys | Total | |
| 2013-14 | 107.9 | 106.5 | 107.2 | 88.6 | 85.0 | 86.7 | 73.5 | 74.2 | 73.8 |
| 2019-20 | 103.7 | 101.9 | 102.7 | 90.5 | 88.9 | 89.7 | 77.8 | 78.0 | 77.9 |
| 2020-21 | 104.5 | 102.2 | 103.3 | 92.7 | 91.6 | 92.2 | 79.5 | 80.1 | 79.8 |
| 2021-22 | 104.8 | 102.1 | 103.4 | 94.9 | 94.5 | 94.7 | 79.4 | 79.7 | 79.6 |
Source: Unified District Information System for Education (UDISE+)35
Notes: 1. UDISE+ data comes with more than one-year lag, hence data is available up to 2021-22
- GER greater than 100 per cent might represent the presence of over or under-age children in a particular level of education.
6.54 In FY22, a total of 26.5 crore children were enrolled in schools and 19.4 lakh additional children were enrolled in Primary to Higher Secondary levels. Total enrolment of Children With Special Needs (CWSN) in FY22 stands at 22.7 lakh as compared to 21.9 lakh in FY21, which is an increase of 3.3 per cent. The enrolments increased across all levels viz., Primary, Upper-Primary, Secondary, and Higher Secondary except for the Pre-Primary level. At the Pre-primary level, enrolment reduced from 1.1 crore in FY21 to 1.0 crore in FY22. During the year, about 1.0 crore children were enrolled in pre-primary, 12.2 crore in Primary, 6.7 crore in Upper Primary, 3.9 crore in Secondary and 2.9 crore in Higher Secondary.
School Drop-out
6.55 School dropout rates36 at all levels have witnessed a steady decline in recent years. The decline is for both girls and boys. The schemes such as Samagra Shiksha, RTE Act, improvement in school infrastructure and facilities, residential hostel buildings, availability of teachers, regular training of teachers, free textbooks, uniforms for children, Kasturba Gandhi Balika Vidyalaya and the PM POSHAN Scheme play an important role in enhancing enrolment and retention of children in schools.
Table VI.10: School dropout rates
(in per cent)
| Year | Primary | Upper Primary | Secondary | ||||||
| Girls | Boys | Total | Girls | Boys | Total | Girls | Boys | Total | |
| 2013-14 | 4.7 | 4.7 | 4.7 | 4.0 | 2.3 | 3.1 | 14.5 | 14.5 | 14.5 |
| 2019-20 | 1.2 | 1.7 | 1.5 | 3.0 | 2.2 | 2.6 | 15.1 | 17.0 | 16.1 |
| 2020-21 | 0.7 | 0.8 | 0.8 | 2.6 | 2.0 | 2.3 | 13.7 | 14.3 | 14.0 |
| 2021-22 | 1.4 | 1.6 | 1.5 | 3.3 | 2.7 | 3.0 | 12.3 | 13.0 | 12.6 |
Source: UDISE+
School Infrastructure
6.56 The education infrastructure in the form of schools, amenities, and digitalisation has been steadily promoted along with a focus on pedagogy. The dividends of the structural reforms in the education sector will enrich the nation’s growth and development prospects in decades to come.The basic infrastructure facilities in schools – both in terms of the number of recognised schools and teachers’ availability reflected in the Pupil-Teacher Ratio, showed an improvement in FY22. The trend in number of recognised schools for various levels show a steady progress.
Table VI.11: Trends in number of recognised schools
(in lakh)
| 2013-14 | 2019-20 | 2020-21 | 2021-22 | |
| Total Schools | 15.2 | 15.1 | 15.1 | 14.9 |
| Primary & Upper Primary schools | 12.9 | 12.2 | 12.2 | 11.9 |
| Secondary & Sr. Secondary Schools | 2.3 | 2.9 | 2.9 | 2.9 |
Source: UDISE+
6.57 Basic facilities in schools continued to improve in FY22 over earlier years except for medical check-ups in schools as the schools remained closed physically in the wake of Covid-19 curbs. Toilets (girls or boys), drinking water, and hand-washing facilities are now available in most Government schools. Priority to drinking water and sanitation in schools under Samagra Shiksha Scheme as well as Swachh Bharat Mission have been instrumental in providing required resources and creating these assets in schools. Under the Information & Communication Technology (ICT) component of the Samagra Shiksha Scheme, Government supports the establishment of smart classrooms, and ICT labs in schools, including support for hardware, educational software, and e-content for teaching.
Table VI.12: Improving school infrastructure
(Schools with basic facilities as a percentage of all schools)
| Year | 2012-13 | 2019-20 | 2020-21 | 2021-22 |
| Girls Toilet | 88.1 | 96.9 | 97.3 | 97.5 |
| Boys Toilet | 67.2 | 95.9 | 96.2 | 96.2 |
| Hand wash Facility | 36.3 | 90.2 | 91.9 | 93.6 |
| Library/Reading Room/ Reading corner | 69.2 | 84.1 | 85.6 | 87.3 |
| Electricity | 54.6 | 83.4 | 86.9 | 89.3 |
| Medical check-ups in school in a year | 61.1 | 82.3 | 50.4* | 54.6* |
| Computer | 22.2 | 38.5 | 41.3 | 47.5 |
| Internet | 6.2 | 22.3 | 24.5 | 33.9 |
* Due to Covid, schools were closed physically. Hence, fewer medical check-ups were done. Source: UDISE+
6.58 Further, the availability of teachers, measured by pupil-teacher ratio, an indicator which is inversely related to improvement in quality of education, has improved at all levels continuously from FY13 to FY22: from 34.0 to 26.2 at Primary, 23.0 to 19.6 at Upper Primary, 30.0 to 17.6 at Secondary, and 39.0 to 27.1 at the Higher Secondary level. The improvement in the number of schools, teachers’ availability, and facilities in schools is expected to help improve enrolment and reduce dropout rates. Various programmes and schemes for school education launched during FY23 are presented in the following paras.
6.59 pM Schools for Rising India: The Government launched a Centrally Sponsored Scheme (CSS) called PM Schools for Rising India (PM SHRI) on 7 September, 2022. These schools will be equipped with modern infrastructure and showcase the implementation of the NEP and emerge as exemplary schools over a period of time, while offering leadership to other schools in the neighbourhood. Under the scheme, there is a provision for setting up more than 14,500 PM SHRI Schools, over the period FY23 to FY27 by strengthening the existing schools from those managed by Central Government/State/UT Government/local bodies. These schools will be equipped with modern infrastructure including labs, smart classrooms, libraries, sports equipment, art room etc. which is inclusive and accessible. They shall also be developed as green schools with water conservation, waste recycling, energy-efficient infrastructure and integration of organic lifestyle in curriculum. More than 20 lakh students are expected to be direct beneficiaries of the scheme.
6.60 The National Curriculum Framework (NCF) for Foundational Stage: NCF for Foundational Stage has been launched as the new 5+3+3+4 curricular structure which integrates early childhood care and education for all children of ages 3 to 8. As articulated in NEP 2020, the NCF uses ‘play,’ at the core of the conceptual, operational, and transactional approaches to curriculum organisation, pedagogy, time and content organisation, and the overall experience of the child. It will deal with the role of teachers as well as parents and communities in enabling and enhancing the developmental outcomes that are sought during this stage.
6.61 Pilot project of Balvatika: With a focus on developing cognitive, affective, and psychomotor abilities and also early literacy and numeracy for students in the age groups of 3+, 4+ and 5+ years, Project Balvatika, i.e.,‘Preparatory Class’, was lauched in October 2022 in 49 Kendriya Vidyalayas.
6.62 Toy-based pedagogy: A handbook for Toy-based pedagogy has been designed to promote the integration of indigenous toys and their pedagogy into the curriculum of school education, early childhood care and education and teacher education. This will help teachers select or create age-appropriate toys to explain various concepts to students.
6.63 Screening tools (Mobile App) for specific learning disabilities: PRASHAST, a Disability Screening mobile app, has been launched, covering 21 disabilities, including the benchmark disabilities as per the Rights of Persons with Disabilities Act 2016. PRASHAST App will help in screening disability conditions at the school level and will generate the school-wise report, for further sharing with the authorities for initiating the certification process, as per guidelines of Samagra Shiksha.
6.64 National Credit Framework (NCrF): Taking the vision of the new NEP, the NCrF is an umbrella framework for skilling, re-skilling, up-skilling, accreditation and evaluation, seamlessly integrating the credits earned through school education, higher education, and vocational and skill education by encompassing the National Higher Education Qualification Framework (NHEQF), National Skills Qualification Framework (NSQF) and National School Education Qualification Framework (NSEQF). This would be a game changer by opening numerous options for further progression of students and inter-mingling of school and higher education with vocational education and experiential learning, thus mainstreaming skilling and vocational education. The Framework has been released for public consultations on 19 October 2022.
6.65 Strengthening Teaching-Learning and Results for States (STARS): STARS Project is being implemented as a CSS in six states namely Himachal Pradesh, Madhya Pradesh, Rajasthan, Maharashtra, Odisha and Kerala over a period of 5 years i.e., till FY25, partly funded by a loan from the World Bank. The objective of the Scheme is to improve the quality and governance of school education in the selected states.
6.66 Vidyanjali (A School Volunteer Initiative): With the aim of strengthening schools and improving the quality of school education through community, Corporate Social Responsibility (CSR) and private sector involvement across the country, the Government has initiated Vidyanjali (a school volunteer management program). The Vidyanjali portal enables community and volunteers/organisations to interact and connect directly with the Government and Government aided schools of their choice and share their knowledge and skills and/or contribute in the form of assets/material/equipment to meet the requirement of the schools. As of 20 January 2023, 3,95,177 schools have been onboarded and 1,14,674 volunteers have registered on the Vidyanjali portal. The programme has successfully managed to impact around 11,34,218 students across the nation by seeking volunteers’ support in several areas such as subject assistance, mentoring of gifted children, teaching vocational skills, providing ceiling fans and water purifiers, gifting digital devices for learning via virtual mode, musical instruments, self-defence training to schoolgirls, assistance for basic civil infrastructure and other classroom needs, etc.
6.67 Samagra Shiksha Scheme: A CSS of Samagra Shiksha of the Department of School Education and Literacy is an overarching programme for the school education sector extending from pre-school to class XII. The Samagra Shiksha Scheme has been aligned with the recommendations of the NEP 2020 and extended from FY22 to FY26. Under the ICT component of the Scheme, there is a provision to impart computer literacy and computer-enabled learning to children, by developing and deploying curriculum-based interactive multimedia, digital books, virtual labs etc. across the country. It supports the establishment of smart classrooms, and ICT labs in schools, including support for hardware, educational software and e-content for teaching. It envisages covering all Government/Government-aided schools with classes VI to XII. Till November 2022 (since inception), ICT labs have been approved in 1,20,614 schools and smart classrooms in 82,120 schools across the country.
Higher Education
6.68 Indian higher education system is the laboratory of change for one of the largest young populations in the world, with more than 27 per cent of India’s population in 15-29 years age bracket.37 The infrastructure for higher education has been enhanced overtime. Number of medical colleges in the country have been increased from 387 in 2014 to 648 in 2022 and the number of MBBS seats have increased from 51,348 to 96,077. Number of Indian Institutes of Technology (IITs) and Indian Institute of Management (IIMs), respectively stand at 23 and 20 in 2022 against 16 and 13 in 2014. The strength of Indian Institutes of Information Technology (IIITs) is 25 in 2022 against 9 in 2014. In 2014, there were 723 Universities in the country, which have been increased to 1,113.
6.69 The total enrolment in higher education has increased to nearly 4.1 crore in FY21 from 3.9 crore in FY20. Since FY15, there has been an increase of around 72 lakh in enrolment (21 per cent). The female enrolment has increased to 2.0 crore in FY21 from 1.9 crore in FY20.
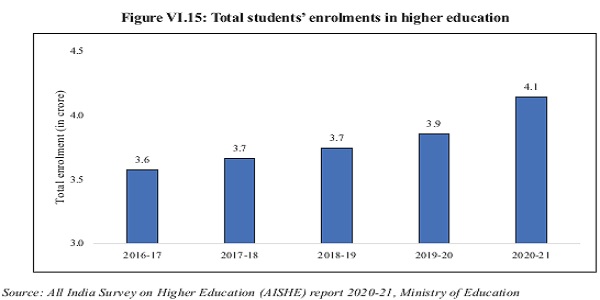
Table Vi.13: Students’ enrolment in higher education (in crore)
| Year Male Female Total | |||
| 2016-17 | 1.9 | 1.7 | 3.6 |
| 2017-18 | 1.9 | 1.7 | 3.6 |
| 2018-19 | 1.9 | 1.8 | 3.7 |
| 2019-20 | 2.0 | 1.9 | 3.9 |
| 2020-21 | 2.1 | 2.0 | 4.1 |
Source: AISHE report 2020-21
6.70 Further, the enrolment in Distance Education is 45.7 lakh (with 20.9 lakh females), an increase of around 7 per cent since FY20 and 20 per cent since FY15. The GER in higher education, based on 2011 population projections (revised), was recorded at 27.3 per cent in FY21, which is an improvement from 25.6 in FY20. GER for males increased from 24.8 in FY20 to 26.7 in FY21 while GER for females has also shown improvement from 26.4 to 27.9 during the same period.
6.71 The total number of Universities / University institutions registered as of end of FY21 are 1,113, number of colleges are 43,796 and number of standalone institutions is 11,296. The total number of faculty/teachers is 15,51,070 of which about 57.1 per cent are male and 42.9 per cent are female.
Table VI.14: Number of teachers in higher education institutions (in lakh)
| Year | Male | Female | Total |
| 2016-17 | 8.1 | 5.5 | 13.6 |
| 2017-18 | 7.5 | 5.4 | 12.9 |
| 2018-19 | 8.2 | 6.0 | 14.2 |
| 2019-20 | 8.6 | 6.4 | 15.0 |
| 2020-21 | 8.9 | 6.6 | 15.5 |
Source: AISHE report 2020-21
Initiatives for higher education
6.72 Research & Development Cell (RDC) in Higher Education Institutions (HEI): The University Grants Commission (UGC) launched an initiative to establish an RDC in HEIs with the mandate for promoting quality research that contributes meaningfully towards the goal of a self-reliant India, aligned with the provisions of NEP 2020. The RDC would help create a research ecosystem for reliable, impactful, and sustained research output. The Guidelines for the same were issued in March 2022 providing for the creation of a conducive environment for enhanced research productivity; encouraging collaboration across industry, Government, community-based organisations, and agencies at the local, national, and international levels and facilitating greater access to research through mobilisation of resources and funding.
6.73 Guidelines for pursuing two academic programmes simultaneously: The UGC, in April 2022, issued Guidelines to allow the students to pursue two academic programmes simultaneously keeping in view the objectives envisaged in NEP 2020, viz. providing flexible curricular structures to enable creative combinations of disciplines for study, that would offer multiple entry and exit points, thus, removing currently prevalent rigid boundaries and creat new possibilities for life-long learning through critical and interdisciplinary thinking. The Guidelines provide that a student can pursue two full-time academic programmes in physical mode or pursue two academic programmes, one in full-time physical mode and another in Open and Distance Learning (ODL)/Online mode; or up to two ODL/Online programmes simultaneously. These will be governed by Regulations notified by the UGC.
6.74 Interest subsidy on education loan: Under the Central Scheme on Interest Subsidy (CSIS), launched in 2009, full interest subsidy is provided during the moratorium period (course period plus one year) on education loan taken by students from economically weaker sections (EWS) having parental income less than `4.5 lakh per annum for professional study in India. The scheme provides Education loans without any collateral or third-party guarantee.
Box Vi.5: Akhil Bharatiya Shiksha Samagam
A three-day Akhil Bharatiya Shiksha Samagam was organised at Varanasi on 7-9 July 2022 by the Ministry of Education in association with the UGC and Banaras Hindu University. The event brought together over 300 Vice Chancellors and Directors from public and private universities, educationists, policymakers, as also industry representatives to deliberate on how the implementation of NEP 2020 can be taken further across the country after successful implementation of several initiatives in the last two years. The Summit provided a platform for thought-provoking discussions that helped articulate the roadmap and implementation strategies, foster knowledge exchange, build networks through interdisciplinary deliberations, and discuss challenges being faced by educational institutions and articulate solutions.
The Samagam was witness to India’s extended vision and a renewed commitment to help achieve the goals of the higher education system with education leaders resolving to work collectively for transforming India into an equitable and vibrant knowledge society.
Equipping the Workforce with Employable Skills and Knowledge in Mission Mode
6.75 Skill development is aimed at the removal of the disconnect between demand and supply of skilled manpower, building vocational and technical training framework, skill up-gradation, and building of new skills, and innovative thinking not only for existing jobs but also jobs of the future. In order to address the incremental manpower requirement and to empower youth with adequate skills, the Ministry of Skill Development and Entrepreneurship (MSDE) was created in 2014 and Skill India Mission was launched in 2015. With the establishment of a Central Ministry, efforts to improve and streamline the skilling ecosystem were ramped up as the government launched the National Skill Development Mission as well as the National Policy on Skill Development and Entrepreneurship. Under the NEP 2020 also, there is a special focus on vocational education and skill development. Integration of vocational education with general education and mainstreaming of vocational education have been identified as the key reform in the education System of the country.
6.76 PLFS FY21 shows that formal vocational/technical training among youth (age 1529 years) and the working population (age 15-59 years) have improved in FY21 over FY19 and FY20. The improvement in skills has been for males and females, both in rural and urban sectors.
Table VI.15: Distribution of persons who received formal vocational/technical training (per cent)
| Age group | Rural | Urban | All India | ||||||
| Male Female Total | Male Female Total | Male Female Total | |||||||
| 2018-19 | |||||||||
| 15-29 years | 2.4 | 1.5 | 2.0 | 4.8 | 4.6 | 4.7 | 3.2 | 2.5 | 2.8 |
| 15-59 years | 1.8 | 1.1 | 1.5 | 4.9 | 3.9 | 4.4 | 2.8 | 2.0 | 2.4 |
| 2019-20 | |||||||||
| 15-29 years | 3.1 | 2.7 | 2.9 | 7.0 | 6.5 | 6.8 | 4.3 | 3.8 | 4.1 |
| 15-59 years | 2.2 | 1.7 | 2.0 | 6.3 | 5.4 | 5.8 | 3.5 | 2.9 | 3.2 |
| 2020-21 | |||||||||
| 15-29 years | 3.4 | 2.6 | 3.0 | 7.3 | 6.5 | 6.9 | 4.5 | 3.7 | 4.1 |
| 15-59 years | 2.5 | 1.9 | 2.2 | 6.2 | 5.3 | 5.8 | 3.6 | 2.9 | 3.3 |
Source: Annual PLFS Reports, 2017-18 to 2020-21
6.77 As per the reports of the fourth round of the QES (for Q4 FY22) in respect of establishments employing at least 10 workers in major nine sectors, 15.6 per cent of estimated establishments imparted formal skill training and 20.5 per cent imparted on-the-job training. The health sector had the highest percentage of estimated establishments imparting formal skill training (24.7 per cent) and on-the-job training (31.6 per cent), followed by financial services (20.4 per cent of establishments imparting formal training and 26.4 per cent imparting on-the-job training).
Table VI.16: Sector-wise percentage of estimated establishments imparting formal skill development training and on-the-job training
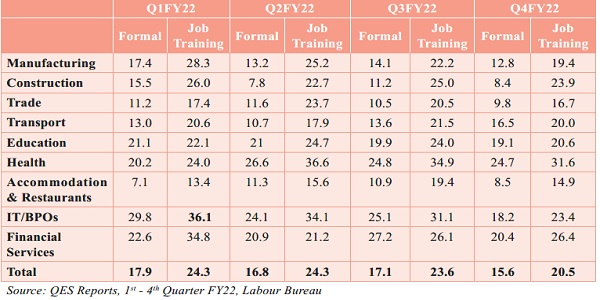
Skill India Mission
6.78 The Skill Indian Mission focuses on skilling, re-skilling and up-skilling through short term and long term training programmes. Under the Mission, the government, through more than 20 Central Ministries/Departments, is implementing various skill development schemes across the country. These include Deen Dayal Upadhyaya Grameen Kaushalya Yojna (DDU-GKY), Rural Self Employment Training Institutes (RSETI), Deen Dayal Antyodaya Yojana-National Urban Livelihood Mission (DAY-NULM). MSDE is implementing Schemes such as Pradhan Mantri Kaushal Vikas Yojana (PMKVY), Jan Shikshan Sansthan (JSS), National Apprenticeship Promotion Scheme (NAPS) and Craftsmen Training Scheme (CTS). The advocacy of the programmes is being done through print media, electronic media, and State Governments’ campaigns . More and more areas are being aligned with the common framework spanning the skills ecosystem so that the outcomes of the Government skilling programmes are uniform across the skilling ecosystem. The progress in some of these schemes is presented in Box VI.6.
Box VI.6: Progress of Skill India Mission


Quality and Affordable Health for All
6.79 Ensuring the provision of quality health facilities to citizens is an important priority for the Government. Towards this objective, multidimensional initiatives have been launched and carried forward for better overall health of the citizens, as encapsulated below. Under the National Health Mission, the Government has made concerted efforts to engage with all relevant sectors and stakeholders to move in the direction of achieving universal health coverage and delivering quality healthcare services to all at affordable cost. Today, the Indian healthcare network is among the largest in the world. The results of an effective health approach are visible in the improvement in some of the important health-related indicators.
Major initiatives from 2014 to 2022 for better overall health
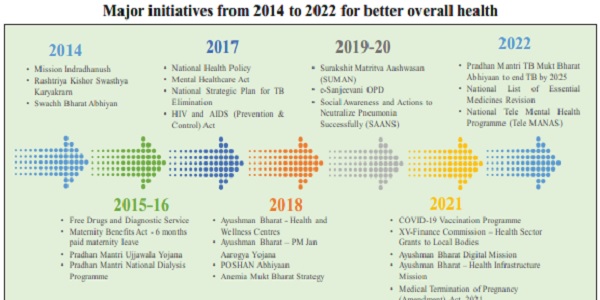
Table VI.17: Improvement in health-related Indicators
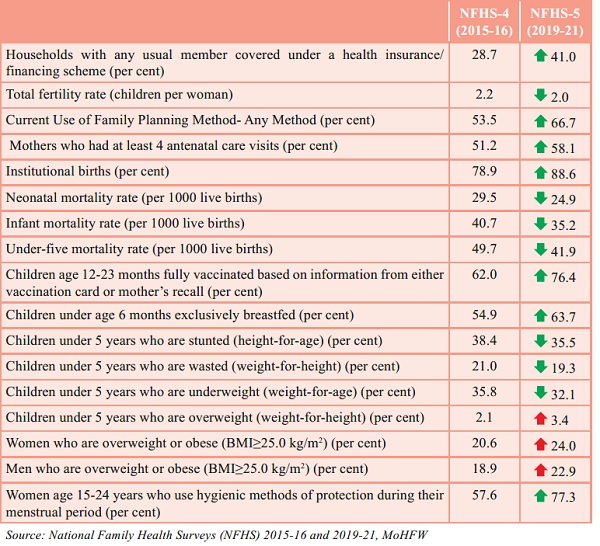
6.80 With concerted efforts made under the Reproductive, Maternal, New-born, Child, Adolescent Health Plus Nutrition (RMNCAH+N) strategy, India has made considerable progress in improving the health status of both mothers and children. As per the Sample Registration System (SRS) data, India has successfully achieved the major milestone to bring the Maternal Mortality Ratio (MMR) to below 100 per lakh live births by 2020 (laid down in National Health Policy 2017) by bringing it down to 97 per lakh live births in 2018-20 from 130 per lakh live births in 2014-16. Eight states have already achieved the SDG target to reduce MMR to less than 70 per lakh live births by 2030. These include Kerala (19), Maharashtra (33), Telangana (43) Andhra Pradesh (45), Tamil Nadu (54), Jharkhand (56), Gujarat (57), and Karnataka (69).
6.81 Following a steady downward trend, Infant Mortality Rate (IMR), Under Five Mortality Rate (U5MR) and Neonatal Mortality Rate (NMR) have further declined as a result of countrywide efforts towards increasing health service coverage through strengthening of service delivery; quality assurance; RMNCAH+N; human resources, community processes; information and knowledge; drugs and diagnostics, and supply chain management, etc.
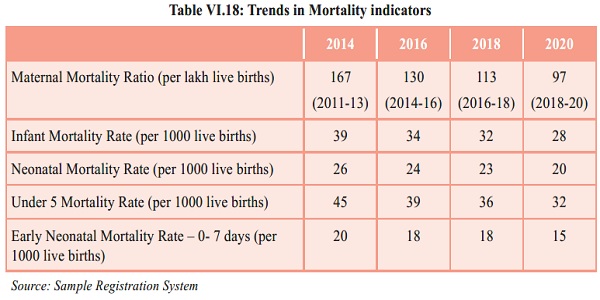
Health Expenditure Estimates
6.82 National Health Account (NHA)38 for the year FY19 (which is the latest available account) highlights the rising importance of public healthcare and social security in ensuring universal health coverage. The NHA estimates for FY19 show that there has been an increase in the share of Government Health Expenditure (GHE) 39 in the total GDP from 1.2 per cent in FY14 to 1.3 per cent in FY19. Additionally, the share of GHE in Total Health Expenditure (THE)40 has also increased over time, standing at 40.6 per cent in FY19, substantially higher than 28.6 per cent in FY14.
6.83 Overall, for FY19, THE for India is estimated to be `5,96,440 crore (3.2 per cent of GDP and `4,470 per capita). Current Health Expenditure (CHE)41 is `5,40,246 crore (90.6 per cent of THE) and capital expenditures is `56,194 crore (9.4 per cent of THE). Of the GHE, Union Government’s share is 34.3 per cent and the State Governments’ share is 65.7 per cent.
6.84 Aligning with the focus on providing healthcare services to all, which comprises one of the policy recommendations of the National Health Policy 2017, the Government is focusing on primary healthcare expenditure which has increased from 51.1 per cent in FY14 to 55.2 per cent in FY19. This not only ensures quality services at the grassroot level but also reduces the chances of ailments requiring secondary or tertiary healthcare services. Between FY14 and FY19, the share of primary and secondary care in the GHE increased from 74.4 per cent to 85.7 per cent. On the other hand, share of primary and secondary care in private health expenditure has declined from 82.0 per cent to 70.2 per cent during the same period.
6.85 The social security expenditure on health, which includes the social health insurance programme, government-financed health insurance schemes, and medical reimbursements made to government employees, has increased from 6 per cent in FY14 to 9.6 per cent in FY19. This is a significant increase which shows that the citizens are better equipped and better provided in terms of healthcare at their doorstep making it more accessible. Due to several such steps, Out-of-Pocket Expenditure (OOPE)42 as a percentage of THE has declined substantially from 64.2 per cent in FY14 to 48.2 per cent in FY19.
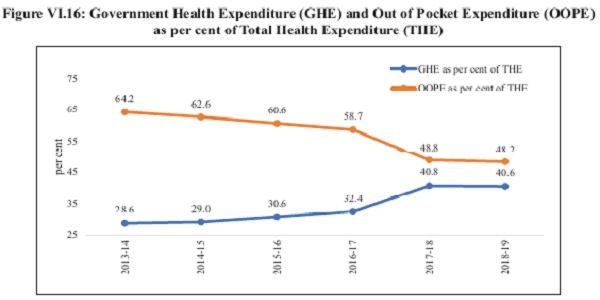
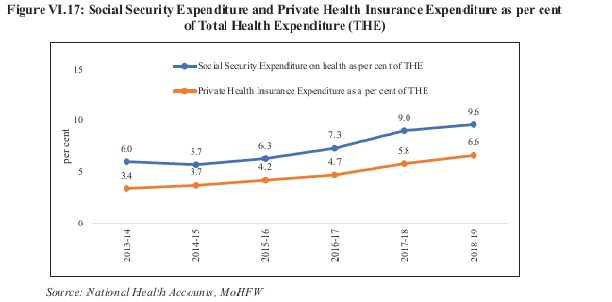
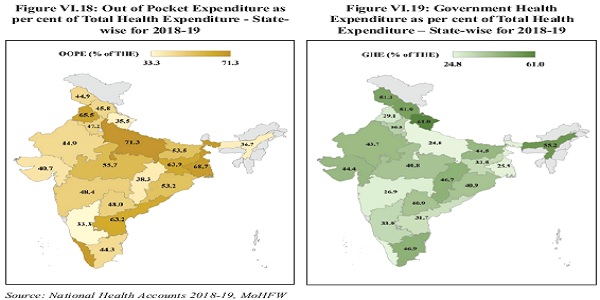
Note: Jammu and Kashmir represents the erstwhile J&K including Ladakh
Rural health care – strengthening of infrastructure and human resource
6.86 Health infrastructure is an important indicator for understanding the healthcare delivery provisions and welfare mechanisms in a country. Public health infrastructure has been referred to as ‘the nerve centre of the public health system’, forming the basic support system for the last-mile delivery of public health services. Alongside, human resources for health are identified as one of the core building blocks of the health system. These include physicians, nursing professionals, pharmacists, midwives, dentists, allied health professionals, community health workers, social health workers and other health care providers, as well as health management and support personnel.
6.87 The recent health sector reforms in India have laid emphasis on strengthening health infrastructure as well as human resource in the public sector system. This can be observed in the rise in the number of Sub-centres (SCs), Primary Health Centres (PHCs), and Community Health Centres (CHCs) in rural areas, along with the rise in doctors, nurses, and other medical personnel over time. With the implementation of the Ayushman Bharat programme, the strengthening of SCs and PHCs are being done by converting them into Health and Wellness Centres (HWCs), in a phased manner, to deliver comprehensive Primary Healthcare services through these Centres. As on 31 December 2022, more than 1.5 lakh HWCs have already been set up.
Rural health care system in India
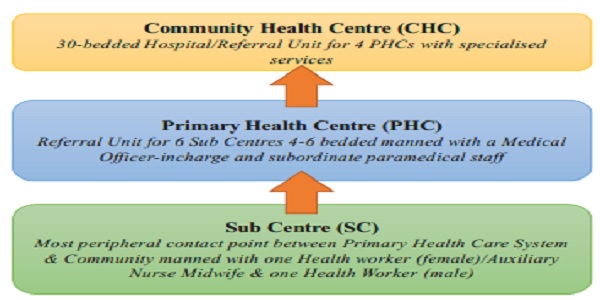
Table Vi.19: progress in health infrastructure (as of March each year) (numbers in thousands)
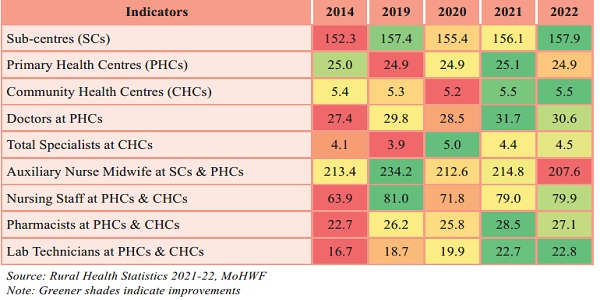
Progress under Major Government Initiatives for Health
Immunisation
6.88 Under Universal Immunisation Programme (UIP), immunisation is being provided free of cost against 12 vaccine-preventable diseases: Diphtheria, Pertussis, Tetanus, Polio, Measles, Rubella, a severe form of Childhood Tuberculosis, Rotavirus diarrhoea, Hepatitis B, etc. To reinforce universal immunisation, Mission Indradhanush (MI) was launched in December 2014 with the aim to rapidly increase full immunisation coverage of children to 90 per cent and sustain it thereafter. The drive focuses on unvaccinated and partially vaccinated children. Intensified MI was then launched in October 2017 in identified 190 districts/urban areas.
6.89 In FY23, Intensified MI 4.0 was conducted in 416 districts (including 75 districts under Azadi Ka Amrit Mahotsav) across 32 states/UTs, to cover children and pregnant women who missed routine immunisation during the Covid-19 pandemic. Until December 2022, a total of 11 phases of MI have been completed covering 701 districts across the country under which a total of 4.5 crore children and 1.1 crore pregnant women have been vaccinated. Resultantly, NFHS-5 shows a 14.4 per cent increase in Full Immunisation Coverage (FIC) from NFHS-4 and an increase in the percentage of FIC in 30 states/UTs.
eSanjeevani
6.90 eSanjeevani is an innovative, indigenous, cost-effective, and integrated cloud-based telemedicine system application to enable patient-to-doctor teleconsultation to ensure a continuum of care and facilitate health services to all citizens in the confines of their homes, free of cost. At present, eSanjeevani is operational in all states and UTs across India. As of 17 January 2923, 1,12,553 HWCs in rural areas and 15,465 Hubs at tertiary level hospitals, and medical colleges in the states have been enabled in the eSanjeevani. This innovative solution has served over 9.3 crore patients across the country and is currently serving around 4 lakh patients daily. eSanjeevani – National Telemedicine Service of India has evolved into the world’s largest outpatient services system.
Box Vi.7: Progress under Ayushman Bharat
Ayushman Bharat Pradhan Mantri – Jan Arogya Yojana (AB PM-JAY)
AB PM-JAY is the world’s largest health insurance scheme that intends to minimisthe OOPE of the target beneficiaries arising due to expenditure on healthcare. The scheme provides health cover of `5 lakh per family per year for secondary and tertiary care hospitalisation to over 10.7 crore poor and vulnerable families (approximately 50 crore beneficiaries) that form the bottom 40 per cent of the Indian population identified based on the deprivation and occupational criteria of the Socio-Economic Caste Census 2011 (SECC 2011) and other State schemes.
As of 4 January 2023, approximately 21.9 crore beneficiaries have been verified under the Scheme including 3 crore beneficiaries verified using State IT systems. Approximately 4.3 crore hospital admissions, amounting to `50,409 crore, have also been authorised under the Scheme through a network of over 26,055 hospitals.
Ayushman Bharat – Heath and Wellness Centres (AB-HWCs)
Under the scheme, 1.5 lakh AB-HWCs were envisaged to be established by upgrading the SHCs and PHCs in rural and urban areas which will ensure comprehensive primary health care closer to the community. These AB-HWCs provide Comprehensive Primary Health Care, by expanding and strengthening the existing Reproductive & Child Health services and Communicable Diseases services and by including services related to Non- Communicable Diseases such as hypertension, diabetes and 3 common cancers, viz. Oral, Breast and Cervix. The status of service delivery through AB-HWCs as on 31 December 2022 is as under:
√ The first HWCs was inaugurated on 14 April 2018 in the Bijapur District of Chhattisgarh.
√ 1,54,070 HWCs operationalised across the country.
√ More than 135 Crore cumulative footfall.
√ More than 87.0 Crore cumulative screening of Non communicable diseases
√ More than 1.6 crore Wellness Sessions, including Yoga,.
√ Under the e-Sanjeevani teleconsultation platform, more than 9.3 crore tele-consultations have been provided through functional HWCs at 15,465 Hubs (comprising MBBS/ Specialty/Super-Specialty doctors at zonal level) and 1,12,987 Spokes (AB-HWCs at state level) across the country, as on 17 January 2023.
Ayushman Bharat Digital Mission (ABDM)
The Mission aims at creating a secure online platform based on open, interoperable digital standards. This will enable access and exchange of health records of citizens with their consent through Services such as the issuance of Health ID, Healthcare Professionals Registry, Health Facility Registry and Health Records. This will boost the adoption of digital technologies in healthcare, thereby making quality healthcare more accessible and affordable. As on 10 January 2023 key achivements are as under:
√ Ayushman Bharat health account (earlier known as Health ID) created: 31,11,96,965
√ Verified facilities on health facility registry: 1,92,706
√ Verified healthcare professionals on healthcare professional registry: 1,23,442
√ Health records linked : 7,52,01,236
box Vi.8: national deworming day
Grabbing the Low Hanging Fruits in Child Health
National Deworming Day (NDD), launched in 2015 in 11 states and expanded to the whole country in 2016, is a fixed-day approach to treating intestinal worm infections in children aged 1-19 years with Albendazole tablets. The programme is held every year on 10 February and 10 August through schools and Anganwadis, followed by mop-up days to cover those left out due to absenteeism or sickness. Besides Government and Government-aided schools and Anganwadis, special efforts
are made to reach out-of-school children, and private schools have also enthusiastically joined the programme.
During Covid-19, the continuity of deworming efforts were maintained while minimising risks. Frontline health workers were trained to follow appropriate safety guidelines during home visits or through staggered “Village Health Sanitation and Nutrition Day” based model.
Need for the Programme
Soil-Transmitted Helminthiases (STH), also known as parasitic intestinal worm infection, is a public health concern adversely affecting children’s physical and cognitive growth. Intestinal worm infection is known to cause, aggravate, and intensify nutritional losses, particularly of Vitamin A and Iron. Micronutrient deficits and worm infestation together culminate into stunted growth and development in children.
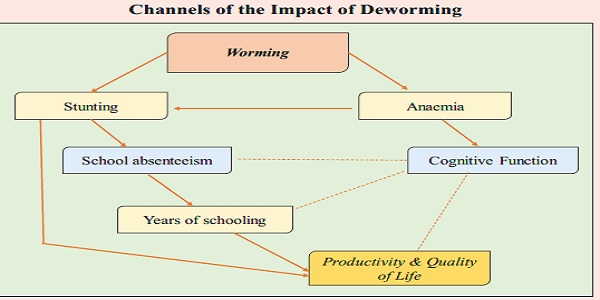
Deworming: a low-cost high-returns intervention
Eminent research, including by Prof. Michael Kremer, Nobel Laureate in Economics in 2019, has shown the significant impact of deworming on school absenteeism43, health, nutritional, and learning outcomes44. In long-duration studies, deworming was found to have significantly increased the likelihood of higher-wage jobs, ten years after the deworming treatment45. Regular deworming thus contributes to achieving better nutrition and health. The deworming initiative also supplements the Swachh Bharat Abhiyan in eliminating sanitation-related health risks.
The combined benefits of deworming, when compared to the low cost of the intervention, lead to a remarkably high benefit-to-cost ratio. The annualised social internal rate of return has been estimated to be around 37 per cent in a 20-years long study in Kenya.46
National Deworming Day is, thus, a low-hanging fruit of programme innovations in health well plucked for deep-rooted development.
National covid-19 Vaccination Programme
6.91 India’s National Covid-19 Vaccination Programme, which is the world’s largest vaccination programme, began on 16 January 2021, initially with the aim of covering the adult population of the country in the shortest possible time. The programme was expanded to include all persons aged 12 years and above and for the precautionary dose for all persons aged 18 years and above. Test-Track-Treat-Vaccinate and adherence to Covid appropriate behaviour continue to remain the tested strategy for Covid management.
6.92 The introduction of Covid-19 vaccines entailed many challenges such as research and development for new Covid vaccines, training of more than 2.6 lakh vaccinators and 4.8 lakh other vaccination team members, optimum utilisation of available vaccine, difficult-to-reach population, and the need to ensure all essential health services along with scaling up of vaccination programme. In addition, logistical challenges such as storage and decentralised distribution of vaccines across 29,000 cold chain points, augmenting cold chain capacity, and developing IT platform for registering the beneficiaries and vaccine service delivery, were also noticed. The programme was able to overcome these challenges and meet its goals within a short time frame.
6.93 As on 6 January 2023, India has been able to administer more than 220 crore Covid vaccine doses across the country. 97 per cent of eligible beneficiaries have already received at least one dose of Covid-19 vaccine and around 90 per cent of eligible beneficiaries have received both the doses. Vaccination for the age group 12-14 years was started on 16 March 2022, followed by the precautionary dose for the age group 18-59 years starting from 10 April 2022. So far, more than
4.2 crore adolescents have been administered the first dose of the Covid-19 vaccine and 22.4 crore precautionary doses have been administered.

Box Vi.9: Health- a narrative on dedicated covid infrastruture
The first Covid-19 case in India was detected on 30 January 2020, the same day the World Health organisation (WHO) declared it a public health emergency of international concern. India had alertly implemented surveillance as early as 17 January 2020, even before the first few cases were officially detected. Covid-19 virus posed an unprecendented challenge to the country which was tackled with an agile approach, based on feed-back loops, real-time monitoring of actual outcomes, flexible responses, and safety-net buffers, as discussed in previous Economic Surveys.47 Over two years since the pandemic was declared, the Government has taken various fiscal and social measures to balance the revival of the economy and deal with increasing caseloads. These included ramping up health infrastructure, both physical and digital, enhanced training of health professionals and, continuing with the mass vaccination drive.
Under the Aatmanirbhar Bharat Abhiyaan, the Union Government focussed on scaling up expenditure on health infrastructure by (a) investing in grass root health institutions and ramping up HWCs in rural and urban areas; (b) setting up critical care hospital blocks in all districts; and (c) strengthening the laboratory network and surveillance by integrated public health laboratories in all districts and blocks and public health units to manage pandemics. The State Governments also took various measures to fight the pandemic. This was complemented by digital infrastructure through Co-WIN for mass vaccination and e-Sanjeevani for telemedicine to reach the last mile. The timely intervention at all levels helped India navigate the Covid pandemic successfully despite successive shocks.
In the last few months, the caseload has subsided significantly, where the active caseload is below 4000 and daily new cases recorded below 300 ( as of 29 December 2022). India may have won a major battle. India is one of the countries which has learned the most from the pandemic to create a mechanism for protecting its citizens and economy. After the successful rollout of two doses of indigenous vaccines, the third dose was introduced.
Dedicated Covid Infrastructure:
A three-tier arrangement of dedicated Covid-19 health facilities in the country had been implemented to reduce the risk of cross-infection to non-Covid patients and to make provision for non-Covid essential health services. This three-tier arrangement of health facilities comprises (i) a Dedicated Covid Care Centre with isolation beds for mild or pre-symptomatic cases; (ii) a Dedicated Covid Health Centre oxygen-supported isolation beds for moderate cases, and (iii) Dedicated Covid Hospital with ICU beds for severe cases. Besides this, tertiary care hospitals under the ESIC, Defence, Railways, Central Armed Police Forces, Steel Ministry, etc., were also leveraged for case management. In addition, in many states, the Defence Research and Development Organisation (DRDO) has utilised large-scale field hospitals to rapidly scale up treatment capacities.
Oxygen Infrastructure Strengthening during Covid Pandemic
Pressure Swing Adsorption (PSA) Oxygen Generation Plants: PSA plants are being established in hospitals, especially in far-flung areas enabling the hospitals to become self-sufficient in the generation of oxygen for their needs and, thereby, reducing the burden on the medical oxygen supply grid across the country. It was emphasised that each district of the country should have at least 1 PSA plant from PM-CARES support at the public health facilities. Accordingly, 4,135 PSA plants are being established in the country, which enhances the oxygen generation capacity by 4,852 MT, as per details below. Ministry of Health and Family Welfare (MoHFW) has developed and shared the guidelines on indicative norms for setting up oxygen plants in all health facilities on 6 July 2021 with the states.
| Source | No. of PSA Plants | Commissioned |
| PM-CARES | 1225 | 1225 |
| Central Government PSUs | 283 | 283 |
| Foreign Aid | 53 | 50 |
| State/CSR Initiatives | 2574 | 2571 |
| Total | 4135 | 4127 |
* Data as on 28 December 2022
> Oxygen Cylinders: The Government has ensured an adequate supply of medical oxygen for patient care in the states. Until now, 4,02,517 oxygen cylinders have been supplied to States/UTs/ Central Government hospitals; which consists of 1.0 lakh by Central Medical Services Society (CMSS) in 2020; 1.3 lakh by CMSS in 2021; 1.5 lakh by DRDO in 2021 and 23,000 from foreign aid. The oxygen cylinder allocation has been performed in a transparent and participative manner with States/UTs.
> Moreover, MoHFW has also approved the distribution of additional 14,340 D-Type oxygen cylinders among states from UNICEF-ADB (Asian Development Bank) support, which is under process.
Oxygen Concentrators: A total of 1,13,186 oxygen concentrators have been procured by the Government for Covid management, i.e., 99,186 under PM-CARES through ONGC for use in rural areas; and 14,000 under Emergency Covid Response Package (ECRP) support. All these domestically procured concentrators have already been allocated to states/UTs. Moreover, states have been advised to promptly issue oxygen concentrators to districts with details of consignee points and promptly enter data pertaining to the receipt of oxygen concentrators at the district level on the OC-MIS portal (OxyCare MIS Portal).
Doctor-Patient Ratio
The intervention in the medicinal education system since 2014 has resulted in improved recruitment of doctors and supporting staff. As per National Medical Commission (NMC), 13,08,009 allopathic doctors are registered with the State Medical Councils and NMC as on June 2022. Assuming 80 per cent availability of registered allopathic doctors and 5.7 lakh AYUSH doctors, the doctor-population ratio in the country is 1:834 against the WHO norms of 1:1000.
Initiatives for increasing/hiring/recruitment of Doctors & Staff
To further augment the medical education facilities and improve the medical standards, the Government has envisaged various short and long-term measures, including: –
(a) A CSS for establishing new medical colleges by upgrading district/ referral hospitals, under which 157 new medical colleges have been approved, out of which 94 are already functional.
(b) A CSS for strengthening/ upgradation of existing State Government/Central Government Medical Colleges to increase the number of MBBS and PG seats.
(c) Under the “Upgradations of Government Medical Colleges by the construction of Super Specialty Blocks” of Pradhan Mantri Swasthya Suraksha Yojana (PMSSY) scheme, 75 projects have been approved.
(d) Under the Central Sector Scheme for setting up new AIIMS, 22 AIIMS have been approved. Undergraduate courses have started in 19 of these.
(e) Relaxation in the norms for setting up of Medical College in terms of the requirement for faculty, staff, bed strength, and other infrastructure.
(f) Diplomate of National Board qualification has been recognised for appointment as teaching faculty to take care of the faculty shortage.
(g) Enhancement of age limit for appointment/ extension/ re-employment against posts of teachers/ dean/principal/ director in medical colleges up to 70 years.
To summarise, ‘Public Health’ being a State Subject, all the administrative and personnel matters, including appointment/recruitment/ engagement of doctors and staff in public health facilities, lie with the respective State/UT Governments. No set of measures is sufficient to counter any instantaneous shock like the Covid pandemic, as the measures are designed with the assumption of ‘ceteris paribus’, meaning everything else remains the same. But the major difference is that we are operating in a new normal, and hence towards the end, it is all about better management of the crisis and planning ahead. Thus, the strong inventory India has built over the last few years will improve the country’s overall health infrastructure and governance system.
Box VI.10: Co-WIN: A successful digital story of vaccination to tell
The history of vaccines and vaccinations in India takes us back to 1802 when the first dose of vaccine was registered for smallpox.48 Tracing the medical history of the vaccines during those times was a rigorous task. However, in the contemporary scenario, we have substantially progressed in the digital journey, and most medical science searches are a ‘click’ away. Also, even before Covid arrived, India had laid down the strategy for mass vaccination as year-long programs were running for several other diseases. Over the years, the government focused on digital health service delivery by imbibing the basic philosophy of “Antyodaya”. However, the need for end-to-end digitisation in the vaccination process was felt as this was the only way to achieve herd immunity during the pandemic. While many economies had to develop a model from scratch, India was in a comfortable position. Thanks to the Government’s vision of the JAM trinity, the critical challenge was addressed in a time-bound manner through Co-WIN (Covid Vaccine Intelligence Network) in implementing the National Covid-19 Vaccination Programme.
Co-WIN has been developed as an extension of the eVIN (electronic Vaccine Intelligence Network) platform. A comprehensive cloud-based IT solution for planning, implementing, monitoring, and evaluating Covid-19 vaccination in India, the Co-WIN system provided an end-to-end solution with utilities for the entire public health system. The dual interface of the open platform made it scalable across citizen and administrator-centric services. To ensure accountability and transparency in supply chains for vaccination, the platform provided real-time stock tracking at the national, state, and district levels (Government and Private). This further plugged the wastage of Covid-19 vaccines, which otherwise occurred pre-Co-WIN.
Going beyond the users (admins, supervisors, and vaccinators), vaccination centres, and beneficiaries’ registration in 12 regional languages, the web solution extended the issuance of digitally verifiable certificates. The Vaccination Certificate was designed at par with WHO Guidelines to assist even international travellers. To reduce the burden of registration hinging on a single document (Aadhaar), the Government allowed registration using any of the 10 photo identity cards [Aadhaar Card, Driving License, PAN Card, Passport, Pension Passbook, NPR Smart Card, Voter ID, Unique Disability Identification Card,Ration Card with Photo, Student Photo ID card]. Tackling the problem of the digital divide and digital exclusion, multiple beneficiaries (up to six) were allowed onboarding using a single mobile number through the National Covid helpline. To ensure that those having limited access to physical facilities during times of Covid, either due to age, disability or identity, are not left out, special provisions through the “Workplace Covid Vaccination Centre” in the Government and private sector and also “Near to Home Covid Vaccination Centres “ were made available.
The present administration of more than 220 crore Covid-19 vaccine doses was made possible because of the robust digital infrastructure of Co-WIN. It was this broad interlock of digital framework and the Government’s vigour of continuously improving its outreach for better inclusion that India could register a quick and durable economic recovery while continuing to secure both lives and livelihoods. With more than 84.7 crore Co-WIN beneficiaries seeded with Aadhaar among the total 104 crore (between January 2021 to September 2022), the seeds of JAM sown in FY15 proved to be a life saver for the nation.
Social Protection for the Rainy Day
6.94 While growth can lift people out of the low-income trap, it may not be able to ensure that they no longer remain vulnerable to any crisis situations in their lifetime. Thus, it is important to protect citizens from risks posed by rainy days, such as health issues, natural disasters, old age, etc. Especially in the wake of the hardships posed by the pandemic, the government invested more resources in social protection programmes and continued to do so in the FY23 with the understanding that strong social protection systems can support the growth process. Some of the key programmes/schemes in this area are as listed below.
6.95 Pradhan Mantri Vaya Vandana Yojana (PMVVY): PMVVY is offered by the Life Insurance Corporation of India and supported by the Government of India, to provide senior citizens of age 60 years or more an assured minimum pension for a term of 10 years, linked to the price at which they purchase the pension policy. A total number of 8,59,708 subscribers are currently benefitting from the scheme through deposits worth `87,081.1 crore collectively under 11,97,159 policies as on 31 December 2022.
6.96 Pradhan Mantri Jeevan Jyoti Bima Yojana (PMJJY): The Scheme is available to people in the age group of 18 to 50 years and provides risk coverage of `2 lakh in case of death of the insured, due to any reason, at an annual premium of `436/. As on 11 January 2023, 14.96 crore persons have been enrolled cumulatively and 6,39,032 claims have been paid under PMJJY.
6.97 Pradhan Mantri Suraksha Bima Yojana (PMSBY): The Scheme is available to people in the age group 18 to 70 years providing a risk coverage of `2 lakh in case of accidental death or total permanent disability and `1 lakh for partial permanent disability due to accident at a premium of `20 per annum. As on 11 January 2023, 32.1 crore persons have been enrolled cumulatively and 1,10,298 claims have been paid under PMSBY.
6.98 Pradhan Mantri Shram Yogi Maan-Dhan Yojana (PM-SYMDY): Launched in March 2019, the PM-SYMDY is a voluntary and contributory pension scheme for providing a monthly minimum assured pension of `3,000 upon attaining the age of 60 years. The workers in the age group of 18 to 40 years having a monthly income of `15,000 or less and not a member of EPFO/ ESIC/ NPS (Govt. funded) can join the scheme. As of 2 November 2022, over 49.1 lakh beneficiaries have been enrolled under the Scheme.
6.99 PM Street Vendor’s Atmanirbhar Nidhi Scheme (PM SVANidhi): This is a Central Sector Scheme launched on 1 June 2020, to empower street vendors by extending working capital loans of up to `10,000 with a one-year tenure and free onboarding of beneficiaries on digital payment platforms. Beneficiaries are also eligible for the second tranche of loan up to `20,000 with 18 months tenure after timely repayment of the first tranche. The scheme is available for beneficiaries belonging to only those states/ UTs which have notified the Rules and Scheme under the Street Vendors (Protection of Livelihood and Regulation of Street Vending) Act, 2014. As on 12 January 2023, 45,74,866 loan applications have been sanctioned in all tranches together; out of which 39,43,094 loans have been disbursed.6.100Further, to provide loans on easier terms for income generating activities, the Pradhan Mantri Mudra yojana (PMMy) was launched in April 2015 to grant loans of up to `10 lakh for income-generating manufacturing, trading, and service sectors, including activities allied to agriculture such as poultry, dairy, beekeeping, etc. Under PMMY, both term loan and working capital requirements can be met. Loans are extended through Member Lending Institutions (MLIs) viz; Banks, Non-Banking Financial Companies (NBFCs) and Micro Finance Institutions (MFIs). The salient features of the Scheme are:
- Under the aegis of PMMY, MUDRA has created three products namely ‘Shishu’ (loans up to `50,000/-), ‘Kishore’ (loans above `50,000/ and up to `5 lakh) and ‘Tarun’ (loans above `5 lakh and up to `10 lakh) signify the stage of growth / development and funding needs of the beneficiary micro unit / entrepreneur and also provide a reference point for the next phase of graduation / growth;
- There is no insistence on collateral(s) during sanction of loan;
- Rate of Interest is decided by the lending institution, interest is charged only on the money held overnight by borrower;
- A Credit Guarantee Fund for Micro Units (CGFMU) was set up for guaranteeing loans extended to eligible micro units under PMMY by MLIs and overdraft loan amount sanctioned under Pradhan Mantri Jan Dhan Yojana (PMJDY) accounts.;
- From FY21 onwards, loans sanctioned to SHGs between `10 lakh to `20 lakh are also eligible for coverage under CGFMU. The National Credit Guarantee Trustee Company Ltd., a wholly-owned company of Government of India is the trustee of the Fund.
Present status
More than 38.4 crore loans, amounting to `21.5 lakh crore, have been sanctioned since the launch of the scheme. Out of this, more than 8.2 crore loans amounting to `6.8 lakh crore have been extended to new entrepreneurs/ accounts which is approximately 21 per cent of total loans extended under the scheme. About 68 per cent of the loans have been sanctioned to women entrepreneurs.
Development of India’s Aspiring Rural Economy
6.101 The percentage of the population living in India’s rural areas was as high as around 80 per cent in the 1960s and remained over 70 per cent till 2007. It presently stands at 65 per cent for 2021.49 Further, 47 per cent of the population is dependent on agriculture for livelihood. Thus, the focus of the government on rural development is imperative. The emphasis has been on improving the quality of life in rural areas to ensure more equitable and inclusive development. The aim of engagement of the government in the rural economy has been “transforming lives and livelihoods through proactive socio-economic inclusion, integration, and empowerment of rural India.”50
6.102 Various measures have been taken to enhance the quality of life in rural areas encompassing rural housing, drinking water, and sanitation, clean fuel, social protection, rural connectivity along with enhancing rural livelihoods. The financing needs of rural households and small businesses are being met through microfinance institutions, self-help groups (SHGs), and other financial intermediaries. Taking digitisation and technology to the rural economy has also been a key aspect of the rural development agenda, be it in agricultural activities or governance. A primary focus has also been on the health parameters of the rural population, with enhanced emphasis necessitated by the pandemic. The improvements in these aspects are discussed in the following paragraphs.
Multifaceted initiatives to improve the ecosystem of quality of life

6.103 The NFHS data for 2019-21 illustrates a significant improvement vis-à-vis 2015-16 in an array of indicators concerning the quality of rural lives, including, inter alia, access to electricity, presence of improved drinking water sources, coverage under health insurance schemes, etc. Women empowerment has also gained momentum, with visible progress in female participation in household decision-making, owning bank accounts, and use of mobile phones. Most of the indicators concerning the health of rural women and children have improved. These outcome-oriented statistics establish tangible medium-run progress in rural living standards, aided by the policy focus on basic amenities and efficient programme implementation. Some of the important schemes/programmes of the Government in various areas to improve the quality of life in rural areas are detailed in the following paragraphs.
Table Vi.20: Quality of rural lives – findings from the National Family Health Survey
| For Rural Areas | NFHS 4
(2015-16) |
NFHS 5
(2019-21) |
|
| Population | Sex ratio at birth for children born in the last five years (females per 1,000 males) | 927 | 931 |
| Total fertility rate (children per woman) | 2.4 | 2.1 | |
| Household Amenities |
Population living in households with electricity (per cent) | 83.2 | 95.7 |
| Population living in households with an improved drinking- water source51 | 89.3 | 94.6 | |
| Households using clean fuel for cooking52 (per cent) | 24.0 | 43.2 | |
| Population living in households that use an improved sanitation facility53 (per cent) | 36.7 | 64.9 | |
| Health | Households with any usual member covered under a health insurance/financing scheme (per cent) | 28.9 | 42.4 |
| Infant mortality rate | 46.0 | 38.4 | |
| Mothers who had an antenatal check-up in the first trimester (%) | 54.2 | 67.9 | |
| Mothers who consumed iron folic acid for 100 days or more when they were pregnant (per cent) | 25.9 | 40.2 | |
| Institutional births (per cent) | 75.1 | 86.7 | |
| Children aged 12-23 months fully vaccinated based on information from vaccination card only (per cent) | 61.3 | 84.0 | |
| Children aged 12-23 months who received most of their vaccinations in a public health facility (per cent) | 94.2 | 97.0 | |
| Prevalence of diarrhoea in the 2 weeks preceding the survey (per cent) | 9.6 | 7.7 | |
| Children under 5 years who are stunted (height-for-age) (per cent) | 41.2 | 37.3 | |
| Children under 5 years who are wasted (weight-for-height) (per cent) | 21.5 | 19.5 | |
| Children under 5 years who are underweight (weight-for- age) (per cent) | 38.3 | 33.8 | |
| Children age 6-23 months receiving an adequate diet | 8.8 | 11.0 | |
| Women whose Body Mass Index (BMI) is below normal (BMI <18.5 kg/ ) (per cent) | 26.7 | 21.2 | |
| Children aged 6-59 months who are anaemic (per cent) | 59.5 | 68.3 | |
| All women aged 15-49 years who are anaemic (per cent) | 54.3 | 58.5 | |
| Men aged 15-49 years who are anaemic (per cent) | 25.3 | 27.4 | |
| Women Empowerment | Currently married women who usually participate in three household decisions54 (per cent) | 83.0 | 87.7 |
| Women who worked in the last 12 months and were paid in cash (per cent | 25.4 | 25.6 | |
| Women owning a house and/or land (alone or jointly with others) (per cent) | 40.1 | 45.7 | |
| Women having a bank or savings account that they themselves use (per cent) | 48.5 | 77.4 | |
| Women having a mobile phone that they themselves use (per cent) | 36.9 | 46.6 | |
| Women who have ever used the internet (per cent) | na | 24.6 | |
| Women age 20-24 years married before age 18 years (per cent) | 31.5 | 27.0 |
Source: National Family Health Surveys (NFHS) 2015-16 and 2019-21, MoHFW
Enhancing Rural incomes
Deendayal Antyodaya yojana-National Rural Livelihood Mission (DAy-NRLM)
6.104 NRLM aims to enable economically weak households to access gainful self-employment and skilled wage employment opportunities resulting in sustainable and diversified livelihood options for them. This is one of the world’s largest initiatives to improve the livelihoods of the poor. The Mission seeks to achieve its objective through investing in four core components viz., (a) social mobilisation and promotion and strengthening of self-managed and financially sustainable community institutions of the rural poor women; (b) financial inclusion; (c) sustainable livelihoods; and (d) social inclusion, social development, and access to entitlements through convergence.
6.105 The cornerstone of the Mission is its ‘community-driven’ approach which has provided a huge platform in the form of community institutions for women empowerment. Rural women are at the core of the program which is extensively focused on their socio-economic empowerment by way of building their capacities, providing financial support, and training in order to enable them to undertake livelihoods activities and become financially independent. Nearly 4 lakh SHG members have been trained as Community Resource Persons (CRPs) (viz. Pashu Sakhi, Krishi Sakhi, Bank Sakhi, BimaSakhi, PoshanSakhi etc.) help in the implementation of the Mission at the ground level.
6.106 The Mission has its footprint across 6,880 blocks in 723 districts across all states and UTs (except Delhi and Chandigarh) under its implementation strategy. It has mobilised a total of 8.7 crore women from poor and vulnerable communities into 81 lakh SHGs. The progress of the programme on key components is summarised below.
Components of DAy-NRlM
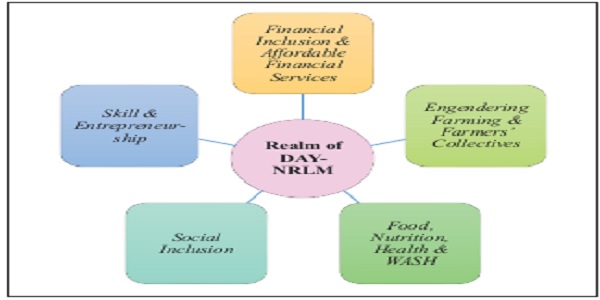
Table: Vi.21 Progress under DAy-NRlM
|
Indicator |
Cumulative progress (up to December 2022) |
| No. of Blocks covered | 6880 |
| No. of SHGs promoted (in lakh) | 81.1 |
| No. of Households mobilized (in lakh) | 875 |
| Capitalization Support provided to SHGs (in `crore) | 20250.0 |
| Amt. of Bank credit accessed by SHGs (in ` lakh crore) | 5.9 |
| No. of individual enterprises set up under SVEP55 (in ` lakh) | 2.2 |
| No. of vehicles deployed under AGEY56 | 2208 |
| No. of Mahila Kisan covered (in lakh) | 196.0 |
| No. of Custom Hiring Centres established | 26026 |
| No of households having kitchen garden (in lakh) | 110.3 |
Source: Ministry of Rural Development
Mahatma Gandhi National Rural Employment Guarantee Scheme
6.107 The Mahatma Gandhi National Rural Employment Guarantee Act 2005 (MGNREGA) aims at enhancing the livelihood security of households in rural areas of the country by providing at least 100 days of guaranteed wage employment in a financial year to every household whose adult members volunteer to do unskilled manual work. In case employment is not provided within 15 days from the date of registration of the demand for work or the date from which work has been demanded in case of advance applications, whichever is later, the worker is entitled to a daily unemployment allowance.
6.108 A total of 5.6 crore households availed employment and a total of 225.8 crore person-days employment has been generated under the Scheme (until 6 January 2023). The physical progress of MGNREGS in terms of person-days generation, average person-days per household, and participation of women are indicated below. Box VI.11 lists the achievements and governance measures under the MGNREGA.
Table VI.22: Progress under MGNREGS
|
Indicator |
2018-19 | 2019-20 | 2020-21 | 2021-22 | 2022-23* |
| Person-days generated (in crore) | 267.9 | 265.4 | 389.1 | 363.3 | 225.8 |
| Average person-days per household | 50.9 | 48.4 | 51.5 | 50.1 | 40.7 |
| Women participation rate (per cent) | 54.6 | 54.8 | 53.2 | 54.7 | 56.3 |
*as of 6 January 2023
Source: Ministry of Rural Development
Box VI.11: Achievements under MGNREGA
Geo-tagging of the Assets: Geo MGNREGA Phase-I was rolled out on 1 September 2016 for geo-tagging of all completed works which started before 1 November 2017, under the scheme. Geo-MGNREGA Phase-II was rolled out on 1 November 2017 and under this phase, the geo-tagging of assets is carried out in three stages viz: before initiation of work, during the work, and after completion of work. More than 5.2 crore assets have been geo-tagged (as of 6 January 2023) and made available in the public domain.
Mandatory expenditure on agriculture and allied activities: As per the provision of the Act, the District Programme Coordinator is required to ensure that at least 60 per cent of the works to be taken up in a district in terms of cost shall be for the creation of productive assets directly linked to agriculture and allied activities through development of land, water, and trees. The expenditure on agriculture and allied activities is 68.5 per cent in FY23 (as of 6 January 2023).
e-Payments: e-payments are done under MGNREGA using National Electronic Fund Management System (Ne-FMS)/ Electronic Fund Management System (e-FMS) for the payment of wages of workers directly to their bank/post office accounts. So far, total expenditure through NeFMS/e-FMS is 99.7 per cent.
DBT: Under the scheme, 99 per cent of wage seekers are receiving their wages directly into their bank accounts. It is a big step towards transparency.
Aadhaar-based payment: 14.0 crore Aadhaar have been seeded in Management Information System (MIS) which is 92.0 per cent of total active workers (15.3 crore). A total of 7.9 crore workers have been linked to Aadhaar Based Payment System. Some of the Good Governance initiatives under the Scheme are:
(a) The Job Cards (JC) need to be verified and updated from time to time to weed out the bogus JCs, duplicates, and for reasons like migration and death. The states/ UTs have taken up this exercise to verify/ update the JCs.
(b) As a good governance initiative, the number of Registers (average 22 Registers in a Gram Panchayat) being maintained at every Gram Panchayat has been brought down to seven Registers.
(c) Cases of violation of Guidelines and Schedules are being followed up regularly. The Interstate Standard Operating Procedures (SoP) for visits were developed to improve the quality of the social audit process for all the states/UTs. This SoP will ensure all the Social Audit compliance as per Audit Standard Rule, 2011 which includes the establishment of an independent social audit unit, independent social audit director, and complete human resources to be trained as Village Resource Persons (VRPs), timely calendar upload on MIS, timely conduct of the regular audit and uploading the issues on MIS within the stipulated timeline.
(d) MGNREGA workers are being trained under recent initiatives like Bare Foot Technicians (BFT) to move them up the skilling ladder. So far, 8,394 BFTs have been trained in 20 States.
(e) The project “UNNATI” intends to upgrade the skill base of the MGNREGS workers, and thereby improve their livelihoods so that they can move from their current partial employment to full employment. This project was launched in the FY20 and aims to enhance the skill base of 2 lakh MGNREGA beneficiaries in three years i.e., FY20, FY21, and, FY22. So far, about 27,383 candidates have been trained. UNNATI skilling project is meant to provide training to one adult member (of age 18-45 years) of a household who has completed 100 days of work under MGNREGA in the financial year from FY19. Full expenditures towards a stipend, against wage loss compensation, are entirely borne by the Central Government. A total of 2 lakh beneficiaries are to be imparted training in 26 States and 2 UTs.
(f) Around 5.5 crore households fall under the category of landless households dependent on manual casual labour for livelihood as per the SECC 2011. The Government is making all efforts to get these households, not having JCs, to obtain employment under MGNREGA. Around 4.6 crore such households have been surveyed.
(g) Area Officer Monitoring App was launched in May 2021, in a bid to facilitate the authorities to record their findings online. It will also help in recording time-stamped and geo-coordinate tagged photographs for all the schemes of the Department of Rural Development. It facilitates analysis of findings which in turn help in the implementation of the programme in a better manner.
(h) National Mobile Monitoring Software (NMMS) App was launched in May 2021 which permits taking real-time attendance of workers at MGNREGA worksites along with a geo-tagged photograph. This app is a big step towards bringing transparency and proper monitoring of the schemes and will help in increasing citizen oversight of the programme.
Deen Dayal upadhyaya Grameen Kaushalya yojana (DDu-GKy)
6.109 DDU-GKY is a placement-linked skill development programme for rural poor youth under the NRLM. It is a market-led, placement-linked skill development programme for providing wage employment to rural poor youth. Until 30 November 2022, a total of 13,06,851 candidates have been trained under this scheme of which 7,89,685 have got job placements.
Rural Housing
6.110 Housing is one of the basic necessities, along with food and clothing. “Housing for All by 2022” was rolled out to provide shelter with dignity for each and every one. With this target, the Pradhan Mantri Awaas Yojana –Gramin (PMAY-G) was launched in November 2016 with the aim of providing around 3 crore pucca houses with basic amenities to all eligible houseless households living in kutcha and dilapidated houses in rural areas by 2024. Through convergence with other Government Schemes, the PMAY-G also addresses basic needs such as the construction of the toilet, piped drinking water, electricity connection, LPG gas connection, and 90/95 person-days of unskilled labour from MGNREGS.
6.111 To ensure that assistance is targeted at those who are genuinely deprived and that the selection is objective and verifiable, PMAY-G selects beneficiaries using housing deprivation parameters in the SECC, 2011 date which is to be verified by the Gram Sabhas. Under the scheme, landless beneficiaries are accorded the highest priority in the allotment of houses. A total of 2.7 crore houses have been sanctioned and 2.1 crore houses have been completed by 6 January 2023 under the Scheme. Against the total target of completion of 52.8 lakh houses in FY23, 32.4 lakh houses have been completed.
Drinking Water and Sanitation
6.112 The UN-SDG6 aims to “Ensure availability and sustainable management of water and sanitation for all.” India has made considerable progress in providing drinking water and safe sanitation to urban and rural households. Some details of key schemes/programmes under operation towards achieving the SDG goal on water and sanitation, are listed below.
Jal Jeevan Mission
6.113 The Government has accorded the highest priority to improve the quality of life and enhance the ‘ease of living’ of people, especially those living in rural areas. On the 73rd Independence Day, 15 August 2019, the Jal Jeevan Mission (JJM) was announced, to be implemented in partnership with States, to provide tap water connection to every rural household and public institutions in villages like schools, Anganwadi centres, ashram shalas (tribal residential schools), health centres, Gram Panchayat building, etc., by 2024.
6.114 At the time of the rollout of the JJM in August 2019, about 3.2 crore (17 per cent) households out of the total of 18.9 crore rural households had a tap water supply. Since the launch of the Mission, as of 18 January 2023, of 19.4 crore rural households, 11.0 crore households are getting tap water supply in their homes. Further, four States, i.e., Goa, Gujarat, Telangana & Haryana, and three UTs, i.e., Andaman & Nicobar Islands, Dadra Nagar Haveli & Daman Diu and Puducherry have become ‘Har Ghar Jal’ State/ UT, i.e., 100 per cent households are having tap water supply. Similarly, 121 districts, 1,515 Blocks, 82,071 Gram Panchayats, and more than 1.5 lakh villages have also become ‘Har Ghar Jal Block’, ‘Har Ghar Jal Panchayat’, and ‘Har Ghar Jal Gaon’ respectively. Further, more than 8.8 lakh schools and 9.1 lakh Anganwadi centres are getting potable piped water supply. Box VI.12 provides more details about the Mission and how it is serving to improve public health.
Box VI.12: Jal Jeevan Mission as an Instrument of Public Health
A recent study by Kremer et al. (2022) estimated that supply of microbiological contamination freewater through Jal Jeevan Mission (JJM) can prevent 1.36 lakh deaths of under-5 children every year.57 Thus, water treatment is likely to have sizeable net benefits and is complementary to steps such as Swachh Bharat Abhiyan in preventing child mortality through improved hygiene.
With the availability of safe and potable drinking water at the doorstep of every rural household, water-borne diseases have drastically reduced from 1.8 crore in 2019 to 59.0 lakh in 2021, as per data from Directorate General of Health Services, M/o Health and Family Welfare.58
Steps taken for ensuring water quality
> JJM stresses on the provision of potable water of adequate quantity and good quality as prescribed by the Bureau of Indian Standards. Water quality monitoring & surveillance activities are given top priority under the mission.
> To bring focus on water supply, sanitation and hygiene (WASH), thus to improve public health, a nation-wide Water Quality Management Information System (WQMIS) has been launched on by using field testing kits as well as water quality testing in laboratories. The data is uploaded, analyzed and in case of quality issues, local authorities are alerted to take up immediate remedial action.
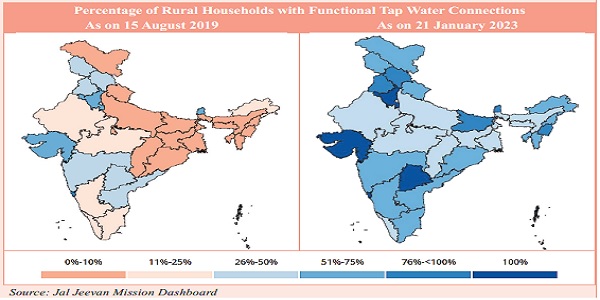
> Five women in each village, preferably including at least one ASHA worker and one Anganwadi worker, are being trained to test water samples of any kind of contamination by using Field Test Kits (FTKs). FTKs are procured and handed over to Panchayats. The FTK helps to test water on nine parameters viz. pH, alkalinity, chloride, nitrate, total hardness, fluoride, iron, residual free chlorine and H2S. Until December 2022, 16.2 Lakh women have been trained in nearly 2.0 lakh villages on Water Quality Testing through FTKs, and more than 58.0 Lakh water samples have been tested.
> There are 2,067 water testing laboratories in the country. Of these, 657 laboratories are NABL accredited. Water testing laboratories have been opened to the public to get their water samples tested at nominal rates. Many States have provided mobile vans to enable collecting and testing water samples in faraway remote villages. In FY23, until December 2022, more than 27.0 lakh water samples have been tested in laboratories.
> To assess the performance of various local water utilities in states/UTs, a functionality assessment exercise is undertaken every year to assess the status of water service delivery to households. As per functionality assessment of household tap connection – 2022, 87 per cent of the sample households received potable water.
> As on 10 October 2022, 8.7 lakh schools (84.6 per cent) and 8.9 lakh (80.6 per cent) Anganwadi centers across the country have been provided with potable tap water supply for drinking & cooking mid-day meals, hand-washing and use in toilets.
> 100-days water quality campaign “Swachh Jal Se Suraksha” was announced on 2 October 2022 focusing on awareness creation on the importance of water quality through Information, Education, and Communication, training activities and capacity building of villagers using citizen science approach.
> Five “Centers for Sustainable Drinking Water”, in various IITs, supported by the JJM are working on developing innovations and technologies for bringing sustainability in drinking water.
Mission Amrit Sarovar
6.115 Mission Amrit Sarovar was launched on National Panchayati Raj Day on 24 April 2022 with the objective to conserve water for the future. The Mission is aimed at developing and rejuvenating 75 water bodies in each district of the country during this Amrit Varsh, 75th Years of Independence. So far, against the initial target of 50,000 Amrit Sarovar, a total of more than 93,291 Amrit Sarovar sites have been identified and works have commenced on more than 54,047 sites. Out of these commenced works, a total of more than 27,071 Amrit Sarovars have been constructed so far. The impact of this initiative has been:
- About 32 crore cubic meters of water holding capacity has been enhanced
- ater Users’ groups have been associated with each Amrit Sarovar inter-alia improving the livelihoods base of the local community.
- Participation of freedom fighters, Martyr’s families, Padma Awardees, and other eldest citizens of the local areas helped in community participation at a large scale, promoting social harmony and patriotism, and making this mission a mass movement.
- People’s participation has been seen in this mission in a form of “Shram -Daan.”
- This will result in the creation of a total carbon sequestration potential of 1,04,818 tonnes of carbon per year.
JALDooT App
6.116 JALDOOT app was launched on 27 September 2022 for measuring the water level in a Gram Panchayat through 2-3 selected open wells twice a year (pre-monsoon and post-monsoon). Gram Rojgar Sahayak is required to measure the water level and document the same at the Central server using the Jaldoot mobile app. This will enable groundwater monitoring, water budgeting, and planning for water harvesting and conservation-related works. A total of 3,66,354 wells have been measured as on 7 December 2022.
Swachh Bharat Mission (Grameen)
6.117 Swachh Bharat Mission – Grameen (SBM(G)) was launched on 2 October 2014 to ensure cleanliness in India and make it Open Defecation Free (ODF). Having achieved the ODF status in all villages in the country as of 2 October 2019, Phase-II of SBM (G) is now being implemented during FY21 to FY25, with the focus to sustain the ODF status of villages and covering all the villages with Solid and Liquid Waste Management, i.e., to convert the villages from ODF to ODF Plus. About 1,24,099 villages have been declared ODF plus till 10 November 2022 under this Mission. Andaman & Nicobar Islands has declared all its villages as ODF plus model, thus becoming the first Swachh, Sujal Pradesh.
LPG connections
6.118 The government is continuing to support the vulnerable as commodity prices, including that of essentials, have remained volatile in the past year. This includes supporting the households with subsidised cooking fuel.
6.119 Pradhan Mantri Ujjwala Yojana 2.0, Swachh Indhan Behtar Jeevan. The ‘Pradhan Mantri Ujjwala Yojana’ (PMUY) was launched in May 2016 as a flagship scheme to make clean cooking fuel such as LPG available to rural and deprived households which were otherwise using traditional cooking fuels such as firewood, coal, cow-dung cakes, etc. The usage of traditional cooking fuels had detrimental impacts on the health of rural women as well as on the environment. The release of 9.5 crore LPG connections under the scheme has also helped in increasing the LPG coverage from 62 per cent on 1 May 2016 to 99.8 per cent as on 1 April 2021.
6.120 Under the Union Budget for FY22, provision for the release of an additional one crore LPG connections under the PMUY scheme, i.e., Ujjwala 2.0, has been made. This scheme will offer deposit-free LPG connection, first refill and hot plate free of cost to beneficiaries, and a simplified enrolment procedure. In this phase, a special facility has been given to migrant families. Under this Ujjwala 2.0 scheme, 1.6 crore connections have been released until 24 November 2022.
Rural connectivity
Pradhan Mantri Gram Sadak Yojana (PMGSY)
6.121 The objective of PMGSY is to provide single all-weather road connectivity to all eligible unconnected habitations of the designated population size (500+ in plain areas, 250+ in North-Eastern and Himalayan States) in rural areas of the country. The programme also has an upgradation component for those districts, where all the eligible habitations of the designated population size have been provided all-weather road connectivity. However, upgradation is just one of the components of the programme.
6.122 The programme has been launched in three phases with the latest third phase having been launched on 10 July 2019 for consolidation of 1,25,000 km through routes and major rural links connecting habitations, inter-alia, to Gramin Agricultural Markets, higher secondary schools, and hospitals. Since its inception, a total of 1,84,984 roads measuring 8,01,838 km and 10,383 Long Span Bridges (LSBs) have been sanctioned under all the interventions/ verticals of PMGSY. 1,73,775 number of roads measuring 7,23,893 km and 7,789 LSBs have been completed.
6.123 he scheme has helped immensely in providing access to basic services and lifting the income of rural masses. Various independent impact evaluation studies were carried out on PMGSY, which have concluded that the scheme has had a positive impact on agriculture, health, education, urbanization, employment generation, etc.
Electricity
SAUBHAGYA- Pradhan Mantri Sahaj Bijli Har Ghar Yojana
6.124 The government launched the Pradhan Mantri Sahaj Bijli Har Ghar Yojana – Saubhagya in October 2017 with the objective to achieve universal household electrification by providing electricity connections to all willing un-electrified households in rural areas and all willing poor households in urban areas in the country by March 2019. The Scheme involved the organisation of camps in villages/clusters villages for on-spot registration and the release of connections. The connections were given free for economically poor households and for others `500 was charged after the release of the connection in 10 instalments. The Saubhagya scheme has been successfully completed and closed on 31 March 2022.
Deendayal Upadhyaya Gram Jyoti Yojana (DDUGJY)
6.125 This scheme was launched in November 2014 with the objective to improve the quality and reliability of power supply in rural areas. It envisaged the creation of basic electricity infrastructure in villages/habitations, strengthening & augmentation of existing infrastructure, and metering of existing feeders/distribution transformers/consumers to improve the quality and reliability of power supply in rural areas. Further, last-mile connectivity and free electricity connections were also provided to BPL households only identified by the States as per their list.
6.126 A total of 2.9 crore households have been electrified since the launch of the Saubhagya period in October 2017 under various schemes viz (Saubhgaya, DDUGJY, etc.)
Direct Benefit Transfer: A Game Changer
6.127 The Economic Survey 2014-15 showed that although price subsidies are widely used as part of a standard toolkit by Governments in India in their anti-poverty programmes, they are often regressive, distort the markets in ways that ultimately hurt the economically weak and the leakages thereof seriously undermine the effectiveness of price as well as product subsidies. These distortions and leakages are such that they have an adverse impact on social welfare. It was recommended that the benefit that price subsidies seek to create for the poor can be directly transferred to the poor through lump-sum income transfers, avoiding the distortions that price subsidies induce. Eliminating or phasing down subsidies is neither feasible nor desirable unless accompanied by other forms of support to cushion the poor and vulnerable and enable them to achieve their economic aspirations. The JAM Number Trinity – Jan Dhan Yojana, Aadhaar and Mobile numbers – has allowed the Government to offer this support to identified households in a targeted and less distortive way in the form of DBT.
6.128 Since the inception of DBT, cumulative transfers of over `26.5 lakh crore in respect of Central schemes have been made through the DBT route. In this process, total savings of over `2.2 lakh crore have accrued as on 31 March 2021 for Central schemes alone due to the removal of 9.4 crore duplicate, fake/non-existent beneficiaries across databases.
6.129 With the onset of the Covid-19 pandemic and the imposition of lockdown and enforcement of social distancing norms, the DBT ecosystem faced a tough trial and emerged as a means of relief to millions of citizens whose livelihoods were impacted. DBT played a major role in sustaining life, especially for the underprivileged segments of society, helping millions by providing immediate relief. Cash transfers under central schemes like PM-KISAN, MGNREGS, National Social Assistance Programme (NSAP), Pradhan Mantri Matru Vandana Yojana (PMMVY), NRLM, National Health Mission (NHM), scholarship schemes of various ministries through the National Scholarship Portal (NSP) and food subsidy under Pradhan Mantri Garib Kalyan Ann Yojana and Atma Nirbhar Bharat Package were a big relief for all the adversely affected masses of India during the Covid-19 period.
6.130 To make DBT schemes more accessible and transparent, major DBT schemes are being end-to-end digitized (EED) with provision for online and mobile-based access. 170 and 150 Central Government DBT schemes are EED and available on Unified Mobile Application for New Age Governance (UMANG) mobile platform respectively. Similarly, over 1000 States / UTs DBT schemes are EED. For citizens who do not have access to smartphones, services available on UMANG are also available in assisted mode through Common Service Centres (CSCs) across India. The citizen experience in accessing DBT schemes through the UMANG app is markedly rich since UMANG offers a well-catalogued bouquet of services in multiple Indian languages to cater to a wide audience.
6.131 India’s successful implementation of DBT has won praise from the International Monetary Fund and World Bank, among other international organizations, for efficiently providing support (subsidies, food grain, and cash benefits directly) to large masses at low-income levels (85 per cent of rural households and 69 per cent of urban households). Box VI.11 informs the progress the JAM-trinity-based DBT framework of social security schemes in India.
Box VI.13: Progress in Direct Benefit Transfer Scheme
DBT was launched in 2013 to re-engineer the then-existing delivery processes using modern Information and Communication Technology (ICT) to transfer benefits directly into the preferably Aadhaar-seeded bank accounts of accurately targeted beneficiaries. In the span of the past decade, DBT has expanded from a mere 24 schemes (as part of a pilot programme) in 43 districts in 2013 to over 300 Central schemes and greater than 2000 State schemes across India by December 2022.
Table: Overall DBT Progress Report
| 2013-14 | 2016-17 | 2018-19 | 2019-20 | 2020-21 | 2021-22 | 2022-23 (Till 5 Jan2023) |
|
| No of DBT Schemes |
28 | 142 | 440 | 426 | 316 | 313 | 310 |
| Total Funds Transferred (in `crore) | 7,368 | 74,689 | 3,29,796 | 3,81,632 | 5,52,527 | 6,30,265 | 3,80,380 |
| Cash schemes | 7,368 | 74,689 | 2,14,092 | 2,39,729 | 2,96,578 | 2,68,139 | 1,71,842 |
| In-kind schemes | – | – | 1,15,704 | 1,41,902 | 2,55,950 | 3,62,126 | 2,08,538 |
| Eligible
Beneficiaries [non-unique] (in crore) |
10.8 | 35.7 | 129.2 | 144.7 | 179.9 | 178.9 | 159.5 |
Source: Data as reported by Ministries / Departments to DBT Mission, Cabinet Secretariat In the years of its operation, the DBT paradigm has enabled:
- Accurate identification & targeting of beneficiaries
- Greater inclusion and ease of availing services through online application;
- Transparency in fund transfers to beneficiaries;
- Curbing of leakages in the benefit delivery processes through the elimination of middlemen/agents;
- Creation of greater accountability on behalf of the Government;
- Facilitating reforms in Government processes through re-engineering;
- Increase in efficiency in scheme delivery processes; and
- Effectiveness of schemes through timely implementation.
Enhancing Rural Governance for Inclusive Growth
6.132 Good rural governance is imperative to help translate various programmes and schemes of the Government at the grassroots level, ensure equal rights to all, and achieve sustainability of rural development programmes. Some of the recent measures taken towards improving rural governance are narrated below.
Rashtriya Gram Swaraj Abhiyan
6.133 A CSS of Rashtriya Gram Swaraj Abhiyan (RGSA) was approved by the Union Cabinet in April 2018 for implementation from FY19 to FY22 with the primary aim of strengthening Panchayati Raj Institutions (PRIs) for achieving SDG’s with the main thrust on convergence with Mission Antyodaya and emphasis on strengthening PRI’s in the 117 Aspirational Districts. The scheme extends to all states and UTs including non-Part IX of the Constitution of India areas where Panchayats do not exist.
6.1334 The major focus of the scheme of RGSA was Capacity Building and Training (CB&T) to empower PRIs and to prepare convergent Plans at the respective level of Panchayats. Under the Scheme, not only around 31 lakh elected representatives (ERs) have been capacitated through various modes of training but also functionaries and other stakeholders of Panchayats including SHG members have been provided training for better SHG-PRIs convergence at the grassroots level to create an ecosystem to prepare inclusive village poverty reduction plan.
6.135 The scheme has been revamped and approved in April 2022 for implementation over the period FY23 to FY26. The focus of the scheme of Revamped RGSA is on re-imagining PRIs as vibrant centres of local self-governance with a special focus on the Localisation of SDGs (LSDGs) at the grassroots level adopting thematic approach through concerted and collaborative efforts of Central Ministries and State line departments and other stakeholders with ‘Whole of Government and Whole of Society’ approach. The Scheme has been formulated with the aim to strengthen the capacities of institutions for rural local governance to become more responsive towards local development needs, prepare participatory plans leveraging technology, and efficiently utilise available resources for realising sustainable solutions to local problems linked to SDGs adopting the nine thematic approaches of LSDGs.59
SVAMiTVA Scheme
6.136 SVAMITVA (Survey of Villages and Mapping with Improvised Technology in Village Areas) is a Central Sector Scheme launched on 24 April 2020, the National Panchayati Raj Day. The scheme aims to provide the ‘Record of Rights’ to village household owners possessing houses in inhabited rural areas. The scheme covers multifarious aspects viz. facilitating monetization of properties and enabling bank loans; reducing property-related disputes; comprehensive village-level planning, which would be the stepping-stone towards achieving Gram Swaraj in the true sense and making rural India Atmanirbhar. The scheme aims to provide the following benefits:
- Creation of accurate land records for rural planning and reducing property-related disputes.
- To bring financial stability to the citizens in rural India by enabling them to use their property as a financial asset for raising loans and other financial benefits.
- Determination of property tax, which would accrue to the Gram Panchayats directly in states where it is devolved or else, add to the state exchequer.
- Creation of survey infrastructure and GIS maps that can be leveraged by any department for their use.
- 59 Following are the themes for LSDGs: Poverty Free and Enhanced Livelihoods in Village; Healthy Village; Child-Friendly Village; Water Sufficient Village; Clean and Green Village; Village with Self-Sufficient Infrastructure; Socially Secured and Socially Just Village; Village with Good Governance and Women Friendly Village.
- To support the preparation of a better-quality Gram Panchayat Development Plan by making use of GIS maps.
6.137 As on 31 December 2022, drone surveys have been completed in 2.15 lakh villages across the country, and saturated in the States of Haryana, Uttarakhand, Goa, and UT of Lakshadweep, A&N Islands, Delhi, Puducherry, and Dadra & Nagar Haveli, and Daman & Diu. Over one crore property Cards have been prepared for nearly 65,000 villages. Property Cards of all the inhabited villages of Haryana followed by Uttarakhand, and Puducherry has been prepared.
Conclusion and Way Forward
6.138 History suggests that when different aspects of human development like education, skill, employment, health, and rural development are dovetailed with technology, all-round revolutionary innovation resulting in technology-led growth and prosperity follows. The Hon’ble Prime Minister observed in 2015:
“The government must nurture an eco-system:
– where the economy is primed for growth; and growth promotes all-round development;
– where development is employment-generating; and employment is enabled by skills;
– where skills are synced with production; and production is benchmarked to quality;
– where quality meets global standards; and meeting global standards drives prosperity
Most importanty, this prosperity is for the welfare of all” 60
6.139 Today, India is moving towards the attainment of the UN SDGs. While doing so, it is cognisant of the fact that for equitable development, a country as vast and diverse as India requires the implementation of broad-based inclusive social policies, supported by adequate and commensurate financial resources. Thus, the character and contour of such an approach to development presents a unique set of challenges which is consistently being addressed in the form of mindful reforms. Ensuring that intended outcomes of social sector development schemes reach the intended, involvement of the grassroot level of governance is imperative and is being actively pursued. Technology has been a great enabler in ensuring the last-mile connectivity of government schemes to the targeted citizens. It has revolutionised the delivery of services while ensuring transparency and accountability. It needs to be harnessed further to help the government attain the lofty SDGs on the social front.
6.140 As India marches ahead, the ground lost as regards social sector improvements due to the pandemic, has largely been recouped, powered by prompt policymaking and efficient implementation interwoven with technology. Going forward with the vision of ‘Minimum Government; Maximum Governance’, further developments will hold the key to attaining more equitable economic growth. Evident ones include stepping up learning outcomes through digital and teaching interventions in schools, enhancing the role of community workers in healthcare, pushing SHGs through better product design and upscaling enterprises. Further, channelising women’s economic potential through ecosystem services such as affordable market alternatives for care work, safe transportation and lodging, and long-term counselling support, can help capitalise the gender dividend for the country’s future economic and social development.
******
Notes:-
1 For example: Martha Nussbaum and Amartya Sen, ed. (1993). The Quality of Life, Oxford: Clarendon Press. and Barcaccia, Barbara (4 September
2013). “Quality of Life: Everyone Wants It, But What Is It?”. Forbes/ Education.
2 Transforming our world: the 2030 Agenda for Sustainable Development, Resolution adopted by the General Assembly on 25 September 2015
3 Social services include education, sports, art, and culture; medical and public health, family welfare; water supply and sanitation; housing; urban development; the welfare of SCs, STs and OBCs, labour and labour welfare; social security and welfare, nutrition, relief on account of natural calamities, etc.
4 Expenditure on ‘Health’ includes expenditure on ‘Medical and Public Health’, ‘Family Welfare’, and ‘Water Supply and Sanitation.
5 Expenditure on ‘Education’ pertains to expenditure on ‘Education, Sports, Arts, and culture.
6 The Human Development Report published by the UNDP estimates the HDI in terms of three basic parameters: to live a long and healthy life; to be educated and knowledgeable and to enjoy a decent economic standard of living. It is calculated using 4 indicators – life expectancy at birth, mean years of schooling, expected years of schooling, and the GNI per capita.
7 Released on 8 September 2022 and provides ranking for the year 2021.
8 South Asia includes Afghanistan, Bangladesh, Bhutan, India, Islamic Republic of Iran, Maldives, Nepal, Pakistan, Sri Lanka
9 The index measures inequality in achievement between women and men in three dimensions, viz. reproductive health, empowerment, and the labour market. It shows the loss in potential human development due to inequality between female and male achievements in these dimensions. The value of GIII ranges from 0, where women and men fare equally, to 1, where one gender fares as poorly as possible in all measured dimensions.
10 https:// www.livemint.com/opinion/online-views/villages-at-the-periphery-and-the-changing-face-of-backwardness-11669313591060.html
11 “’Adhaar’ most sophisticated ID programme in the world: World Bank”. Daiji World, Quoted from an interview with Bloomberg.
12 Source: National Payments Coporation of India.
13 For a person to be categorised as employed as per usual status (ps+ss), he/she must have pursued an economic activity for at least 30 days during the 365 days preceding the date of the survey.
14 According to the PLFS, LFPR is the percentage of working-age population engaged in work or making tangible efforts to seek ‘work’ or being available for ‘work’ if it is available. ‘Work’ includes self-employment (subsistence agriculture and collection of firewood, poultry farming, etc, for self-consumption), regular wage/salaried employment, and casual labour.
15 WPR is defined as the per centage of employed persons in the total population.
16 UR is defined as the per centage of unemployed persons in the labour force.
17 This is the lastest available annual survey released in June, 2022.
18 For a person to be categorised as employed as per current weekly status, he/she must have pursued an economic activity for at least 1 hour during the seven days preceding the date of survey.
19 In the NSSO survey questionnaires, activity status codes are assigned to each household member, according to their primary activity undertaken. Activity code 93 refers to “engaged in domestic duties and also engaged in free collection of goods (vegetable, firewood, cattle feed, etc.), tailoring, etc. for household use”.
20 Kapsos, S., Bourmpola, E., Silberman, A. (2014), “Why is female labour participation rate declining so sharply in India?”, ILO Research Paper No. 10
21 Discenza, A., Gaddis, I., Palacios-Lopez, A., Walsh, K. (2021). Measuring Women and Men’s Work: Main Findings from a Joint ILO and World Bank Study in Sri Lanka.
22 The 19th International Conference of Labour Statisticians in 2013 adopted a new set of norms to expand the set of productive activities classified as ‘work’, comprising any activity performed by persons of any sex and age to produce goods or to provide services for use by others or for own use. The definition of work is aligned with the General production boundary as defined in the System of National Accounts 2008, including own use production work and volunteer work.
23 A SHG is a socially and economically homogenous group of up to 20 persons, formed voluntarily for the collective purpose of savings and credit, with no insistence on collateral for loans and end usage of credit.
24 Brody, C, De Hoop, T, Vojtkova, M, Warnock, R, Dunbar, M, Murthy, P and Dworkin, SL (2016). “Economic Self-Help Group Programmes for Improving Women’s Empowerment: A Systematic Review”, 3ie Systematic Review. London: International Initiative for Impact Evaluation (3ie)
25 Datta, U. (2015). “Socio-economic impacts of jeevika: A large-scale self-help group project in Bihar, India”, World Development, 68:1-18.
26 Pandey, V., Gupta, A., and Gupta, S. (2019). “Labour and welfare impacts of a large-scale livelihoods program: Quasi-experimental evidence from India”, Policy Research Working Paper No. 8883, World Bank.27 IRMA (2017). “Independent Assessment of Design, Strategies and Impacts of DAY-NRLM”, p. xvii and p. 198-99.
28 The latest Report on Fourth Round (January-March, 2022) of QES was released in September 2022.
29 The results of ASI 2019-20 were released in 2022.
30 Total Persons Engaged include the employees as defined above and all working proprietors and their family members who are actively engaged in the work of the factory even without any pay, and the unpaid members of the co-operative societies who worked in or for the factory in any direct and productive capacity.
31 Data from Pension Fund Regulatory and Development Authority (PFRDA).
32 Rapid Assessment of Natural Resource Management Component under MGNREGA and Its Impact on Sustainable Livelihoods, Institute of Economic Growth, May 2018
33 http://labourbureaunew.gov.in/showdetail.aspx?pr_id=iBJEgR8%2bUFY%3d
34 GER is defined as total enrolment in a particular level of school education, regardless of age, expressed as a per centage of the population of the official age-group which corresponds to the given level of school education in a given school year.
35 UDISE+ data comes with more than one-year lag; so data is available up to 2021-22.
36 Dropout rate is defined as proportion of pupils from a cohort enrolled in a given level in a given school year that are no longer enrolled at any grade in the following school year.
37 Youth in India 2022, MoSPI
38 NHA estimates for India 2018-19 is the sixth consecutive NHA estimates report prepared by NHSRC, designated as National Health Accounts Technical Secretariat in 2014 by the Union Health Ministry. This was released on 12 September 2022.
39 GHE constitutes spending under all schemes funded and managed by Union, State, and Local Governments including quasi-Governmental organisations and donors in case funds are channelled through Government organisations.
40 THE constitutes current and capital expenditures incurred by government and private sources including external funds.
41 CHE constitutes only recurrent expenditures for healthcare purposes net all capital expenditures.
42 OOPE are expenditures directly made by households at the point of receiving health care. This expenditure is usually incurred when an individual’s visit to healthcare provider (clinic/ hospital/ pharmacy/ laboratory etc.) is not provided for ‘free’ through a government health facility or a facility run by a not-for-profit organisation or if this individual is not covered under a government/ private health insurance or social protection scheme.
43 Miguel, E. & Kremer, M. (2004). Worms: Identifying impacts on education and health in the presence of treatment externalities. Economet-rica, 72:159-217.
44 Ozier, O. (2018). Exploiting Externalities to Estimate the Long-Term Effects of Early Childhood Deworming. American Economic Journal: Applied Economics. 10(3):235-262
45 Baird, S., Hicks, J.H., Kremer, M. & Miguel, E.(2016). Worms at Work: Long-run Impacts of a Child Health Investment. The Quarterly Journal of Economics, 131(4):1637-1680.
46 Hamory, J., Miguel, E., Walker, M., Kremer, M. & Baird, S. (2021). Twenty-year economic impacts of deworming. Proceedings of the National Academy of Sciences, vol 118(14).
47 Economic Survey 2021-22 and 2020-21 (Chapter 1 “State of the Economy” and Chapter 10 “Social Infrastructure and Employment”).
48 https://www.ncbi.nlm.nih.gov/pmc/articles/PMC4078488/
49 Source: World Bank staff estimates based on the United Nations Population Division’s World Urbanisation Prospects: 2018 Revision.
49 Source: World Bank staff estimates based on the United Nations Population Division’s World Urbanisation Prospects: 2018 Revision.
51 Piped water into dwelling/yard/plot, piped to a neighbour, public tap/standpipe, tube well or borehole, protected dug well, protected spring, rainwater, tanker truck, cart with small tank, bottled water, community RO plant.
52 Electricity, LPG/natural gas, biogas.
53 Flush to the piped sewer system, flush to a septic tank, flush to pit latrine, flush to don’t know where, ventilated improved pit (VIP)/biogas latrine, pit latrine with slab, twin pit/composting toilet, which is not shared with any other household. This indicator does not denote access to a toilet facility.
54 Decisions about health care for herself, making major household purchases, and visits to her family or relatives.
55 Start-Up Village Entrepreneurship Programme
57 Kremer, M., Saletore, A., Więcek, W., Baker, A. (2022). Potential reduction in child mortality through expanding access to safe drinking water in India, Jal Jeevan Samvad, November 2022, Department of Drinking Water and Sanitation. This was based on the meta-analysis in Kremer, M., Luby, S., Maertens, R., Tan, B., Więcek, W. (2023). Water Treatment and Child Mortality: A Meta-analysis and Cost-effectiveness Analysis, Development Innovation Lab, working paper no. 2022-26
58 https://pib.gov.in/PressReleasePage.aspx?PRID=1796173


