“Lord, give me chastity and continence but not yet.”
– St. Augustine
Most states achieved and maintained the target fiscal deficit level (3 percent of GSDP) and eliminated the revenue deficit soon after the introduction of their Fiscal Responsibility Legislation (FRL). However, the FRL was not the sole impetus behind this impressive fiscal performance. Acceleration of GDP growth, increased transfers from the Centre, decline in interest payments and increased central CSS expenditure contributed significantly to such consolidation. Desisting from splurging rather than belt-tightening was probably the real contribution of the States. Fiscal challenges are mounting because of the Pay Commission recommendations, slowing growth, and rising payments from the UDAY bonds. Moreover, macro-economic conditions will not be as favorable to states as they were in the mid-2000s. Going forward greater market-based discipline on state government finances will be a major imperative. And, the Centre must take the lead not only in incentivizing fiscal prudence by states but also by acting as a model through its own fiscal management.
I. INTRODUCTION
6.1 The problem of fiscal management is the lure of eternal procrastination. To advance rather than defer the desirable goal of fiscal prudence, India like several other countries, embarked in the mid-2000s on an ambitious project of fiscal consolidation, adopting fiscal rules aimed at curbing fiscal deficits. The most well-known and best-studied part of this project was the Fiscal Responsibility and Budget Management (FRBM) Act, adopted by the centre in 2003. This Act was mirrored by Fiscal Responsibility Legislation (FRL) adopted in the states, laws that were no less important than the FRBM, since states account for roughly half the general government deficit. Other work has shown that states’ fiscal position improved after 2005 and that some of this improvement can be attributed to the FRL (see Topalova and Simone, 2009, Chakraborty and Dash 2013). This chapter extends this analysis using more recent and novel data on state finances, budgeting procedures and off-budget expenditure.
6.2 At first blush, the FRL seem enormously successful. The financial position of the states improved considerably after 2005, based on any measure (Figure 1). The average revenue deficit was entirely eliminated, while the average fiscal deficit
Figure 1. Trend in Deficits, Debt 1994-2014
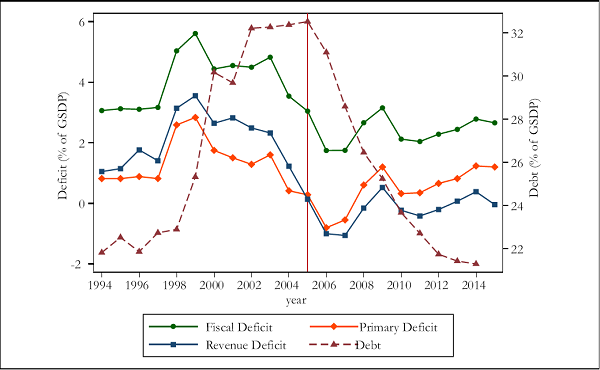
was curbed to less than 3 percent of GSDP, just as the FRL had mandated. The average debt to GSDP ratio accordingly fell by 10 percentage points to a mere 22 percent of GSDP in 2013.
6.3 Yet just because fiscal progress followed the introduction of the FRL doesn’t mean the FRLs were responsible for this progress. To begin with, the deficit reduction owes much to favorable exogenous factors:
- An acceleration of nominal GDP growth (of 6 percentage points on average) helped boost states’ revenues by about 1 percent of GSDP;
- Increased transfers from the centre of about 1 percent of GSDP both because of the 13th Finance Commission recommendations and the surge in central government revenues;
- Reduced interest payments of about 0.9 percent of GSDP on account of the debt restructuring package offered by the centre; and
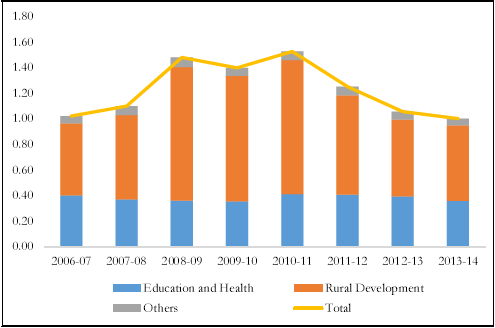
- Reduced need for spending by the states—estimated at about 1.2 percent of GDP—as the centre took on a number of major social sector expenditures under the Centrally Sponsored Schemed (CSS) (see Figure 2). From the states’ perspective, this amounted to off-budget spending.
Figure 2. Centre’s Contribution to Centrally
Sponsored Schemes (CSS) (as % of GDP)
6.4 Accordingly, two questions arise, which this chapter attempts to address:
- To what extent did the FRL really make a difference – and in what ways?
- What are the lessons for future fiscal rules?
II. SUMMARY OF THE FISCAL RESPONSIBILITY LEGISLATION
6.5 The FRL aimed to impose fiscal discipline through a number of mechanisms:
- Fiscal targets were established, which were the same for all states: the overall deficit was not allowed to exceed 3 percent of GSDP at any point, while the revenue deficit was to be eliminated by 2008/9 (later extended to 2009/10).
- The 12th Finance Commission allowed states to borrow directly from the market, in the hope that investors would also exercise some discipline, by pushing up interest rates on states whose fiscal position had not improved.
- Finally, broad public discipline was enhanced by introducing new reporting States were required to publish annual Medium-Term Fiscal Policy reports, which would project deficits over the next three to four years, accounting for growth in big ticket expenditure items like pension liabilities.
6.6 The fiscal deficit target was relaxed temporarily to 3.5 percent of GSDP in 2008/9 and to 4 percent of GSDP in 2009/10 in light of the global financial crisis (RBI, 2010). By FY 2010, the targets were set to the original FRL level of 3 percent. Subsequently, the 14th Finance Commission (FFC) recommended that fiscal deficit limits were to be relaxed by 0.5 percentage points for states which meet three conditions: (1) zero revenue deficit in the previous year; (2) debt to GSDP ratio lower than 25 percent; and (3) interest payments to GSDP ratio less than 10 percent of GSDP.
III. ASSESSMENT METHODOLOGY
6.7 One reason why figures on fiscal progress since 2005 give a misleading impression of the impact of the FRL is that not all states adopted FRL in that year. For example, five early adopters – Karnataka, Kerala, Uttar Pradesh, Punjab and Tamil Nadu — enacted their legislation even before the central government did so in 2003. Many others adopted FRLs in 2005/6, while in a few states legislation did not fall into place until 2010 (Figure 3).
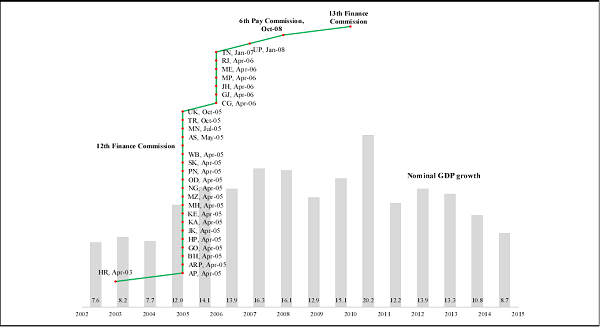
6.8 During this period, many other developments occurred that had a profound impact on fiscal positions (Figure 4). States adopted value added taxes (VAT), the 6th Pay Commission wage awards were granted, the 12th and 13th Finance Commissions made substantive changes to central government transfers to states. This was also a period of high nominal GDP growth, which averaged 15.8 percent between 2005 and 2010. So a second challenge is to distinguish the impact of the FRL in imposing fiscal discipline from the impact of these concurrent policy changes and macro-economic trends.
6.9 To deal with these issues, the assessment takes the following approach. We calculate using “FRL time”, based on the number of years before or after the particular FRL was adopted. For example, Kerala passed their FRL in 2003 while Haryana adopted theirs in 2005. So year 1 following the FRL is 2004 for Kerala and 2006 for Haryana. This methodology has the advantage that it allows one to answer questions about the first-year and longer-term impacts of adopting an FRL.
6.10 Using FRL time has a second advantage, in that it helps isolate the impact of FRL from other factors affecting fiscal deficits, such as the 6th Pay Commission. This isolation is not complete, of course, but neither is it negligible. For example,
Figure 3. Fiscal Responsibility Legislation by States
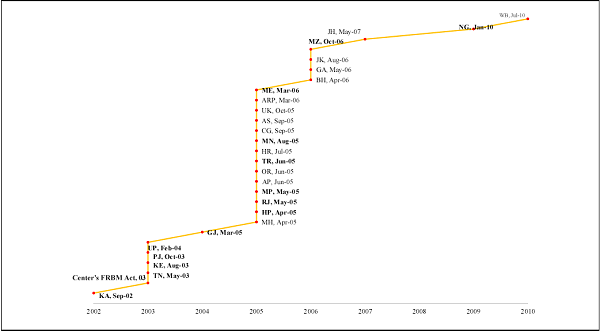
Figure 4. State-wise Adoption of Value Added Tax and Other Major Fiscal Events 2002-2015
Haryana’s year 1 deficit (in 2006) includes the effect of VAT adoption, upward trend in GSDP growth and central transfers while Kerala’s (in 2004) does not. So an average across all states in FRL time reduces the role of external factors, compared to averages based on calendar time, particularly if the factors apply to specific years (such as pay awards). The regression analysis (Appendix Tables 1 & 2), we account for some of these major external factors more rigourously.


