I want the cultures of all lands to be blown about my house as freely as possible. But I refuse to be blown off my feet by any.
– Mahatma Gandhi
Advanced countries have embraced fiscal activism, giving a greater role to counter-cyclical policies and attaching less weight to curbing the debt stock. But India’s experience has taught the opposite lessons. It has reaffirmed the need for rules to contain activism, so as to rein in excessive spending during booms and inordinate deficits during downturns, a pattern that contributed to both recent episodes of severe macro-economic instability (1991 and 2013). India’s experience has also highlighted the risk of relying on rapid growth rather than steady primary balance adjustment to reduce debt, a strategy that has failed to place the debt-GDP ratio firmly on a downward path. These flow and stock vulnerabilities are the subject of review under the new FRBM Committee.
1. Introduction
5.1 Since the government came to power, there has been a steadfast commitment to fiscal consolidation, reflected in the steady decline in the fiscal deficit from 4.5 percent of GDP in 2013-14 to 4.1 percent, 3.9 percent, and 3.5 percent over the successive three years. What should be the direction of future fiscal policy? This question has become salient for both international and domestic reasons.
5.2 Since the 2008-09 Global Financial Crisis (GFC), monetary policy has experienced a paradigm shift. Called upon to shore up economic activity in the face of severe tailwinds, monetary policy makers have ventured into realms they had never been before: near-zero interest rates, quantitative easing in the form of exploding central bank balance sheets, and eventually, upturning all normal intuitions, even to negative interest rates so that economic agents are actually paid to hold money.
5.3 Now that monetary easing has run its course, attention has increasingly turned to the role of fiscal policy. And here too there has been a paradigm shift. This shift in conventional wisdom, articulated most clearly recently by Jason Furman of President Obama’s Council of Economic Advisers1, comprises the following:
- Fiscal policy can legitimately be used for counter-cyclical policy;
- It is particularly effective when monetary policy is at the zero lower bound, because at that point multipliers are large, close to 1.5;
- And because fiscal policy is effective in increasing GDP, it will lead to significant increases in tax revenue, meaning that fiscal activism can partly pay for itself (Gaspar, Obstfeld, and Sahay 2016);
- In any event, estimates of sustainable debt levels should be revised upwards, because interest rates will remain low;
- Finally, debt sustainability is ultimately less about the ability to pay and more about the willingness of the political system to honor its obligations.
5.4 In other words, the new view of fiscal policy shifts the emphasis from stocks to flows, arguing for greater activism in flows (deficits) and minimizing concerns about the sustainability of the stocks (debt). Of course, since the US elections, it seems that activist fiscal policy might become a reality, even though, ironically, cyclical conditions have changed, as low unemployment is now leading to rising wages and inflation.
5.5 How well does this view apply to India, given its fiscal experience in the last 15 years and its outlook for the next 10-15 years? This is a question that is imperative at a time when India is reviewing the fiscal policy framework enshrined in the Fiscal Responsibility and Budget Management (FRBM) Act of 2003.
II. IndIa and the World: FloWs
5.6 The case for activist fiscal policy in the advanced economies (AEs) rests ultimately on two pillars: weak economic activity and the inability to address this problem through monetary policy.
5.7 These considerations have some resonance in India. Like some European countries, India is still afflicted by the twin balance sheet problem, which is holding back investment and credit growth and hence overall economic activity. Deleveraging has still not played itself out and hence the debt overhang will continue to constrain economic activity (see Chapter 4). The need for counter-cyclical policy cannot therefore be ruled out.
5.8 That said, India’s situation differs from that of the AEs in some important ways. To begin with, Indian growth rates are substantially higher, while inflation rates are also substantially greater. As a result, monetary policy is nowhere close to the zero lower bound, reducing the need for fiscal activism. And because inflation is already relatively high, counter-cyclical policy has to be much more sensitive to triggering higher inflation. Potential growth is notoriously difficult to estimate, especially in India, but one recent attempt suggests that the room for increasing demand without triggering higher inflation may be limited (Chinoy, Kumar and Mishra 2016).
5.9 Perhaps a more important argument against activist counter-cyclical policy is India’s own recent experience. Figures 1 and 2 illustrate this history. Figure 1 highlights starkly that the two episodes of Indian macro-vulnerability in the last 35 years—1991 and 2013—were associated with, even preceded by, large increases in fiscal deficits. In the early 1980s, there was an expansion in spending and deficits in response to accelerating growth. The inability to rein in these deficits played a key role in undermining India’s external situation, which led to the balance of payments crisis of 1991. The difference between the 1991 and 2013 episodes is that in the former there was a fixed exchange rate which created a full-blown crisis, whereas in the latter the exchange rate was floating, which attenuated disruptions in other asset prices.
Figure 1. Gross Fiscal Deficit of Central Government (% of GDP)

Figure 2. Central Government (CG) Fiscal Deficit and Expenditures (% of GDP)
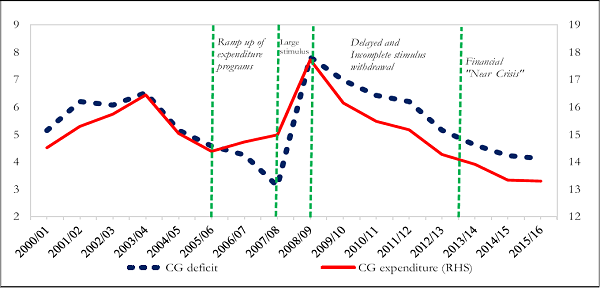
Note: Fiscal deficit definition as per IMF. Source: International Monetary Fund.
5.10 Figure 2 focusses on the period leading up to the 2013 crisis. During the mid-2000s growth boom, new spending programs were introduced, which could not be sustained when receipts fell back to more normal levels. Then, after the Global Financial Crisis there was a renewed surge in budget deficits, which rose to exceptionally high levels. This boom-financed spending (since 2005-06) combined with the sharp stimulus (4 percent of GDP) in the wake of the GFC, which was then not withdrawn adequately or on time, led to the financial-currency “near-crisis” in the autumn of 2013.
Table 1. General Government Debt to GDP Ratio
| Country | 2007 | 2008 | 2009 | 2010 | 2011 | 2012 | 2013 | 2014 | 2015 | 2016 |
| Japan | 183.0 | 191.8 | 210.2 | 215.8 | 231.6 | 238.0 | 244.5 | 249.1 | 248.0 | 250.4 |
| Italy | 99.8 | 102.4 | 112.5 | 115.4 | 116.5 | 123.3 | 129.0 | 132.5 | 132.7 | 133.2 |
| United States | 64.0 | 72.8 | 86.0 | 94.7 | 99.0 | 102.5 | 104.6 | 104.6 | 105.2 | 108.2 |
| France | 64.4 | 68.1 | 79.0 | 81.7 | 85.2 | 89.6 | 92.4 | 95.3 | 96.1 | 97.1 |
| Canada | 66.8 | 67.8 | 79.3 | 81.1 | 81.5 | 84.8 | 86.1 | 86.2 | 91.5 | 92.1 |
| United Kingdom | 42.2 | 50.3 | 64.2 | 75.7 | 81.3 | 84.8 | 86.0 | 87.9 | 89.0 | 89.0 |
| Brazil | 63.7 | 61.9 | 64.9 | 63.0 | 61.2 | 62.3 | 60.4 | 63.3 | 73.7 | 78.3 |
| India | 74.0 | 74.5 | 72.5 | 67.5 | 69.6 | 69.1 | 68.0 | 68.3 | 69.1 | 68.5 |
| Germany | 63.5 | 64.9 | 72.4 | 81.0 | 78.3 | 79.5 | 77.1 | 74.5 | 71.0 | 68.2 |
| Mexico | 37.5 | 42.8 | 43.9 | 42.2 | 43.2 | 43.2 | 46.4 | 49.5 | 54.0 | 56.0 |
| Argentina | 50.8 | 43.9 | 53.8 | 42.6 | 38.1 | 39.4 | 42.2 | 43.6 | 52.1 | 51.8 |
| South Africa | 27.1 | 26.5 | 30.1 | 34.7 | 38.2 | 41.0 | 44.0 | 46.9 | 49.8 | 51.7 |
| China | 29.0 | 27.0 | 32.6 | 33.1 | 33.1 | 34.0 | 36.9 | 39.8 | 42.9 | 46.3 |
| Korea | 28.7 | 28.2 | 31.4 | 30.8 | 31.5 | 32.1 | 33.8 | 35.9 | 37.9 | 38.9 |
| Turkey | 39.9 | 40.0 | 46.1 | 42.3 | 39.1 | 36.2 | 36.1 | 33.5 | 32.9 | 31.7 |
| Indonesia | 32.3 | 30.3 | 26.5 | 24.5 | 23.1 | 23.0 | 24.8 | 24.7 | 27.3 | 27.5 |
| Russia | 8.0 | 7.4 | 9.9 | 10.6 | 10.9 | 11.8 | 13.1 | 15.9 | 16.4 | 17.1 |
| Advanced Economies | 71.7 | 78.5 | 91.9 | 98.4 | 102.6 | 106.8 | 105.6 | 105.4 | 105.4 | 108.6 |
| Euro Area | 64.9 | 68.5 | 78.3 | 84.1 | 86.7 | 91.3 | 93.3 | 94.3 | 92.5 | 91.7 |
| G-7 | 80.9 | 88.9 | 103.7 | 111.9 | 117.1 | 121.3 | 119.4 | 118.6 | 117.9 | 121.7 |
| Emerging Market and Middle- Income Economies | 35.2 | 33.5 | 38.4 | 38.1 | 37.3 | 37.5 | 38.9 | 41.1 | 44.8 | 47.3 |
Source: IMF Fiscal Monitor (October 2016).
5.11 In other words, India’s fiscal stance has an in-built bias toward higher deficits, because spending rises pro-cyclically during growth surges, while revenue and spending are deployed counter-cyclically during slowdowns. This pattern creates fiscal fragility. Fiscal rules, insofar as they can be effective and binding, must therefore aim to prevent spending surges during booms and constrain counter-cycicality during downturns.
III. IndIa and the World: stocks
5.12 India also appears to have a stock problem, in that its debt-to-GDP ratio is higher than many other emerging markets (Table 1). But such a mechanical comparison is not an appropriate way of assessing India’s fiscal strength: the true problem is much more subtle.
A. Fiscal commitment
5.13 India shares with AEs the experience of not having defaulted on its domestic debt either de jure or de facto (through long periods of high inflation). In that sense, India is very different from many other emerging markets, especially those in Latin America (and Russia) which have defaulted on their domestic obligations. If fiscal and debt sustainability is about confidence and trust as revealed in the ability and willingness of governments to limit their debt levels and pay them off without disruption, as Reinhart, Rogoff and Savastano (2003) suggest, then India’s record is very good. In the recent past, India’s highest level of debt has been 83 percent of GDP and it has made sure that its debt service obligations have been conscientiously met.
5.14 Indeed, India’s experience on its external debt obligations is instructive. When doubts about India’s ability to meet its debt service obligations to foreign creditors arose in 1991, the government took extreme measures to reassure creditors that it had no intention to default. Gold from the RBI was flown in a special plane and placed in the vaults of the Bank of England to provide collateral and demonstrate India’s seriousness about its debt obligations (Sitapati, 2016).
b. Debt dynamics
5.15 Turn next to debt dynamics. The basic equation for debt sustainability is:
where:
dt refers to the debt/GDP ratio in period t;
pdt, the primary deficit in period t;
gt, the nominal GDP growth rate; and
rt, the nominal effective rate of interest (borrowing cost) on government debt.
5.16 This equation shows that if a government is running a primary deficit, pd, then nominal growth must exceed the nominal interest rate ([g – r] must be positive) to keep debt from increasing. In contrast, if the primary balance is positive, then debt ratios can remain steady even if [g – r] turns negative.
5.17 On both [g-r] and pd there are interesting comparisons to be made. In AEs, low inflation rates and weak economic activity in the aftermath of the financial crises have reduced nominal growth, which on its own would create debt fragilities. But at the same time secular trends related to high savings, ageing, and a worldwide increase in demand for safe assets have reduced equilibrium interest rates, as well. In other words, both g and r have fallen, keeping debt dynamics sustainable.
5.18 In India, things are rather different. India is on a convergence path. Being relatively less developed, its growth rate for the next decade or two is likely to be substantial. This dynamic has been evident for the last two decades. The country has grown at just over 6 percent in real terms for 35 years and the scope for continuing this convergence remains considerable. India can grow conservatively at about 7-8 percent for the next 15 years (5.5-7 percent in per capita terms). This combined with an inflation target of 4±2 percent implies that nominal GDP growth over the next decade or so will be in the 11-14 percent range.
5.19 The implications for the growth-interest rate differential are stark. For AEs, [g –r] could remain in the 0-2 percent range, comprising 1-2 percent trend real GDP growth plus 1-2 percent inflation, less 2 percent for the nominal interest rate. But for India the differential could be around 4-6.5 percent, reflecting the high nominal growth rates less interest rates of 7-7.5 percent (inflation plus a country risk premium). As a result, debt dynamics for the next decade will be very favorable for India compared with most AEs and even other emerging markets.
5.20 But what about the other dimension of debt dynamics, pd, the primary deficit? Here too there is a contrast with AEs, but in a way that reveals an Indian vulnerability.
5.21 This vulnerability is the country’s primary deficit, that is the shortfall between its receipts and its non-interest expenditures. Put simply, India’s government (centre and states combined) is not collecting enough revenue to cover its running costs, let alone the interest on its debt obligations.
5.22 There is nothing extraordinary about
Table 2. General Government Primary Balance (% of GDP) & Real GDP Growth (%)
2007 |
2008 |
2009 |
2010 |
2011 |
2012 |
2013 |
2014 |
2015 |
2016 |
Average |
Real GDP growth (%) |
|
Argentina |
1.7 |
1.8 |
-1.1 |
-0.4 |
-1.4 |
-1.5 |
-2.4 |
-3.2 |
-5.4 |
-5.6 |
-1.8 |
2.3 |
Brazil |
3.2 |
3.8 |
1.9 |
2.3 |
2.9 |
1.9 |
1.7 |
-0.6 |
-1.9 |
-2.8 |
1.2 |
2.0 |
China |
0.4 |
0.4 |
-1.3 |
1.1 |
0.4 |
-0.2 |
-0.3 |
-0.4 |
-2.1 |
-2.2 |
-0.4 |
8.9 |
India |
0.4 |
-5.3 |
-5.2 |
-4.2 |
-3.9 |
-3.1 |
-3.1 |
-2.8 |
-2.3 |
-2.1 |
-3.2 |
7.4 |
Indonesia |
0.9 |
1.7 |
-0.1 |
0.0 |
0.5 |
-0.4 |
-1.0 |
-0.9 |
-1.2 |
-1.0 |
-0.2 |
5.7 |
Mexico |
1.5 |
1.7 |
-2.3 |
-1.4 |
-1.0 |
-1.2 |
-1.2 |
-1.9 |
-1.2 |
0.1 |
-0.7 |
2.1 |
Russia |
5.6 |
4.7 |
-6.2 |
-3.1 |
1.7 |
0.7 |
-0.8 |
-0.7 |
-3.2 |
-3.4 |
-0.5 |
1.5 |
South Africa |
3.9 |
2.1 |
-2.5 |
-2.1 |
-1.1 |
-1.3 |
-0.9 |
-0.6 |
-0.6 |
-0.4 |
-0.4 |
2.1 |
South Korea |
1.4 |
1.2 |
-0.7 |
0.8 |
0.9 |
0.8 |
-0.2 |
-0.3 |
-0.4 |
-0.3 |
0.3 |
3.3 |
Turkey |
2.9 |
1.7 |
-1.4 |
0.3 |
2.1 |
1.1 |
1.4 |
1.4 |
1.2 |
0.3 |
1.1 |
3.5 |
Source: IMF Fiscal Monitor, October 2016.
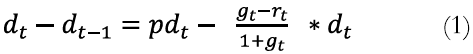
running a primary deficit, per se. Most of the other large emerging markets do so, having fallen into this situation after the Global Financial Crisis when GDP growth and revenues slowed, while stimulus spending was increased (Table 2). Even so, India stands out both for the size of the deficits that it has run over the past decade, especially when compared with its rate of growth. At such rapid rates of growth, substantially greater than those of its peers, its primary deficit should have been much lower than others; instead it has been significantly greater (Figure 3).
5.23 As a result of running a primary deficit, the government is dependent on growth and favourable interest rates to contain the debt ratio. In fact, in the aftermath of the GFC as growth slowed and disinflation occurred, debt levels started to rise again (Figure 4).
Figure 3. Real GDP Growth and Average Primary Deficit (% of GDP), 2007-
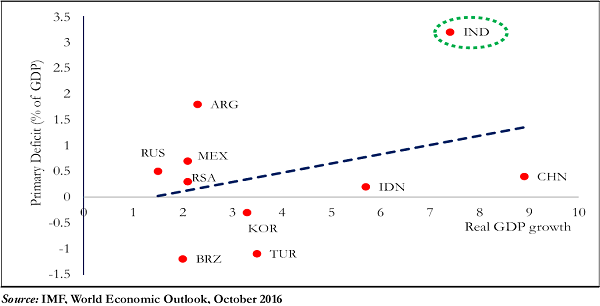 Figure 4. General Government Debt, Primary Balance and Interest Rate-Nominal Growth Differential
5.24 It follows that if one day growth were to falter and interest rates to rise on a sustained basis, the debt ratio could start to spiral upwards. A debt explosion would admittedly require a large, unlikely shock. But it is not just a completely theoretical possibility, either: it is exactly what happened to Greece.
5.25 This contrast between India’s primary balance position and that of other countries reflects a deeper point. India normally undertakes policy-related fiscal adjustment only gradually. Aside from crisis periods, the fiscal position has only improved sustainedly when it has benefitted from windfalls, arising from exceptional growth (as in the mid-2000s) or major declines in oil prices that allow for lower petroleum-related subsidies and higher excise taxes. For example, between 2014-15 and 2016-17, lower oil prices will have contributed about a percentage point to fiscal adjustment. Notice that in Figure 4, the primary balance line is relatively stable, and the improvement around 2007, reflects the growth boom while the strengthening towards the end coincided with low oil prices.
IV. conclusIon
5.26 It has now been thirteen years since the FRBM was enshrined in law and the basic principles of prudent fiscal management elaborated. Over this period, the situation in India has changed utterly. Back in 2003, the economy was fairly small and still relatively closed to the outside world, generating per capita incomes that lagged far behind that of other emerging markets. Today, India has become a middle income country. Its economy is large, open, and growing faster than any other major economy in the world.
5.27 In many ways, then, India’s economy is converging toward the large, open, prosperous economies of the West. But its trajectory is different in one fundamental way. While India’s pace of growth has quickened in the past quarter century, the dynamism of advanced countries has ebbed, particularly since the Global Financial Crisis.
And this has led to a fundamental divergence of fiscal perspectives. Back in 2003 there was common agreement that fiscal rules were better than discretion, that fiscal policy should be aimed at medium-term objectives such as reducing the stock of debt rather than shorter-term cyclical considerations. Now, advanced countries have moved away from these principles toward greater fiscal activism, giving counter-cyclical policies much more of a role and giving correspondingly less weight toward curbing the debt stock.
5.28 But India’s experience has taught the opposite lessons. It has reaffirmed the need for rules to contain fiscal deficits, because of the proclivity to spend during booms and undertake stimulus during downturns. It has also highlighted the danger of relying on rapid growth rather than steady and gradual fiscal and primary balance adjustment to do the “heavy lifting” on debt reduction. In short, it has underscored the fundamental validity of the fiscal policy principles set out in the FRBM.
5.29 Even as these basic tenets of the FRBM remain valid, the operational framework designed in 2003 will need to be modified to reflect the India of today, and even more importantly the India of tomorrow. This, then, will be the task of the FRBM Review Committee: to set out a new vision, an FRBM for the 21st century.
References
1. Chinoy,S., Kumar,P., and Mishra,P., 2016, “What is Responsible for India’s Sharp Disinflation?,” IMF Working Paper WP/16/166
2. Furman, J., 2016, “The new view of fiscal policy and its application,” ORG, Nov. 2, 2016.
3. Gaspar,V., Obstfeld, M., and Sahay, R., 2016, “Macroeconomic Management When Policy Space Is Constrained: A Comprehensive, Consistent, and Coordinated Approach to Economic Policy,” IMF Staff Discussion Note.
4. Reinhart, C. M., Kenneth S. Rogoff, and Miguel A. Savastano, 2003, “Debt Intolerance,” Brookings Papers on Economic Activity.
5. Sitapati, V.,2016, “Half Lion”, Publisher: Penguin Books Limited


