Ministry of Commerce & Industry
INDIA’S FOREIGN TRADE: April 2020
Posted On: 15 MAY 2020 5:57 PM by PIB Delhi
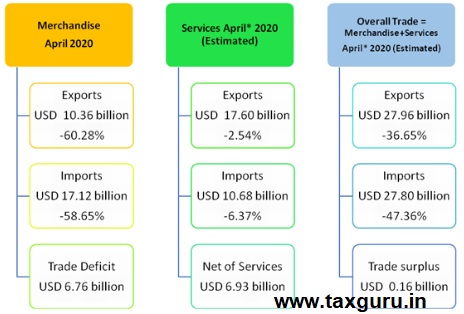
India’s overall exports (Merchandise and Services combined) in April 2020* are estimated to be USD 27.96 billion, exhibiting a negative growth of (-) 36.65 per cent over the same period last year. Overall imports in April 2020* are estimated to be USD 27.80 billion, exhibiting a negative growth of (-) 47.36 per cent over the same period last year.
*Note: The latest data for services sector released by RBI is for March 2020. The data for April 2020 is an estimation, which will be revised based on RBI’s subsequent release.
1. MERCHANDISE TRADE
EXPORTS (including re-exports)
Exports in April 2020 were USD10.36 billion, as compared to USD 26.07 billion in April 2019, exhibiting a negative growth of (-)60.28 per cent. In Rupee terms, exports were Rs. 78,951.41 crore in April 2020, as compared to Rs. 1,81,021.34 crore in April 2019, registering a negative growth of (-) 56.39 per cent. The decline in exports has been mainly due to the ongoing global slowdown, which got aggravated due to the current Covid-19 crisis. The latter resulted in large scale disruptions in supply chainsand demand resulting in cancellation of orders.
Except for Iron Ore and Drugs & Pharmaceuticals which registered a growth of 17.53% and 0.25% respectively, all other commodity/commodity groups have registered negative growth in April 2020 vis-a-vis April 2019.
Major commodity groups which have recorded negative export growth during April 2020 vis-à-vis April 2019 are Gems & jewellery (-98.74%), Leather & leather products (-93.28%), Handicrafts excl. hand made carpet (-91.84%), Carpet (-91.67%), RMG of all textiles (-91.04%), Jute mfg. including floor covering (-90.61%), Man-made yarn/fabs./made-ups etc. (-84.11%), Cotton yarn/fabs./made-ups, handloom products etc. (-82.46%), Ceramic products & glassware (-76.72%), Electronic goods (-71.04%), Tea (-68.89%), Tobacco (-68.47%), Cashew (-67.55%), Petroleum products (-66.22%), Engineering goods (-64.76%), Oil seeds (-62.33%), Mica, Coal & other ores, minerals including processed minerals (-60.41%), Meat, dairy & poultry products (-60.34%), Oil meals (-50.6%), Cereal preparations & miscellaneous processed items (-48.28%), Coffee (-44.22%), Marine products (-43.94%), Organic & inorganic chemicals (-41.93%), Other cereals (-40.86%), Spices (-32.18%), Plastic & Linoleum (-25.35%), Fruits & vegetables (-9.29%) and Rice (-7.04%).
Non-petroleum and Non-Gems and Jewellery exports in April 2020 were USD9.08 billion, as compared to USD 19.54 billion in Apri l2019, exhibiting a negative growth of (-) 53.54per cent.
IMPORTS
Imports in April 2020 were USD17.12 billion (Rs.1,30,525.08 crore), which was 58.65 per cent lower in Dollar terms and 54.59 per cent lower in Rupee terms over imports of USD41.40billion (Rs2,87,432.93 crore) in April 2019.
Major commodity groups of import showing negative growth in April 2020 over the corresponding month of last year are:
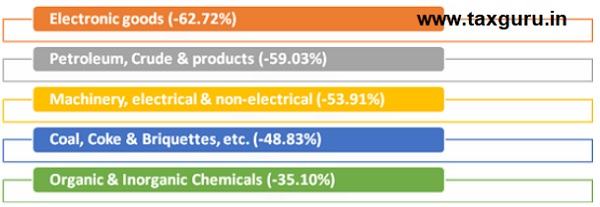
CRUDE OIL AND NON-OIL IMPORTS:
Oil imports in April 2020 were USD4.66 billion (Rs. 35,537.22 crore), which was 59.03 percent lower in Dollar terms (55.01 percent lower in Rupee terms), compared to USD 11.38 billion (Rs. 78,989.46 crore) in April 2019.
In this connection it is mentioned that the global Brent price ($/bbl) has decreased by 67.22% in April 2020 vis-à-vis April 2019 as per data available from World Bank.
Non-oil imports in April 2020 were estimated at USD 12.46 billion (Rs. 94,987.86 crore) which was 58.50 per cent lower in Dollar terms (54.43 percent lower in Rupee terms), compared to USD30.02 billion (Rs. 2,08,443.47 crore) in April 2019.
Non-Oil and Non-Gold imports were USD 12.46 billion in April 2020, recording a negative growth of (-)52.18 per cent, as compared to Non-Oil and Non-Gold imports of USD 26.05 billion in April 2019.
II. TRADE IN SERVICES
EXPORTS (Receipts)
As per the latest press release by RBI dated 15thMay 2020, exports in March2 020 were USD 18.16 billion (Rs. 1,35,043.18 crore) registering a positive growth of 1.22 per cent in dollar terms, vis-à-vis March 2019. The estimated value of services export for April 2020* is USD 17.60 billion.
III. IMPORTS (Payments)
As per the latest press release by RBI dated 15thMay 2020, imports in March 2020 were USD 11.11 billion (Rs. 82,618.50 crore) registering a negative growth of (-) 2.23 per cent in dollar terms, vis-à-vis March 2019. The estimated value of service import for April 2020* is USD 10.68 billion.
III.TRADE BALANCE
MERCHANDISE: The trade deficit for April 2020 was estimated at USD6.76 billion as against the deficit of USD 15.33 billion in April 2019.
SERVICES: As per RBI’s Press Release dated 15thMay 2020, the trade balance in Services (i.e. Net Services export) for March 2020 is estimated at USD7.05 billion.
OVERALL TRADE BALANCE: Taking merchandise and services together, overall trade surplus for April 2020* is estimated at USD0.16 billion as compared to the deficit of USD8.67 billion in April 2019.
*Note: The latest data for services sector released by RBI is for March 2020. The data for April 2020 is an estimation, which will be revised based on RBI’s subsequent release.
MERCHANDISE TRADE
| EXPORTS & IMPORTS : (US $ Billion) | |
| (PROVISIONAL) | |
| APRIL | |
| EXPORTS(including re-exports) | |
| 2019-20 | 26.07 |
| 2020-21 | 10.36 |
| %Growth 2020-21/ 2019-20 | -60.28 |
| IMPORTS | |
| 2019-20 | 41.40 |
| 2020-21 | 17.12 |
| %Growth 2020-21/ 2019-20 | -58.65 |
| TRADE BALANCE | |
| 2019-20 | -15.33 |
| 2020-21 | -6.76 |
| EXPORTS & IMPORTS : (Rs. Crore) | |
| (PROVISIONAL) | |
| APRIL | |
| EXPORTS(including re-exports) | |
| 2019-20 | 1,81,021.34 |
| 2020-21 | 78,951.41 |
| %Growth 2020-21/ 2019-20 | -56.39 |
| IMPORTS | |
| 2019-20 | 2,87,432.93 |
| 2020-21 | 1,30,525.08 |
| %Growth 2020-21/ 2019-20 | -54.59 |
| TRADE BALANCE | |
| 2019-20 | -1,06,411.59 |
| 2020-21 | -51,573.67 |
SERVICES TRADE
| EXPORTS & IMPORTS (SERVICES) : (US $ Billion) | ||
| (PROVISIONAL) | March 2020 | April-March 2019-20 |
| EXPORTS (Receipts) | 18.16 | 214.61 |
| IMPORTS (Payments) | 11.11 | 131.56 |
| TRADE BALANCE | 7.05 | 83.05 |
| EXPORTS & IMPORTS (SERVICES): (Rs. Crore) | ||
| (PROVISIONAL) | March 2020 | April-March 2019-20 |
| EXPORTS (Receipts) | 1,35,043.18 | 15,21,939.15 |
| IMPORTS (Payments) | 82,618.50 | 9,32,981.07 |
| TRADE BALANCE | 52,424.68 | 5,88,958.08 |
| Source: RBI Press Release dated 15thMay 2020 | ||
*Note: The latest data for services sector released by RBI is for March 2020. The data for April 2020 is an estimation, which will be revised based on RBI’s subsequent release.
Quick Estimates for Selected Major Commodities for April 2020


