Government of India
Ministry of Corporate Affairs
5th Floor, ‘A’ Wing, Shastri Bhawan
New Delhi-110001.
HIGHLIGHTS
I. REGISTERED COMPANIES AS ON 31st December, 2020
The total number of companies registered in the country as on 31st December, 2020 stood at 2108614. Of them 753091 companies were closed. 2247 companies were assigned dormant status as per the Companies Act, 2013; 6841 were under liquidation; 39913 companies were in the process of being struck-off. Active in progress status is now invalid and companies under this category, lies under Active Status. Taking the above into account, there were 1306522 active companies as on 31st December, 2020.
1. Out of the 753091 closed companies, 11034 companies were liquidated/dissolved; 695872 companies were declared defunct (and hence struck-off after issuance of notice u/s 248). 26702 companies were amalgamated/ merged with other companies; 14608 companies were converted to Limited Liability Partnership (LLP) and 4875 were converted to LLP and dissolved. Table-1.1 presents the summary picture of companies count as on 31st December, 2020.
2. Out of the 1306522 active companies, 1298159 were limited by shares; 8057 were limited by guarantee and 306 were unlimited companies. Out of the companies limited by shares, 65485 were public, 1198439 were private including 34235 one person companies. Among the public limited companies, 6759 were listed (Table 1.2).
3. State/UT-wise distribution of registered companies indicates that Maharashtra has the highest number of companies (413950), followed by Delhi (358727) and West Bengal (212023). Amongst ‘Active Companies’, Maharashtra has the maximum number of active companies (254788), followed by Delhi (213259) and West Bengal (130517) as on 31st December, 2020. (Table-1.3).
4. Economic-activity wise classification of active companies reveals that highest number of coJmpanies were in Business Services (415923) followed by Manufacturing (263043), Trading (167672) and Construction (107268). Business Services comprise of Information Technology, Research & Development and other business activities such as law, audit & accounts and consultancy, etc. (Table-1.4 and Chart 1.1).

‘M&Q’ is Mining & Quarrying, ‘TS&C’ is Transport, Storage and Communication, and ‘CP&S is Community, Personal & Social Services, ‘RE&R’ is Real Estate and Renting, ’EG&W’, is Electricity Gas & Water. 13,889 active companies (Others) are having invalid Economic Activity (NIC-2004) Code.
II. ONE PERSON COMPANY
5. Up to 31st December, 2020, a total number of 34235 One Person Companies (OPCs) were registered with collective authorized capital of Rs. 1080.48 crore. Economic activity wise classification of OPCs up to 31st December reveals that the highest number of OPCs were in Business Services (17842) followed by Community, Personal & Social Services (4302), Manufacturing (4085) and Trading (3824) (Chart 2.1). During the month of December, 2020, a total of 776 OPC were registered with authorized capital of Rs.28.44 crore. Economic activity wise classification of OPC during the month reveals that highest number of 331 OPCs were registered in Business Services, followed by 122 in Manufacturing, 122 in Trading and 98 in Community, personal & Social Services. (Table 2.1).

‘TS&C’ is Transport, Storage and Communication, ‘CP&S’ is ‘Community, personal & Social Services’, ’RE&R’ is Real Estate and Renting.
III. TREND OF REGISTRATION OF NEW COMPANIES
6. An analysis of registration of new companies during December 2018 to December 2020 indicates that monthly registration of companies has increased after hitting lowest of 3209 Companies in April 2020 (Chart 3.1). A total of 14358 companies were registered in December, 2020 as compared to 12057 in December 2019. An increase (6.72%) in registration of companies has been witnessed in December 2020 over the previous month (Table 3.1). A total of 4322 LLPs were registered in December 2020 as compared to 2916 LLPs in December 2019 (Table 3.1).

IV. REGISTRATION OF NEW COMPANIES DURING DECEMBER, 2020
7. During the month of December 2020, a total of 14358 companies were registered with collective authorized capital of Rs. 3503.46 crore. Of them 14281 companies were registered as Companies Limited by Shares with authorized capital of Rs. 3503.33 crore; (Table-4.1).
8. Economic-activity wise classification of companies registered during December 2020 (Table-4.2 and Chart 4.1) reveals that the predominant share of companies is in Business Services (4114) followed by Manufacturing (2938), Community, personal & Social Services (1711), Trading (1662) and Agriculture and Allied Activities (1295).
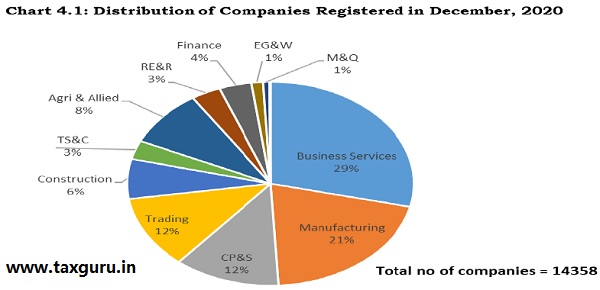
‘EG&W’ is Electricity, Gas and Water, ‘TS&C’ is Transport, Storage and Communication, ‘CP&S’ is Community, personal & Social Services, ’RE&R’ is Real Estate and Renting.
9. During December, 2020, 2885 (20.09%) companies were registered in
Maharashtra, followed by 1298 (9.04%) in Delhi and 1280 (8.91%) in Uttar Pradesh. (Table-4.3).
V. Limited Liability Partnerships (LLPs)
10. As on 31st December 2020, a total number of 190211 LLPs were active in the country. About 83.58% active LLPs (158983 in number) have obligation of contribution less than or equal to Rs. 5 lakhs each; and only about 3.11% (5908 in number) of LLPs have obligation of contribution above Rs.1 crore each (Table-5.1 and Chart 5.1)

11. Broad economic sector wise classification of active LLPs as on 31st December 2020 reveals that Service sector account for 143239 LLPs, followed by Industry and Agriculture sectors accounting for 43183 and 3788 respectively. Economic-activity wise classification of active LLPs as on 31st December 2020 further reveals that a large number of LLPs are in Business Services (70038) followed by Trading (30216), Manufacturing (22485) and Real Estate & Renting (17415) (Table-5.2 & Chart 5.2).

‘EG&W’ is Electricity, Gas and Water, ‘M&Q’ is Mining & Quarrying, ‘TS&C’ is Transport, Storage and Communication, ‘CP&S’ is ‘Community, Personal & Social Services’, ’RE&R’ is Real Estate and Renting.
12. During October to December 2020, a total of 13011 Limited Liability Partnerships (LLPs) were registered with collective obligation of contribution of Rs. 968.06 crore. Economic activity wise classification of LLPs during October to December 2020 indicates that highest number of 3530 LLPs were registered in Business Services followed by 2761 in Trading, 2254 in Manufacturing and 1230 in Community, Personal and Social Services. (Table 5.3 and Chart 5.3).

VI. FOREIGN COMPANIES
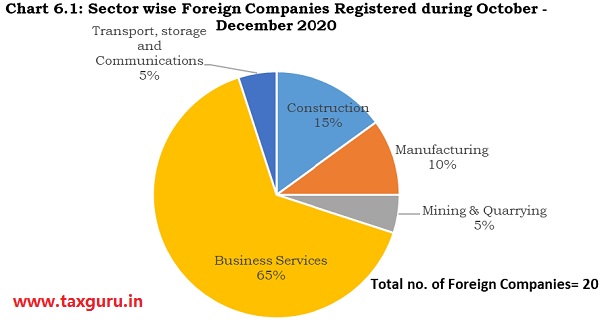
13. As on 31st December 2020, a total of 4960 foreign companies were registered in India, of which 3346 were active. During October to December, 2020, a total of 20 foreign companies were registered in India, including 6 in Delhi, followed by 5 in Maharashtra, 3 each in Karnataka and Tamil Nadu and 1 each in Himachal Pradesh, Haryana, Telangana. Economic activity wise classification of foreign companies reveals that highest number of 13 were registered in Business Services followed by 3 in Construction, 2 in Manufacturing, and 1 in Mining and Quarrying. (Table 6.1 and chart 6.1).
| Table 1.1 Summary Statement on Companies in India as on 31st December, 2020 | ||
| Companies Registered as on 31st December, 2020 | 2108614 | |
| 1 | Number of Closed Companies | 753091 |
| i | No. of Companies Liquidated/Dissolved | 11034 |
| ii | No. of Companies Defunct/ Struck-off (Section 248 of CA, 2013) | 695872 |
| iii | No. of Companies Amalgamated/merged | 26702 |
| iv | No. of Companies Converted to LLP | 14608 |
| v | No. of Companies Converted to LLP and dissolved | 4875 |
| 2 | Number of Companies lying dormant u/s 455 of Companies Act, 2013 | 2247 |
| 3 | Number of Companies under Liquidation | 6841 |
| 4 | Number of Companies which are under the process of Section 248 of the Companies Act, 2013 | 39913 |
| 5 | Number of Active companies | 1306522 |
| Of which | ||
| Companies Limited by Shares | 1298159 | |
| Companies Limited by Guarantees | 8057 | |
| Unlimited Companies | 306 | |
–
| Table 1.2 : Active Companies Limited by Shares as on 31st December, 2020 | ||||
| Sl. No. |
Companies Limited by Shares | Government | Non-
Government |
Total |
| 1 | Public Limited | 1493 | 63992 | 65485 |
| Of which- | ||||
| i | Listed | 76 | 6683 | 6759 |
| ii | Unlisted | 1417 | 57309 | 58726 |
| 2 | Private Limited | 609 | 1197830 | 1198439 |
| Of which | ||||
| One Person Company | 0 | 34235 | 34235 | |
| Total | 2102 | 1296057 | 1298159 | |
–
| Table 1.3: State/UT-wise Status of Companies Registered as on 31st December, 2020 | |||||||
| Sl. No. | State | Registe-red | Closed | Dormant u/s 455 of CA, 2- 13 | Under
Liquida-tion |
Under Struck-off | Active |
| 1 | Andaman & Nicobar |
511 | 123 | 3 | – | 2 | 383 |
| 2 | Andhra Pradesh | 35742 | 10844 | 29 | 52 | 1958 | 22859 |
| 3 | Arunachal Pradesh | 672 | 304 | 0 | 2 | 6 | 360 |
| 4 | Assam | 12917 | 3802 | 1 | 14 | 48 | 9052 |
| 5 | Bihar | 40444 | 8903 | 27 | 41 | 3534 | 27939 |
| 6 | Chandigarh | 15421 | 7733 | 12 | 64 | 189 | 7423 |
| 7 | Chhattisgarh | 11860 | 3092 | 19 | 6 | 87 | 8656 |
| 8 | Dadra & Nagar Haveli |
586 | 141 | – | – | 10 | 435 |
| 9 | Daman and Diu | 398 | 107 | – | 4 | 36 | 251 |
| 10 | Delhi | 358727 | 139056 | 325 | 899 | 5188 | 213259 |
| 11 | Goa | 9279 | 3928 | 15 | 13 | 655 | 4668 |
| 12 | Gujarat | 111976 | 37665 | 55 | 570 | 3493 | 70193 |
| 13 | Haryana | 57232 | 14211 | 79 | 76 | 882 | 41984 |
| 14 | Himachal Pradesh | 7058 | 2733 | 7 | 20 | 294 | 4004 |
| 15 | Jammu & Kashmir | 6546 | 2540 | 2 | 18 | 154 | 3832 |
| 16 | Jharkhand | 16801 | 3543 | 8 | 12 | 964 | 12274 |
| 17 | Karnataka | 135553 | 46022 | 141 | 599 | 1316 | 87475 |
| 18 | Kerala | 61027 | 20894 | 183 | 294 | 1099 | 38557 |
| 19 | Lakshadweep | 24 | 7 | – | – | – | 17 |
| 20 | Leh and Ladakh | 60 | 18 | – | – | – | 42 |
| 21 | Madhya Pradesh | 44675 | 16503 | 27 | 95 | 341 | 27709 |
| 22 | Maharashtra | 413950 | 150935 | 346 | 1,976 | 5905 | 254788 |
| 23 | Manipur | 1204 | 218 | 1 | – | 6 | 979 |
| 24 | Meghalaya | 1090 | 442 | 1 | 1 | 10 | 636 |
| 25 | Mizoram | 191 | 67 | – | – | 1 | 123 |
| 26 | Nagaland | 646 | 324 | 1 | 1 | 2 | 318 |
| 27 | Orissa | 29572 | 10296 | 164 | 40 | 164 | 18908 |
| 28 | Pondicherry | 3418 | 1937 | 2 | 7 | 9 | 1463 |
| 29 | Punjab | 34114 | 15212 | 19 | 133 | 354 | 18396 |
| 30 | Rajasthan | 65906 | 23868 | 30 | 94 | 259 | 41655 |
| 31 | Sikkim | 2 | – | – | – | – | 2 |
| 32 | Tamil Nadu | 157978 | 68701 | 172 | 433 | 2862 | 85810 |
| 33 | Telangana | 120764 | 45177 | 61 | 265 | 2577 | 72684 |
| 34 | Tripura | 754 | 152 | 1 | – | 4 | 597 |
| 35 | Uttar Pradesh | 129408 | 35582 | 83 | 217 | 2520 | 91006 |
| 36 | Uttarakhand | 10085 | 2182 | 7 | 16 | 612 | 7268 |
| 37 | West Bengal | 212023 | 75829 | 426 | 879 | 4372 | 130517 |
| Total | 2108614 | 753091 | 2247 | 6841 | 39913 | 1306522 | |
–
Table 1.4: Economic Activity-wise Active Companies as on 31st December, 2020 (Authorized Capital in Rs. Crore) |
|||||||
Sl.No. |
Economic Activity |
Private |
Public |
Total |
|||
Number |
Authorized Capital |
Number |
Authorized Capital |
Number |
Authorized Capital |
||
I |
Agriculture and Allied Activities |
42478 |
26,907.01 |
2289 |
36,843.10 |
44767 |
63,750.11 |
II |
Industry |
373029 |
12,08,383.62 |
24274 |
29,49,368.78 |
397303 |
41,57,752.40 |
1 |
Manufacturing |
245344 |
7,19,876.95 |
17699 |
11,24,794.76 |
263043 |
18,44,671.72 |
i |
Metals & Chemicals, and products thereof |
82914 |
2,93,447.07 |
7652 |
4,81,670.33 |
90566 |
7,75,117.40 |
ii |
Machinery & Equipments |
57087 |
2,75,495.56 |
3348 |
5,09,276.79 |
60435 |
7,84,772.35 |
iii |
Textiles |
31775 |
42,284.12 |
2603 |
55,684.35 |
34378 |
97,968.47 |
iv |
Food stuffs |
38186 |
64,896.54 |
2417 |
44,104.94 |
40603 |
1,09,001.48 |
v |
Paper & Paper products, Publishing, printing and reproduction of recorded media |
15910 |
16,149.11 |
829 |
16,573.60 |
16739 |
32,722.71 |
vi |
Others |
13746 |
20,127.41 |
487 |
14,049.61 |
14233 |
34,177.02 |
vii |
Leather & products thereof |
3053 |
3,835.50 |
188 |
2,019.81 |
3241 |
5,855.31 |
viii |
Wood Products |
2673 |
3,641.65 |
175 |
1,415.33 |
2848 |
5,056.97 |
2 |
Construction |
103072 |
2,05,073.58 |
4196 |
4,20,855.61 |
107268 |
6,25,929.19 |
3 |
Electricity, Gas & Water companies |
13197 |
2,38,718.26 |
1669 |
13,08,929.44 |
14866 |
15,47,647.70 |
4 |
Mining & Quarrying |
11416 |
44,714.83 |
710 |
94,788.96 |
12126 |
1,39,503.79 |
III |
Services |
811668 |
14,29,675.82 |
38935 |
22,47,108.88 |
850603 |
36,76,784.70 |
1 |
Business Services |
406084 |
5,24,029.44 |
9839 |
10,53,971.18 |
415923 |
15,78,000.61 |
2 |
Trading |
161940 |
2,96,396.73 |
5732 |
1,31,054.49 |
167672 |
4,27,451.22 |
3 |
Real Estate and Renting |
67793 |
1,08,877.41 |
2659 |
55,432.88 |
70452 |
1,64,310.29 |
4 |
Community, personal & Social Services |
97059 |
1,06,479.11 |
4020 |
1,63,176.72 |
101079 |
2,69,655.83 |
5 |
Finance |
38528 |
2,18,427.26 |
15074 |
4,86,317.95 |
53602 |
7,04,745.21 |
6 |
Transport, storage and Communic-ations |
39259 |
1,73,849.07 |
1472 |
2,92,969.45 |
40731 |
4,66,818.52 |
7 |
Insurance |
1005 |
1,616.81 |
139 |
64,186.21 |
1144 |
65,803.02 |
IV |
Others |
11555 |
48,327.44 |
2294 |
1,50,093.42 |
13849 |
1,98,420.86 |
Total |
1238730 |
27,13,293.88 |
67792 |
53,83,414.19 |
1306522 |
80,96,708.07 |
|
–
| Table 2.1: Economic Activity-wise One Person Company (Authorized Capital in Rs. Lakh) | |||||
| Sl. No. | Economic Activity | Up to 31.12.2020 | During December, 2020 | ||
| Number | Authorized Capital | Number | Authorized Capital | ||
| I | Agriculture and Allied Activities | 652 | 2,544.77 | 17 | 115.00 |
| II | Industry | 5774 | 21,869.94 | 164 | 687.41 |
| 1 | Manufacturing | 4085 | 14,888.33 | 122 | 464.21 |
| 2 | Construction | 1469 | 6,073.06 | 34 | 175.70 |
| 3 | Electricity, Gas & Water companies | 155 | 650.25 | 2 | 10.50 |
| 4 | Mining & Quarrying | 65 | 258.30 | 6 | 37.00 |
| III | Services | 27806 | 83,598.03 | 595 | 2,042.04 |
| 1 | Business Services | 17842 | 49,839.30 | 331 | 1,081.87 |
| 2 | Community, personal & Social Services | 4302 | 12,985.23 | 98 | 324.95 |
| 3 | Trading | 3824 | 13,438.96 | 122 | 432.82 |
| 4 | Real Estate and Renting | 676 | 3,533.59 | 15 | 91.00 |
| 5 | Transport, storage and Communications | 1096 | 3,227.45 | 29 | 111.40 |
| 6 | Finance | 64 | 553.50 | – | – |
| 7 | Insurance | 2 | 20.00 | – | – |
| IV | Others | 3 | 35.00 | – | – |
| Total | 34235 | 1,08,047.74 | 776 | 2,844.45 | |
–
| Table 3.1: Number of Companies Registered during the months | |||
| Month | Public Companies | Private Companies | Total Companies |
| December, 2018 | 211 | 9273 | 9484 |
| January, 2019 | 304 | 12160 | 12464 |
| February, 2019 | 331 | 11445 | 11776 |
| March, 2019 | 270 | 10300 | 10570 |
| April, 2019 | 275 | 10108 | 10383 |
| May, 2019 | 274 | 11007 | 11281 |
| June, 2019 | 282 | 9337 | 9619 |
| July, 2019 | 316 | 10383 | 10699 |
| August, 2019 | 175 | 9829 | 10004 |
| September, 2019 | 272 | 8899 | 9171 |
| October, 2019 | 308 | 9625 | 9933 |
| November, 2019 | 292 | 10315 | 10607 |
| December, 2019 | 290 | 11767 | 12057 |
| January, 2020 | 365 | 12384 | 12749 |
| February, 2020 | 290 | 10139 | 10429 |
| March, 2020 | 110 | 5678 | 5788 |
| April, 2020 | 96 | 3113 | 3209 |
| May, 2020 | 101 | 4734 | 4835 |
| June, 2020 | 215 | 10739 | 10954 |
| July, 2020 | 317 | 16170 | 16487 |
| August, 2020 | 394 | 15995 | 16389 |
| September, 2020 | 343 | 16298 | 16641 |
| October, 2020 | 384 | 16323 | 16707 |
| November, 2020 | 299 | 13154 | 13453 |
| December, 2020 | 325 | 14033 | 14358 |
–
| Table 4.1: Registration of New Companies during December, 2020 (Authorized Capital in Rs. Lakh) | |||||||
| Sl. No. |
Category | Government | Non-Government | Total | |||
| Number | Authorized Capital | Number | Authorized Capital | Number | Authorized Capital | ||
| 1 | Company Limited by Shares | 8 | 2,01,535.00 | 14273 | 1,48,797.73 | 14281 | 3,50,332.73 |
| i | OPC | – | – | 776 | 2,844.45 | 776 | 2,844.45 |
| ii | Private | 2 | 1,015.00 | 13178 | 1,41,451.57 | 13180 | 1,42,466.57 |
| iii | Public | 6 | 2,00,520.00 | 319 | 4,501.70 | 325 | 2,05,021.70 |
| 2 | Company Limited by Guarantee | – | – | 77 | 13.00 | 77 | 13.00 |
| i | Private | – | – | 77 | 13.00 | 77 | 13.00 |
| ii | Public | – | – | – | – | 0 | – |
| 3 | Unlimited Company | – | – | – | – | – | – |
| i | Private | – | – | – | – | – | – |
| ii | Public | – | – | – | – | – | – |
| Total | 8 | 2,01,535.00 | 14350 | 1,48,810.73 | 14358 | 3,50,345.73 | |
–
Table 4.2: Activity-wise New Companies Registered during December, 2020 (Authorized Capital in Rs. Lakh) |
|||||||||||
Sl. No. |
Economic
|
Government |
Non-Government |
Total |
|||||||
Private |
Public |
Private |
Public |
||||||||
No. |
Authorized Capital |
No. |
Authorized Capital |
No. |
Authorized Capital |
No. |
Authorized Capital |
No. |
Authorized Capital |
||
I |
Agriculture
|
2 |
1,015.00 |
1 |
5.00 |
1,287 |
12,749 |
5 |
45 |
1295 |
13,813.82 |
II |
Industry |
0 |
– |
4 |
2,00,500.00 |
4088 |
53,476.53 |
39 |
1,492.50 |
4131 |
2,55,469.03 |
1 |
Manufacturing |
– |
– |
– |
– |
2909 |
42,400.59 |
29 |
925.50 |
2938 |
43,326 |
i |
Metals & Chemicals, and products thereof |
– |
– |
– |
– |
947 |
14,875 |
14 |
567 |
961 |
15,441.78 |
ii |
Machinery & Equipments |
– |
– |
– |
– |
558 |
7,289 |
2 |
9 |
560 |
7,297.54 |
iii |
Food stuffs |
– |
– |
– |
– |
728 |
11,147 |
3 |
30 |
731 |
11,177.27 |
iv |
Others |
– |
– |
– |
– |
150 |
2,687 |
3 |
65 |
153 |
2,752.20 |
v |
Textiles |
– |
– |
– |
– |
299 |
3,439 |
4 |
220 |
303 |
3,659.10 |
vi |
Paper & Paper products, Publishing, printing and reproduction of recorded media |
– |
– |
– |
– |
178 |
1,184 |
3 |
35 |
181 |
1,219.20 |
vii |
Leather & products thereof |
– |
– |
– |
– |
29 |
1,615 |
– |
– |
29 |
1,615.00 |
viii |
Wood Products |
– |
– |
– |
– |
20 |
164 |
– |
– |
20 |
164.00 |
2 |
Construction |
– |
– |
1 |
400.00 |
899 |
7,942 |
5 |
245 |
905 |
8,587.35 |
3 |
Electricity, Gas & Water Companies |
– |
– |
3 |
2,00,100.00 |
180 |
1,566 |
3 |
7 |
186 |
2,01,672.55 |
4 |
Mining & Quarrying |
– |
– |
– |
– |
100 |
1,568 |
2 |
315 |
102 |
1,883.05 |
III |
Services |
0 |
– |
1 |
15.00 |
8656 |
78,083.67 |
275 |
2,964.20 |
8932 |
81,062.87 |
1 |
Business
|
– |
– |
– |
– |
4,108 |
31,188 |
6 |
41 |
4114 |
31,228.66 |
2 |
Trading |
– |
– |
– |
– |
1,660 |
14,837 |
2 |
10 |
1662 |
14,846.97 |
3 |
Community, personal & Social Services |
– |
– |
– |
– |
1,698 |
14,265 |
13 |
127 |
1711 |
14,392.62 |
4 |
Real Estate and Renting |
– |
– |
– |
– |
471 |
5,909 |
1 |
15 |
472 |
5,924.25 |
5 |
Transport, storage and Communi-cations |
– |
– |
– |
– |
427 |
3,242 |
– |
– |
427 |
3,242.13 |
6 |
Finance |
– |
– |
1 |
15.00 |
275 |
8,134 |
253 |
2,771 |
529 |
10,920.25 |
7 |
Insurance |
– |
– |
– |
– |
17 |
508 |
– |
– |
17 |
508.00 |
Total |
2 |
1,015.00 |
6 |
2,00,520.00 |
14031 |
1,44,309.03 |
319 |
4,501.70 |
14358 |
3,50,345.73 |
|
–
Table 4.3: State/UT-wise Registration of Companies during December, 2020 (Authorized Capital in Rs. Lakhs) |
|||||||||||
Sl. No. |
State/UT-
|
Government |
Non-Government |
Total |
|||||||
Private |
Public |
Private |
Public |
No. |
Authorized
|
||||||
No. |
Authorized Capital |
No. |
Authorized Capital |
No. |
Authorized Capital |
No. |
Authorized Capital |
||||
1 |
Andaman & Nicobar |
– |
– |
– |
– |
3 |
102.00 |
– |
– |
3 |
102.00 |
2 |
Andhra Pradesh |
– |
– |
– |
– |
368 |
2,894.40 |
3 |
30.00 |
371 |
2,924.40 |
3 |
Arunachal Pradesh |
– |
– |
– |
– |
9 |
68.00 |
– |
– |
9 |
68.00 |
4 |
Assam |
– |
– |
– |
– |
111 |
894.20 |
4 |
40.00 |
115 |
934.20 |
5 |
Bihar |
– |
– |
– |
– |
429 |
3,109.96 |
14 |
155.00 |
443 |
3,264.96 |
6 |
Chandigarh |
– |
– |
– |
– |
56 |
315.00 |
– |
– |
56 |
315.00 |
7 |
Chattisgarh |
– |
– |
– |
– |
125 |
1,913.60 |
3 |
35.00 |
128 |
1,948.60 |
8 |
Dadra & Nagar Haveli |
– |
– |
– |
– |
3 |
21.00 |
– |
– |
3 |
21.00 |
9 |
Daman and Diu |
– |
– |
– |
– |
4 |
8.00 |
– |
– |
4 |
8.00 |
10 |
Delhi |
– |
– |
1 |
400.00 |
1,283 |
14,333.00 |
14 |
140.90 |
1298 |
14,873.90 |
11 |
Goa |
– |
– |
– |
– |
45 |
1,794.50 |
– |
– |
45 |
1,794.50 |
12 |
Gujarat |
– |
– |
– |
– |
695 |
5,135.70 |
14 |
378.30 |
709 |
5,514.00 |
13 |
Haryana |
– |
– |
1 |
100.00 |
655 |
5,060.56 |
9 |
130.00 |
665 |
5,290.56 |
14 |
Himachal Pradesh |
– |
– |
– |
– |
53 |
227.00 |
3 |
15.00 |
56 |
242.00 |
15 |
Jammu & Kashmir |
1 |
1,000.00 |
– |
– |
65 |
369.60 |
– |
– |
66 |
1,369.60 |
16 |
Jharkhand |
– |
– |
– |
– |
178 |
1,882.50 |
3 |
35.00 |
181 |
1,917.50 |
17 |
Karnataka |
– |
– |
– |
– |
1,167 |
12,846.23 |
7 |
75.00 |
1174 |
12,921.23 |
18 |
Kerala |
– |
– |
– |
– |
653 |
5,979.80 |
33 |
370.00 |
686 |
6,349.80 |
19 |
Lakshadweep |
– |
– |
– |
– |
– |
– |
– |
– |
0 |
– |
20 |
Leh and Ladakh |
– |
– |
– |
– |
3 |
87.00 |
– |
– |
3 |
87.00 |
21 |
Madhya Pradesh |
– |
– |
– |
– |
426 |
5,105.90 |
6 |
75.00 |
432 |
5,180.90 |
22 |
Maharashtra |
– |
– |
– |
– |
2,786 |
27,000.98 |
99 |
1,125.00 |
2885 |
28,125.98 |
23 |
Manipur |
– |
– |
– |
– |
21 |
273.00 |
– |
– |
21 |
273.00 |
24 |
Meghalaya |
– |
– |
– |
– |
2 |
16.00 |
– |
– |
2 |
16.00 |
25 |
Mizoram |
– |
– |
– |
– |
– |
– |
– |
– |
0 |
– |
26 |
Nagaland |
– |
– |
– |
– |
8 |
2,656.00 |
– |
– |
8 |
2,656.00 |
27 |
Orissa |
– |
– |
2 |
2,00,000.00 |
300 |
4,554.10 |
1 |
15.00 |
303 |
2,04,569.10 |
28 |
Pondicherry |
– |
– |
– |
– |
12 |
104.00 |
– |
– |
12 |
104.00 |
29 |
Punjab |
– |
– |
– |
– |
169 |
2,861.81 |
2 |
6.00 |
171 |
2,867.81 |
30 |
Rajasthan |
– |
– |
1 |
5.00 |
443 |
1,506.96 |
20 |
195.00 |
464 |
1,706.96 |
31 |
Sikkim |
– |
– |
– |
– |
– |
– |
– |
– |
0 |
– |
32 |
Tamil Nadu |
– |
– |
– |
– |
919 |
13,747.60 |
18 |
774.50 |
937 |
14,522.10 |
33 |
Telangana |
1 |
15.00 |
– |
– |
997 |
7,879.37 |
2 |
215.00 |
1000 |
8,109.37 |
34 |
Tripura |
– |
– |
– |
– |
9 |
72.00 |
– |
– |
9 |
72.00 |
35 |
UttarPradesh |
– |
– |
1 |
15.00 |
1,241 |
10,202.52 |
38 |
401.00 |
1280 |
10,618.52 |
36 |
Uttarakhand |
– |
– |
– |
– |
101 |
626.90 |
7 |
95.00 |
108 |
721.90 |
37 |
West Bengal |
– |
– |
– |
– |
692 |
10,659.83 |
19 |
196.00 |
711 |
10,855.83 |
Total |
2 |
1,015.00 |
6 |
2,00,520.00 |
14031 |
1,44,309.03 |
319 |
4,501.70 |
14358 |
3,50,345.73 |
|
–
| Table 5.1: Obligation of Contribution wise Active LLPs as on 31st December, 2020 | |||
| Sl. No. |
Obligation of Contribution Range | Number | Obligation of Contribution (in Rs Lakh) |
| 1 | Up to 1 lakh | 49605 | 16,029.92 |
| 2 | Above 1 lakh to 5 lakh | 109378 | 1,57,658.11 |
| 3 | Above 5 lakh to 10 lakh | 10628 | 98,040.72 |
| 4 | Above 10 lakh to 25 lakh | 6408 | 1,17,367.79 |
| 5 | Above 25 lakh to 50 lakh | 4559 | 1,84,678.23 |
| 6 | Above 50 lakh to 1 crore | 3725 | 3,13,647.04 |
| 7 | Above 1 crore to 2 crore | 1988 | 3,08,258.11 |
| 8 | Above 2 crore to 5 crore | 2016 | 7,01,844.36 |
| 9 | Above 5 crore to 10 crore | 852 | 6,52,626.88 |
| 10 | Above 10 crore to 25 crore | 611 | 9,87,991.32 |
| 11 | Above 25 crore to 100 crore | 345 | 16,77,012.62 |
| 12 | Above 100 crore | 96 | 56,45,114.40 |
| Total | 190211 | 1,08,60,269.49 | |
–
| Table 5.2: Economic Activity-wise Active LLPs as on 31st December, 2020 | |||
| Sl. No. | Economic Activity | Number | Obligation of Contribution (in Rs Lakh) |
| I | Agriculture and Allied Activities | 3788 | 1,21,047.11 |
| II | Industry | 43183 | 24,71,921.41 |
| 1 | Manufacturing | 24640 | 1314677 |
| i | Metals & Chemicals, and products thereof | 6640 | 4,38,906.85 |
| ii | Machinery & Equipments | 4282 | 3,04,007.97 |
| iii | Food stuffs | 5195 | 1,39,105.59 |
| iv | Textiles | 3712 | 1,01,937.10 |
| v | Others | 2168 | 2,58,556.13 |
| vi | Paper & Paper products, Publishing, printing and reproduction of recorded media | 2010 | 54,873.10 |
| vii | Leather and products thereof | 340 | 7,394.47 |
| viii | Wood Products | 293 | 9,895.53 |
| 2 | Construction | 15953 | 8,34,184.84 |
| 3 | Mining & Quarrying | 1232 | 38,993.24 |
| 4 | Electricity, Gas & Water Companies | 1358 | 2,84,066.57 |
| III | Services | 143239 | 82,67,290.97 |
| 1 | Business Services | 70038 | 35,49,076.18 |
| 2 | Trading | 30216 | 9,12,462.08 |
| 3 | Real Estate and Renting | 17415 | 11,41,866.37 |
| 4 | Community, personal & Social Services | 18332 | 9,80,017.24 |
| 5 | Transport, storage and Communications | 4502 | 80,244.31 |
| 6 | Finance | 2385 | 15,37,207.19 |
| 7 | Insurance | 351 | 66,417.59 |
| IV | Others | 1 | 10.00 |
| Total | 190211 | 1,08,60,269.49 | |
–
| Table 5.3: Economic Activity-wise Active LLPs During October – December 2020 | |||
| Sl. No. |
Economic Activity | Number | Obligation of Contribution (in Rs Lakhs) |
| I | Agriculture and Allied Activities | 361 | 2,834.32 |
| II | Industry | 3730 | 40,405.55 |
| 1 | Manufacturing | 2254 | 21,305.43 |
| 2 | Construction | 1054 | 16,645.45 |
| 3 | Mining & Quarrying | 113 | 963.62 |
| 4 | Electricity, Gas & Water Companies | 309 | 1,491.05 |
| III | Services | 8920 | 53,565.98 |
| 1 | Business Services | 3530 | 15,451.71 |
| 2 | Trading | 2761 | 15,142.80 |
| 3 | Real Estate and Renting | 894 | 12,347.91 |
| 4 | Community, personal & Social Services | 1230 | 4,534.17 |
| 5 | Transport, storage and Communications | 319 | 2,236.26 |
| 6 | Finance | 169 | 3,640.78 |
| 7 | Insurance | 17 | 212.35 |
| IV | Others | 0 | – |
| Total | 13011 | 96,805.86 | |
–
| Table 6.1: Economic Activity- wise Distribution of foreign companies registered during October – December 2020 | ||
| SI. No. | Economic Activity | Number |
| I | Industry | 6 |
| 1 | Manufacturing | 2 |
| 2 | Mining & Quarrying | 1 |
| 3 | Construction | 3 |
| II | Services | 14 |
| 1 | Business Services | 13 |
| 2 | Community, personal & Social Services | – |
| 3 | Trading | – |
| 4 | Finance | – |
| 5 | Real Estate & Renting | – |
| 6 | Transport, storage and Communications | 1 |
| Total | 20 | |


