Where the world has not been broken up into fragments by narrow domestic walls.
– Rabindranath Tagore
The popular impression is one of an India having achieved political integration but an incommensurate economic integration. Based on a novel source of Big Data—invoice-level transactions from the Goods and Services Tax Network (GSTN)—the chapter documents high levels of internal trade in goods. India’s internal trade-GDP ratio at about 54 percent is comparable to that in other large countries. The chapter also documents patterns of trade flows across states which are consistent with priors but also throw up surprises, for example, that Uttar Pradesh is a net exporter of, and hence competitive in, manufacturing. The extent to which the Constitutional provisions facilitate the creation of one economic India is discussed in a final section.
INTRODUCTION
11.1 When, several decades ago, an earnest Raj Kapoor famously sang “Phir bhi dil hai Hindustani,” (“Still, my heart is Indian”), he was expressing what in hindsight appears to be a deep insight on comparative national development. To the Bismarckian sequence “We have created Europe. Now we must create Europeans,” the Raj Kapoor counter seems to be that India’s founding fathers certainly created (and rightly favored creating) Indians in spirit and political consciousness.1 The open question is whether they created one economic India, one market place for the free, unimpeded movement of goods and people. A cautious reading of the Constitution and the Constitutional Assembly debates intimates uncertainty; a less cautious reading indicates that the needs of creating one economic India were actually subordinated to the imperatives of preserving sovereignty for the states (Section 2 below).2
11.2 This chapter attempts to assess the extent to which India, which for nearly seventy years has affirmed and re-affirmed the political “idea of India,” is de facto and de jure one economic India. At a time when international integration is under siege and when India is on the cusp of implementing transformational reforms to create “One India, One Market, One Tax,” via the Goods and Services Tax (GST), it seems appropriate to ask how much internal integration India has achieved. To be clear, unless otherwise specified, hereafter, trade will refer to trade between states within India.
11.3 This is done on the basis of a new “Big Data” set available from the Goods and Service Tax Network (GSTN- invoice level data on interstate movement of goods). Box 1 describes in detail how these data have been prepared but for now the main findings are summarised.
11.4 Contrary to perception and to some current estimates, it seems that India is highly integrated internally, with considerable flows of both people and goods. The headline findings are:
- The first-ever estimates for interstate trade flows indicate that cross-border exchanges between and within firms amount to at least 54 per cent of GDP, implying that interstate trade is 1.7 times larger than international trade. Both figures compare favourably with other jurisdictions: de facto at least, India seems well integrated internally. A more technical analysis confirms this, finding that trade costs reduce trade by roughly the same extent in India as in other countries.
- A potentially exciting finding for which we have tentative not conclusive evidence is that while political borders impede the flow of people, language (Hindi specifically) does not seem to be a demonstrable barrier to the flow of
- The patterns of flows of goods are broadly consistent with priors but also throw up some surprises:
o For example, on trade as a per cent of GSDP, smaller states like Uttarakhand, Himachal Pradesh and Goa trade more; the net exporters are the manufacturing powerhouses of Tamil Nadu and Gujarat but otherwise agricultural Haryana and Uttar Pradesh are also powerhouses because of Gurugram and NOIDA, respectively which have become part of the great Delhi urban agglomeration.
- Another finding is that the costs of moving are about twice as great for people as they are for goods (Chapter 12).
- There is a potential dampener on our finding that trade in goods is high within India. This may be a consequence of the current system of indirect taxes which perversely favours interstate trade over intra-state trade, especially in the cases of final consumption items, exempted goods, or goods that are input tax credit ineligible. If true, the GST by ironing out these oddities may normalise interstate trade3.
- A final finding is that we are able to quantify not just arms-length interstate trade (that is trade between firms), but also intrafirm trade across states. The latter is, surprisingly large (at least 68 per cent of interfirm trade), and is affected by trade costs to a greater extent than interfirm trade. It is also surprising given the constitution favours preserving state sovereignity over one market.
11.5 This chapter is organized as follows. In Section 1, we document our findings on trade. Section 2 examines the Constitutional provisions on promoting internal integration by comparing it with other models. The open question is whether laws can more proactively facilitate the economic integration of India.
SECTION 1. ONE INDIA: INTERNAL TRADE IN GOODS
Figure 1. Freight trucks queued up close to a border
(© Yann Forget / Wikimedia Commons / CC-BY- SA-3.0)
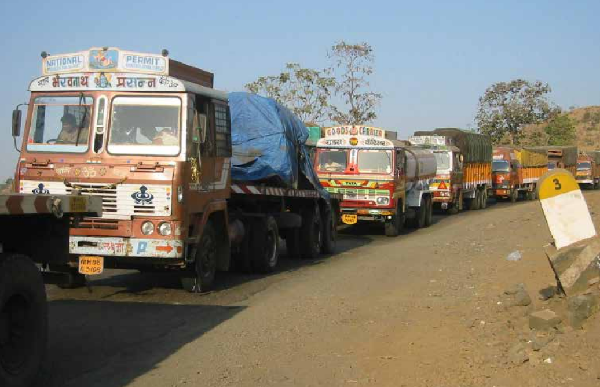
11.6 Images of queues of trucks in India, idling at state borders with their drivers haggling for official clearances or being subject to extortion are legion (Figure 1). The consequent damages to trade and economic activity too have been extensively catalogued. But is there empirical truth to these disparaging descriptions of India?
11.7 While international barriers to trade have been studied extensively, less attention has been devoted to studying the impact of trading networks and other barriers (political and cultural) to trade within countries. The estimation of these barriers to intra-national trade for India has hitherto been challenging due to the absence of a comprehensive interstate trade dataset. This chapter presents the first estimates of internal trade within India using a novel data source – transactions recorded in the process of Central Sales Tax (CST) collection as provided by Tax Information Exchange System (TINXSYS)4. This data covers all modes of transportation, including over road, which had been missing from previous attempts to study interstate trade flows.
I. Does India Trade More Than Other Countries?
11.8 Table 1 compares India’s international and intra-national trade flows with that of other countries. The results here are surprising: India’s aggregate interstate trade (54 per cent of GDP) is not as high as that of the United States (78 per cent of GDP) or China (74 per cent of GDP) but substantially greater than provincial trade within Canada and greater than trade between Europe Union (EU) countries (which is governed by the “four freedoms”: allowing unfettered movement of goods, services, capital, and people). This is all the more striking given that the data here covers mainly manufactured goods, excludes agricultural products, and is therefore an underestimate of total internal trade in goods.5 A substantial portion (almost half) of trade across states in India occurs as stock transfers within firms. That is, intrafirm trade is high relative to arms-length trade.6
11.9 Another way of gauging the magnitude of trade is to compare countries’ internal trade with their international trade. India’s internal trade is about 1.7 times its international trade
Table 1. Comparisons of International and Interstate Trade Flows
| Country | Year | Interstate/GDP | International/GDP | Ratio of Interstate to International |
| Brazile | 1999 | 76% | 14% | 5.4 |
| USAa | 2015 | 78% | 31% | 2.5 |
| India (C+F form) | 2015 | 54% | 32% | 1.7 |
| India (C Form) | 2015 | 32% | 32% | 1 |
| Chinad | 2009 | 74% | 45% | 1.6 |
| Canadab | 2012 | 20% | 62% | 0.3 |
| European Unionc | 2015 | 20% | 84% | 0.2 |
| Indonesiaf | 2005 | 12% | 63% | 0.2 |
a: Freight Analysis Framework Data Tabulation Tool, b: Statistics Canada, c: Eurostat, d: Xing, Whalley and Li(2015), e: Vasconcelos (2001), f: Firdaus and Widiyasanti (2010)
Figure 2. Ratio of Interstate to International Trade by Log of Area
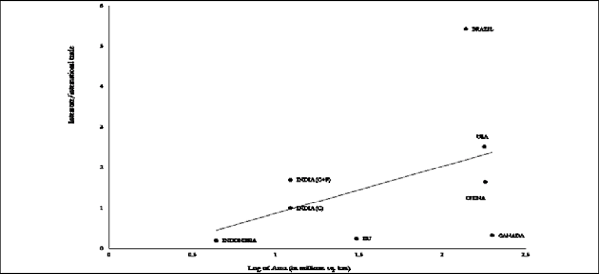
of 32 per cent of GDP. By this criterion, India’s trade profile more similar to that of China, whose internal trade is 1.6 times its international trade but less than the United States whose internal trade is 2.5 times its international.
11.10 The intuition from standard gravity models of trade is that large countries trade more within their own borders than beyond them because of the size of their domestic markets. Figure 2 illustrates this relationship for India and other countries by plotting the ratio of internal to international trade against a country’s size. By this metric, the real
outliers are Canada whose internal-external trade seems unusually low for its size and Brazil for whom this ratio seems unusually high. In contrast, India seems quite standard: the caricature of a country that is closed to international trade now seems dated (Chapter 2, Figure 1B), but so too does the caricature of a country closed to internal trade.


