Considering India’s demographic advantage of a large young population in the productive age group, improvements in the social sectors like education, health care, water supply and sanitation leaves a profound impact on the quality of life of the people as well as to the productivity of the economy. Interventions made to reach out to all sections of the society includes fundamental changes in design of the policies/schemes, expanding the reach through people’s participation, awareness generation, technology use, and direct benefit transfer. Expenditure on social services, as a proportion of GDP, has increased by 1.5 percentage points during the period 2014-15 to 2019-20. Access to education has improved the participation in education system at all levels both in rural and urban areas. Scaling up of the efforts to impart necessary skills through a wide network of ITIs focusing on women has pushed the skill development up. Total formal employment in the economy increased from 8 per cent in 2011-12 to 9.98 per cent in 2017-18. Access to health services, inter-alia, through Ayushman Bharat and Mission Indradhanush across the country has improved. About 76.7 per cent of the households in the rural and about 96 per cent in the urban areas had houses of pucca structure. Jal Shakti Abhiyan launched to accelerate progress on water conservation activities in water stressed districts of India.
INTRODUCTION
10.1 Investment in social infrastructure is a pre-requisite for inclusive growth and employment. In the interim Budget of 201920, the Government had laid down the vision for the decade which among other things emphasized upon building of social infrastructure; a healthy society-Ayushman Bharat, well-nourished women & children and safety of citizens. Some of the milestones to be achieved in this journey are access to electricity, a clean cooking facility, and housing for all by 2022. Imparting the required skills and creating enabling environment for employment generation are important priorities. Moreover, efforts are continuously being made to ensure piped water supply to all rural households by 2024, and solid waste management in every village. Emphasis has been laid on quality of higher education, promotion of women entrepreneurship, nutrition to the women and children and overall human development. The chapter highlights the important developments, takes stock of the outcomes and churn-out issues relevant for the policy in the social sector.
TRENDS IN SOCIAL SECTOR EXPENDITURE
10.2 The increase in expenditure on social services sector affirms the commitment of the government towards social well-being. The expenditure on social services (education, health and others) by Centre and States as a proportion of Gross Domestic Product (GDP) increased by 1.5 percentage points from 6.2 to 7.7 per cent, during the period 2014-15 to 2019-20 (Budget Estimates-BE). An increase was witnessed across all social sectors during this period. For education, it increased from 2.8 per cent in 2014-15 to 3.1 per cent in 2019-20 and for health from 1.2 to 1.6 per cent. The share of expenditure on social services out of total budgetary expenditure increased to 26 per cent in 2019-20 (BE) from 23.4 per cent in 2014-15 (Table 1).
Table 1: Trends in Social Service Sector Expenditure by General Government
(Combined Centre and States)
| Item | 2014-15 | 2015-16 | 2016-17 | 2017-18 | 2018-19 RE | 2019-20 BE |
|
(Rs. in Lakh crore) |
||||||
| Total Budgetary Expenditure | 32.85 | 37.61 | 42.66 | 45.16 | 55.17 | 60.72 |
| Expenditure on Social Services of which: | 7.68 | 9.16 | 10.41 | 11.40 | 14.47 | 15.79 |
| i) Education | 3.54 | 3.92 | 4.35 | 4.83 | 5.81 | 6.43 |
| ii) Health | 1.49 | 1.75 | 2.13 | 2.43 | 2.92 | 3.24 |
| iii) Others | 2.65 | 3.48 | 3.93 | 4.13 | 5.74 | 6.12 |
|
As percentage to GDP |
||||||
| Expenditure on Social Services of which | 6.2 | 6.6 | 6.8 | 6.7 | 7.6 | 7.7 |
| i) Education | 2.8 | 2.8 | 2.8 | 2.8 | 3.1 | 3.1 |
| ii) Health | 1.2 | 1.3 | 1.4 | 1.4 | 1.5 | 1.6 |
| iii) Others | 2.1 | 2.5 | 2.6 | 2.4 | 3.0 | 3.0 |
|
As percentage to total expenditure |
||||||
| Expenditure on Social Services of which | 23.4 | 24.3 | 24.4 | 25.2 | 26.2 | 26.0 |
| i) Education | 10.8 | 10.4 | 10.2 | 10.7 | 10.5 | 10.6 |
| ii) Health | 4.5 | 4.7 | 5.0 | 5.4 | 5.3 | 5.3 |
| iii) Others | 8.1 | 9.3 | 9.2 | 9.1 | 10.4 | 10.1 |
|
As percentage to social services |
||||||
| i) Education | 46.1 | 42.8 | 41.8 | 42.4 | 40.1 | 40.7 |
| ii) Health | 19.4 | 19.1 | 20.5 | 21.4 | 20.2 | 20.5 |
| iii) Others | 34.6 | 38.0 | 37.7 | 36.2 | 39.7 | 38.8 |
Source: Budget Documents of Union and State Governments, Reserve Bank of India.
Note: 1. Social services include, education, sports, art and culture; medical and public health, family welfare; water supply and sanitation; housing; urban development; welfare of SCs, STs and OBCs, labour and labour welfare; social security and welfare, nutrition, relief on account of natural calamities etc.
2. Expenditure on ‘Education’ pertains to expenditure on ‘Education, Sports, Arts and Culture’.
3. Expenditure on ‘Health’ includes expenditure on ‘Medical and Public Health’, ‘Family Welfare’ and ‘Water Supply and Sanitation’.
4. The ratios to GDP at current market prices are based on 2011-12 base. GDP for 2019-20 is First Advance Estimates released by National Statistical Office (NSO) on January 07, 2020.
Table 2: India’s Position in the Global Human Development Index 2018
|
Country |
HDI 2018 | HDI Rank 2017 |
GNI per capita 2018 $ |
Life expectancy at birth (years) 2018 |
Expected years of schooling (years) 2018 a | Mean years of school- ing (years) 2018a |
|
| Value | Rank | ||||||
| Norway | 0.954 | 1 | 1 | 68059 | 82.3 | 18.1 | 12.6 |
| United Kingdom | 0.920 | 15 | 14 | 39507 | 81.2 | 17.4 | 13.0 |
| United States | 0.920 | 15 | 13 | 56140 | 78.9 | 16.3 | 13.4 |
| Russian Federation | 0.824 | 49 | 49 | 25036 | 72.4 | 15.5 | 12.0 |
| Sri Lanka | 0.780 | 71 | 76 | 11611 | 76.8 | 14.0 | 11.1 |
| Brazil | 0.761 | 79 | 79 | 14068 | 75.7 | 15.4 | 7.8 |
| China | 0.758 | 85 | 86 | 16127 | 76.7 | 13.9 | 7.9 |
| Indonesia | 0.707 | 111 | 116 | 11256 | 71.5 | 12.9 | 8.0 |
| South Africa | 0.705 | 113 | 113 | 11756 | 63.9 | 13.7 | 10.2 |
| India | 0.647 | 129 | 130 | 6829 | 69.4 | 12.3 | 6.5 |
| Bangladesh | 0.614 | 135 | 136 | 4057 | 72.3 | 11.2 | 6.1 |
| Myanmar | 0.584 | 145 | 148 | 5764 | 66.9 | 10.3 | 5.0 |
| Pakistan | 0.560 | 152 | 150 | 5190 | 67.1 | 8.5 | 5.2 |
| World | 0.731 | 15745 | 72.6 | 12.7 | 8.4 | ||
Source: Human Development Report (HDR), 2019
Note: a -Data refers to 2018 or the most recent year available, $-Gross National Income (GNI) is based on 2011 dollar purchasing power parity (PPP).
HUMAN DEVELOPMENT
10.3 India’s rank in the Human Development Index (HDI)1 improved to 129 in 2018 from 130 in 2017, out of a total of 189 countries. The value of HDI for India reached to 0.647 in 2018 (Table 2).
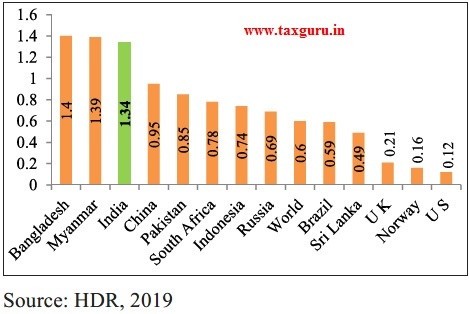
10.4 With 1.34 per cent average annual HDI growth, India is among the fastest improving countries, and ahead of China (0.95), South Africa (0.78), Russian Fedreation (0.69) and Brazil (0.59) (Figure 1). To sustain this momentum in human development and to further accelerate it, the role of public sector in delivery of social services such as education and health is critical.
Figure 1: Average annual HDI growth rate during 2010-2018 (per cent)
EDUCATION FOR ALL
10.5 Sustainable Development Goal (SDG)-4 seeks ‘to ensure inclusive and equitable quality education and promote lifelong learning opportunities for all’ by 2030.
In India, free and compulsory education starts at the age of 6 and ends at the age of 14 years under the ambit of the Right of Children to Free and Compulsory Education (RTE) Act, 2009 which stipulates norms and standards for a recognized school imparting elementary education. The RTE norms provide for an all-weather building in elementary schools. The school building should, inter-alia, consist of at least one classroom for every teacher and an office-cum-store-cum-Head teacher’s room, barrier free access, separate toilets for boys and girls, safe and adequate drinking water facility to all children and playground.
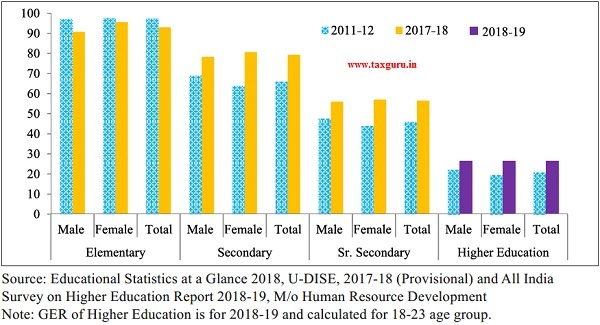
10.6 Unified District Information System for Education (U-DISE) collects data on various indicators on school education. As per U-DISE, 2017-18 (provisional), 98.38 per cent of Government elementary schools have girls’ toilet, 96.23 per cent of Government elementary schools have boys’toilet, 97.13 per cent of Government elementary schools have provision of drinking water facility, 38.62 per cent of Government elementary schools have ramps, 58.88 per cent of Government elementary schools have boundary wall, 56.72 per cent of Government elementary schools have playground facility, 79.23 per cent of Government elementary schools have library and 61.75 per cent schools are having electricity connection. The progress in school and higher education infrastructure and gross enrolment at all levels as may be seen in Table 3 and Figure 2 respectively.
Table 3: Number of Schools, Colleges and Universities at all India level
| Year | Primary & Upper Primary schools (in lakhs) | Sr. Secondary Schools (in lakhs) |
Year | Colleges | Universities |
| 2011-12 | 11.93 | 0.84 | 2011-12 | 34852 | 642 |
| 2017-18 | 14.85 | 1.24 | 2018-19 | 39931 | 993 |
Source: Educational Statistics at a Glance 2018, U-DISE, 2017-18 (Provisional) and All India Survey on Higher Education Report 2018-19, M/o Human Resource Development
Figure 2: Gross Enrolment Ratio (GER) at all India level (in per cent)
10.7 The National Sample Survey (NSS) Report on ‘Key Indicators of Household Social Consumption on Education in India 2017-18’ also reflects the increased participation in education system across various indicators and highlights some challenges in terms of affordability, quality, distribution of educational infrastructure etc. In 2017-18, as reflected in NSS Survey, there were about 13.6 per cent persons of age 3 to 35 years who were never enrolled. The reasons they cite for not enrolling were ‘not interested in education’ and ‘financial constraints.’ Among those who were enrolled, drop-out rate was as high as 10 per cent at primary level, 17.5 per cent at upper primary/middle and 19.8 per cent at secondary level.
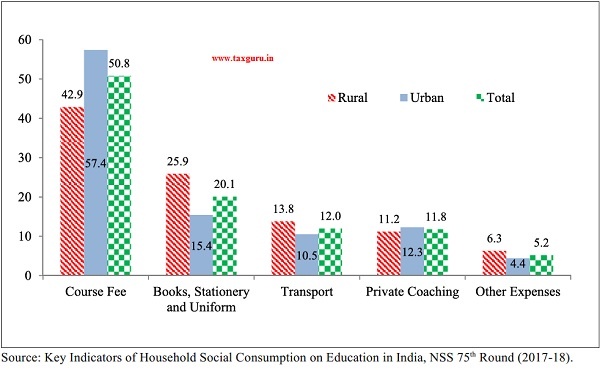
10.8 The poor and underprivileged section of people prefer to engage themselves in economic activities for their survival. In the absence of suitable financial support system and high burden of course fee especially in higher education pushes them out of the education system. The composition of various components of expenditure on education indicates that the course fees which is 50.8 per cent at all India level (including tuition, examination, developmental fees and other compulsory payments) among others contributes about half of the average expenditure of a basic course (Figure 3). The proportion of course fee is also high in rural and urban areas. The second largest component of average expenditure on education by student is books, stationary and uniform where an average student in the rural areas is surprisingly spending more than 10 percentage points as compared to urban areas.
10.9 The NSS Report also throws interesting findings on the challenges faced in affordability in higher education sector.
Figure 3: Distribution of average expenditure relating to basic course per student pursuing general course during the current academic year (2017-18) by item of expenditure (per cent)
Students pursuing education in private aided institutions are spending significantly higher as compared to government institutions across rural-urban India (Table 4). Also, due to absence of competition in government schools/institutions, quality of education in government schools/institutions is low. As a result, more and more students prefer to enrol themselves in private institutions.
10.10 The initiatives taken to provide the quality education in government schools and institutions in affordable and competitive manner may be seen in Box-1.
Table 4: Average expenditure (Rs.) per student pursuing general education by level of current attendance and type of institution (2017-18)
| Institu-tion | Pre-primary | Primary | Secondary | Higher Secondary |
Graduate | PG & above |
All |
|
Government institutions |
|||||||
| Rural | 822 | 1092 | 3678 | 6144 | 9516 | 13117 | 2586 |
| Urban | 2126 | 2413 | 5978 | 10074 | 12448 | 15974 | 5954 |
| Total | 1030 | 1253 | 4078 | 7001 | 10501 | 14656 | 3135 |
|
Private aided institutions |
|||||||
| Rural | 9589 | 9603 | 7361 | 10371 | 12820 | 17483 | 9723 |
| Urban | 16401 | 15800 | 20324 | 26905 | 22949 | 22594 | 19545 |
| Total | 13223 | 12889 | 12487 | 16415 | 16769 | 19388 | 14155 |
Source: Key Indicators of Household Social Consumption on Education in India, NSS 75th Round (2017-18).
Box 1: Programmes and Scheme for School Education
> Earlier, Sarva Shiksha Abhiyan (SSA) effective till 2017-18 was the designated Centrally Sponsored Scheme to meet the objectives of the RTE Act in elementary schools, provided assistance to State Governments and UTs for universalization of elementary education in the country. The Department of School Education and Literacy has launched an Integrated Scheme for School Education – Samagra Shiksha w.e.f. 2018-19, which subsumes three erstwhile Centrally Sponsored Schemes of Sarva Shiksha Abhiyan (SSA), Rashtriya Madhyamik Shiksha Abhiyan (RMSA) and Teacher Education (TE). The new integrated scheme envisages school education as a continuum from pre-school to senior secondary level and aims to ensure inclusive and equitable quality education. Under Samagra Shiksha, States and UTs are supported for strengthening of existing government schools, and for creation and augmentation of infrastructure facilities based on proposals received from respective States/UTs. The scheme also envisages an annual recurring composite school grant varying from ` 25,000/- to ` 1,00,000/- per annum depending upon the enrollment of students, for all government schools. Each school is required to spend at least 10 per cent of the composite school grant on activities related to Swachhata Action Plan. The scheme also provides for annual maintenance and repair of existing school building, toilets and other facilities to upkeep the infrastructure in good condition besides various interventions for improvement of quality of education such as induction and in-service training of teachers and school heads, learning enhancement programmes, use of ICT in education, assessment of learning outcomes, provision of libraries and supplementary graded material to schools etc.
> To further focus on quality education, the Central RTE Rules have been amended to include reference on class-wise and subject-wise Learning Outcomes. The Learning Outcomes for each class in Languages (Hindi, English and Urdu), Mathematics, Environmental Studies, Science and Social Science up to the elementary stage have, accordingly, been finalized and shared with all States/UTs. These would serve as a guidelines for States and UTs to ensure that all children acquire appropriate learning level. The RTE Act, 2009 was amended in 2017 to ensure that all teachers acquire the minimum qualifications prescribed under the Act by 31st March, 2019 to reinforce the Government’s emphasis on improvement of quality of elementary education.
> The Navodaya Vidyalaya Scheme provides for opening of one Jawahar Navodaya Vidyalaya (JNV) in each district of the country to bring out the best of rural talent. Its significance lies in the selection of talented rural children as the target group and aims to provide them quality education comparable to the best in a residential school system.
> A National Mission called NISHTHA – National Initiative for School Heads’ and Teachers’ Holistic Advancement under the Centrally Sponsored Scheme of Samagra Shiksha in 201920 is being launched to improve learning outcomes at the elementary level. The Integrated Teacher Training Programme envisages to build the capacities of around 42 lakh teachers and head of schools, faculty members of SCERTs, DIETs, Block Resource Coordinators, and Cluster Resource Coordinators. The aim of this training is to motivate and equip teachers to encourage and foster critical thinking in students, handle diverse situations and act as first level counsellors.
> Promoting joyful learning through cultural activities including art, music, dance and theatre is playing a very critical role in a student’s life and school activities. The National Curriculum Framework emphasized the importance of such activities and how they helped to enhance learning.
> Pradhan Mantri Innovative Learning Program (DHRUV) was launched to identify and encourage talented students to enrich their skills and knowledge.
> To broadbase technology aided teaching and learning, States and UTs are being actively involved to contribute and use the Digital Infrastructure for Knowledge Sharing (DIKSHA) platform. Steps are also being taken to improve the quality and diversify the nature of e-content on DIKSHA. Other e-content sites like e-pathsala, National Repository of Open Educational Resources (NROER) are also being integrated with DIKSHA to ensure easy access.
10.11 The Government has initiated the process of formulating a New Education Policy to meet the changing dynamics of the requirements of the population with regard to quality education, innovation and research, aiming to make India a knowledge superpower by equipping its students with the necessary skills and knowledge and to eliminate the shortage of manpower in science, technology, academics and industry.
10.12 The initiatives taken for improving the quality of learning and teaching in higher education including technical education are mentioned in Box 2.
Box 2: Programmes and Schemes in Higher Education
> The government launched Pandit Madan Mohan Malaviya National Mission on Teachers and Teaching (PMMMNMTT) which aims at building a strong professional cadre of teachers by setting performance standards and creating top class institutional facilities for innovative teaching and professional development of teachers in higher education. Teachers of existing Central, State Universities/Educational Institutions including private institutions can participate in capacity building programmes as well as induction training.
> Higher Education Financing Agency (HEFA) was established to provide sustainable financial model for higher education institutions, Kendriya Vidyalayas, Navodaya Vidyalayas, AIIMS and other educational institutions of the Ministry of Health with the objective to fund projects to the tune of ` 1 lakh crore by 2022. As on 11th December, 2019, projects worth ` 37,001.21 crore have been approved and the number of educational institutions that have availed funding through HEFA stands at 75.
> National Educational Alliance for Technology (NEAT) announced a PPP Scheme for using technology for better learning outcomes in Higher Education. The objective is to use Artificial Intelligence to make learning more personalised and customised as per the requirements of the learner. This requires development of technologies in Adaptive Learning to address the diversity of learners. EdTech companies would be responsible for developing solutions and manage registration of learners through the NEAT portal.
> The Department of Higher Education, in the Ministry of Human Resource Development has finalized and released a five-year vision plan named Education Quality Upgradation and Inclusion Programme (EQUIP). EQUIP is a vision plan aiming at ushering transformation in India’s higher education system by implementing strategic interventions in the sector over the next five years (2019-2024).
> SWAYAM 2.0 was launched to offer online degree programmes with enhanced features and facilities by top ranking universities. ‘Deeksharambh’ a guide to student induction programme and ‘PARAMARSH’ scheme is to mentor institutions seeking National Assessment and Accreditation Council accreditation are some of the other major schemes of Department of Higher Education launched in 2019.
SKILL DEVELOPMENT
10.13 The future labour market situation of young persons is highly influenced by their initial experiences, including how quickly and how well they are able to access the labour market, and the skills and competencies acquired through education and training (ILO, 2019). General education improves knowledge of the people while skill training enhances their employability and equip them to tackle requirements of labour market.
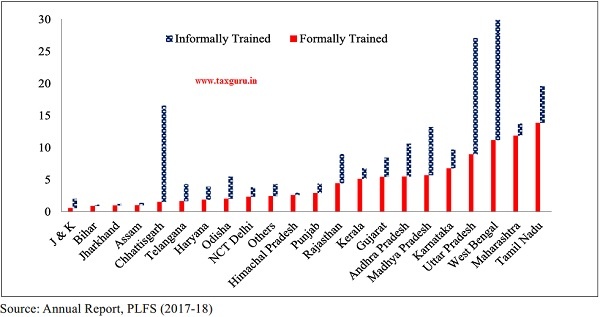
10.14 According to the Periodic Labour Force Survey (PLFS) 2017-18 only 13.53 per cent of the workforce in the productive age-group of 15-59 years has received training (2.26 per cent formal vocational/technical training and 11.27 per cent informal training). A large section among informally trained workers, about 55.9 per cent received it either through self-learning (28.66 per cent) or hereditary (27.24 per cent) and about 38.51 per cent have received it on-the-job. State-wise percentage of trained workers may be seen in Figure 4.
10.15 Under the Skill India Mission, the Government implements the Pradhan Mantri Kaushal Vikas Yojana (PMKVY) 2016-20 which enables large number of prospective youth to take up Short Term Training (STT) and Recognition of Prior Learning (RPL) through empanelled training centers /training providers (TCs/TPs) throughout the country. Under PMKVY (2016-20), 69.03 lakh (appx.) (38.01 lakh STT + 31.02 lakh RPL) candidates have been trained throughout the country as on 11th November, 2019.
10.16 Under PMKVY 2016-20, TCs/TPs are required to have dedicated mentorship-cum-placement cells for industry linkage and placement of candidates. TPs are mandated
Figure 4: State-wise workforce (15-59 years) who received training through formal/ informal sources (per cent)
to organize Placement/Rozgar Melas every six months with support from the Sector Skill Councils (SSCs) and to ensure the participation of local industry. The reimbursement of last 20 per cent of training payout to TCs is linked with the placement (wage employment or self-employment) of the candidate. Additionally, post placement support of ` 1500 per month per trainee is applicable for special group and special areas for 2 or 3 months post training depending on placement within or outside the district of the domicile of the candidate. Under STT, as per data reported on Skill Development Management System (SDMS), 30.21 lakh candidates were certified out of which, 15.4 lakh candidates were reported to be placed in various sectors across the country.
10.17 A wide range of reforms has been introduced to the Apprenticeship Rules, 1992 for expansion and outreach of apprenticeship policy. The comprehensive reforms under Apprenticeship Rules 1992 are given in Box 3.
Box 3: Reforms under Apprenticeship Rules 1992
> Increasing upper limit for engaging apprentices from 10 to 15 per cent of total strength of establishment;
> Decreasing the size limit of an establishment with mandatory obligation to engage apprentices from 40 to 30;
> Payment of stipend for 1st year has been fixed rather than linking it to minimum wages;
> 10 to 15 per cent hike in stipend for 2nd and 3rd year of apprenticeship;
> Duration of apprenticeship training for optional trade can be from 6 months to 3 years.
> The minimum amount of stipend prescribed ranges from Rs. 5,000 per month – for school pass outs between Class 5th- 9th, to ` 9,000 per month to graduate or degree apprentices in any stream.
STATUS OF EMPLOYMENT IN INDIA
10.18 Employment generation coupled with improving employability has been the priority of the Government. Various steps are being taken for generating employment in the country like encouraging private sector of economy, fast-tracking various projects involving substantial investment and increasing public expenditure on schemes such as Prime Minister’s Employment Generation Programme (PMEGP), Mahatma Gandhi National Rural Employment Guarantee Scheme (MGNREGS), Pt. Deen Dayal Upadhyaya Grameen Kaushalya Yojana (DDU-GKY) and Deendayal Antodaya Yojana-National Urban Livelihoods Mission (DAY-NULM). As a result of these policy interventions, the nature of employment has changed significantly.
10.19 As per PLFS estimates2, the share of regular wage/salaried employees has increased by 5 percentage points from 18 per cent in 2011-12 to 23 per cent in 2017-18 as per usual status3 (Figure 5). In absolute terms, there was a significant jump of around 2.62 crore new jobs in this category with 1.21 crore in rural areas and 1.39 crore in urban areas (Table 5)4. Remarkably, the proportion of women workers in regular wage/salaried employees category have increased by 8 percentage points (from 13 per cent in 2011-12 to 21 per cent in 2017-18) with addition of 0.71 crore new jobs for female workers in this category (Table 5 & Figure 5)
10.20 Among the self-employed category (consists of employers, own account workers and unpaid family labour), while the proportion of own account workers and employers increased, the proportion of unpaid family labour (helper) has declined, especially for females5 between 2011-12 and 2017-18. The proportion of total self-employed workers however remained
Figure-5: Distribution of Workers (principal status plus subsidiary status, all ages) by Sector, Sex and Employment Status in India
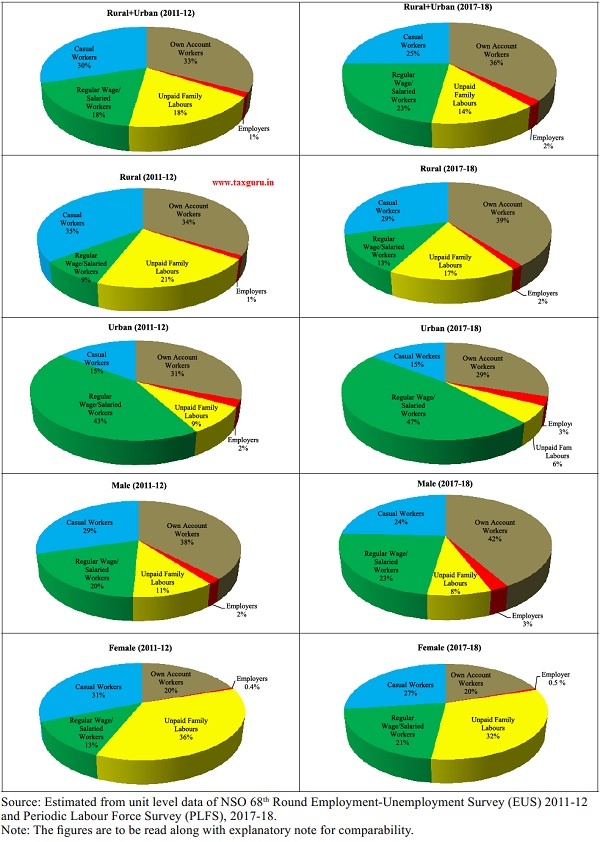
Table 5: Number of Workers (principal status plus subsidiary status, all ages) by Sector, Sex and Employment Status in India (in crore)
| Employment Status | Male | Female | Rural | Urban | Total | |||||
| 2011-12 | 2017- 18 | 2011-12 | 2017-18 | 2011-12 | 2017-18 | 2011-12 | 2017-18 | 2011-12 | 2017-18 | |
| Self Employed | 17.33 | 18.68 | 7.20 | 5.54 | 18.81 | 18.26 | 5.73 | 5.95 | 24.54 | 24.21 |
| Own Account Workers | 12.94 | 14.90 | 2.55 | 2.15 | 11.26 | 12.45 | 4.21 | 4.60 | 15.47 | 17.05 |
| Employers | 0.64 | 0.9 | 0.06 | 0.06 | 0.39 | 0.49 | 0.31 | 0.47 | 0.7 | 0.96 |
| Unpaid Family Labour | 3.75 | 2.88 | 4.6 | 3.33 | 7.16 | 5.32 | 1.21 | 0.88 | 8.37 | 6.20 |
| Regular Wage/ Salaried Employees | 7.10 | 9.00 | 1.74 | 2.45 | 2.93 | 4.14 | 5.91 | 7.30 | 8.83 | 11.45 |
| Casual labourer | 9.95 | 8.61 | 3.97 | 2.86 | 11.91 | 9.18 | 2.02 | 2.28 | 13.92 | 11.46 |
| Total | 34.38 | 36.29 | 12.91 | 10.85 | 33.64 | 31.59 | 13.65 | 15.53 | 47.29 | 47.12 |
Source: Estimated from unit level data of NSO 68th Round EUS 2011-12 and NSO PLFS, 2017-18
Note: 1. Projected population as on 1st January, 2018 was 135.74 crore which has been derived using the NSO- EUS (2011-12) formula, A = A1 * [1 + R100]82/120, where A1 is the census population as on 1st March 2011, R is the percentage decadal change in population between census 2001 and 2011 and A is the projected population as on 1st January, 2018.
2. The figures are to be read along with explanatory note for comparability.
unchanged at 52 per cent during this period (Table 5 & Figure 5).
10.21 The distribution of workers in casual labour category decreased by 5 percentage points from 30 per cent in 2011-12 to 25 per cent in 2017-18 with the decline being in rural areas (Figure 5 & Table 5).
Formalization of Jobs
10.22 With introduction of GST, digitization of payments, direct benefit transfer of subsidies/ scholarships/wages & salaries to bank accounts, opening of Jan Dhan accounts, extending social security coverage to more workers, the government has been making efforts to formalize the economy (Box 4). As a result of these initiatives, an increase in formal employment is evident as is shown through multiple data sources.
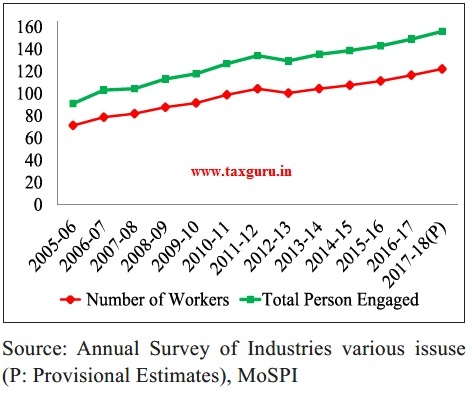
10.23 According to the Annual Survey of Industries (ASI), there has been an increase in employment in the organized manufacturing sector. Between 2014-15 and 2017-18, the total number of workers engaged in the sector increased by 14.69 lakh while total persons engaged (inclusive of employees and employers) increased by 17.33 lakh (Figure 6).
Figure 6 : Employment in Organized Manufacturing in India (in lakh)
10.24 To indicate the extent of formalization of workforce by extending coverage of organized social security, the Government since September, 2017 publishes the monthly
Box 4: Steps Taken Towards Formalisation of the Labour Market
> For portability of Provident Fund accounts, EPFO launched a “Universal Account Number” service for contributing members.
> Government is paying 12 per cent of employer contribution to EPFO in respect of the new employees drawing salary up to `15,000 per month for the first three years of their employment, under Pradhan Mantri Rozgar Protsahan Yojana (PMRPY). The scheme has ended on 31st March, 2019.
> Mandatory wage ceiling of subscription to EPS increased from ` 6,500 to ` 15,000 per month. The Code on Wages Act, 2019 to ensure minimum wages to all and timely payment of wages to all employees irrespective of the sector of employment without any wage ceiling, except MGNREGA.
> MUDRA and STAND-UP India for creating formal credit to businesses.
> Rate of ESI contribution reduced from 6.5 per cent to 4 per cent with effect from 1st July, 2019. Employer’s share of contribution reduced from 4.75 per cent to 3.25 per cent and employees’ share from 1.75 per cent to 0.75 per cent.
> National Career Service (NCS) Project launched in 2015, provides a host of career-related services such as dynamic job matching, career counselling, job notifications and information on skill development courses and rich career content on a digital platform (www.ncs.gov.in). NCS works towards bridging the gap between job-seekers and employers candidates seeking training and career guidance, agencies providing training and career counselling by transforming the National Employment Service.
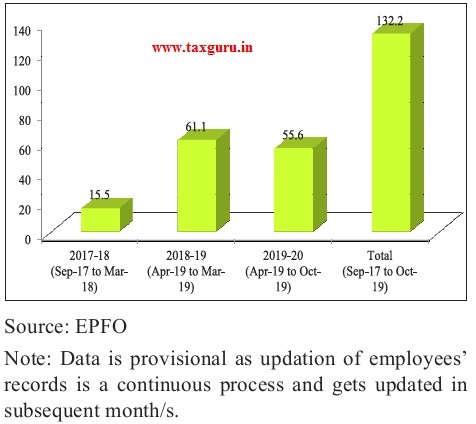
payroll data indicating the number of new subscribers who have availed benefits under three major social security schemes, viz; the Employees’ Provident Fund (EPFO), Employees’ State Insurance Scheme (ESIC) and the National Pension Scheme (NPS). Of these, EPFO has more than 6 crore active members (with atleast one-month contribution during the year). EPFO manages social security funds of workers in the organized/semi-organized sector in India. The pay roll data of EPFO for 2019-20 as on 20th December 2019 shows a net increase of 55.6 lakhs as EPFO subscriber compared to 61.12 lakhs in 2018-19 (Figure 7). These estimates are net of the members newly enrolled, exited and rejoined during the year as per records of the EPFO.
10.25 The estimates of share of workers in informal sector in non-agricultures and AGEGC (Agricultural sector excluding only growing of crops, market gardning, horticulture and growing of crops combined with farming of animals) sectors obtained
Figure 7: Net Employees’ Provident Fund Subscriber (in lakh)
from the NSO-EUS and PLFS 2017-18, also show a decline from 77.5 per cent in 2004-05 to 68.4 per cent in 2017-18, with the decline being more pronounced among females (Table 6).
10.26 To get a holistic picture of the extent of formal-informal employment in the economy,
Table 6: Employment in Informal Sector Enterprises among usual status Workers engaged in Non-agriculture and AGEGC Sectors (in per cent)
| Category of Workers | EUS 61st Round 2004-05 | EUS 66th Round 2009-10 | EUS 68th Round 2011-12 | PLFS 2017-18 |
| Male | 76.7 | 71.5 | 73.4 | 71.1 |
| Female | 79.7 | 69.8 | 69.2 | 54.8 |
| Person | 77.5 | 71.1 | 72.4 | 68.4 |
Source: NSO (EUS) various rounds and PLFS (2017-18)
Note: The figures are to be read along with explanatory note for comparability.
the NCEUS (2007a)6 definition was applied upon the workforce estimates of PLFS to identify the total number of formal and informal workers employed in the organized and unorganized sector. It was observed that the proportion of workers in organized sector increased from 17.3 per cent in 201112 to 19.2 per cent in 2017-18 (Table 7). In actual terms, the number of workers in the organized sector increased to about 9.05 crore workers in 2017-18, an increase of 0.87 crore over 2011-12. This was mainly due to the increase in formal employment, the share of which in organized sector increased from 45 per cent in 2011-12 to 49 per cent in 201718. Total formal employment increased from 8 per cent to 9.98 per cent during this period. In absolute terms, the number of workers with formal employment increased from 3.8 crore in 2011-12 to 4.7 crore in 2017-18 (Table 7).
Table 7: Formal-Informal Employment across Organized and Unorganized Sector
| Employ-ment | Organized (in per cent) |
Unorganized (in per cent) | Total
(in per cent) |
Organized (in crore) |
Unorganized (in crore) | Total (in crore) |
|
2004-05 |
||||||
| Formal | 53.42 | 0.36 | 7.46 | 3.34 | 0.14 | 3.41 |
| Informal | 46.58 | 99.64 | 92.38 | 2.91 | 39.35 | 42.26 |
| Total | 13.68 | 86.32 | 100 | 6.25 | 39.49 | 45.67 |
|
2011-12 |
||||||
| Formal | 45.4 | 0.40 | 8.1 | 3.71 | 0.16 | 3.83 |
| Informal | 54.6 | 99.6 | 91.9 | 4.47 | 38.95 | 43.46 |
| Total | 17.3 | 82.7 | 100 | 8.18 | 39.11 | 47.29 |
|
2017-18 |
||||||
| Formal | 48.91 | 0.74 | 9.98 | 4.43 | 0.28 | 4.70 |
| Informal | 51.09 | 99.26 | 90.02 | 4.62 | 37.79 | 42.43 |
| Total | 19.2 | 80.8 | 100 | 9.05 | 38.07 | 47.13 |
Source: Estimated from unit level data of NSO (EUS) various rounds and PLFS (2017-18) Note: The figures are to be read along with explanatory note for comparability.
GENDER DIMENSION OF EMPLOYMENT
10.27 Gender equality in labour market is considered to be smart economics to achieve faster economic growth and wealth creation as it has the potential to impact upon poverty, inequality and economic well-being of a country through increase in income of the household, spending on health and education of children, improvement in saving, investment and consumption growth. In an era of globalization, no country can develop and achieve its full potential if half of its population is locked in non-remunerative, less productive and non-economic activities (World Bank, 2011).
Female Participation in Labour Market
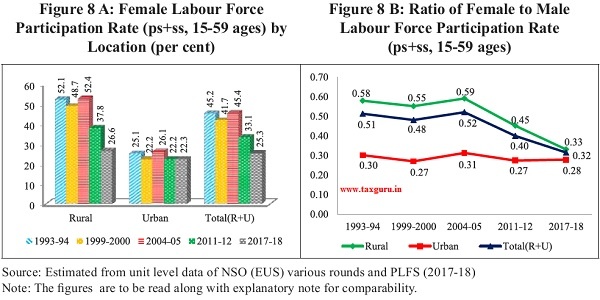
10.28 According to NSO-EUS and PLFS estimates, female labour force participation rate (LFPR) for productive age-group (1559 years) as per usual status (ps+ss) shows a declining trend. Female labour force participation declined by 7.8 percentage points from 33.1 per cent in 2011-12 to 25.3 per cent in 2017-18. Though female LFPR is higher in rural areas as compared to urban areas, the rate of decline was also sharper in rural areas compared to urban areas (Figure 8A). As a result of this, gender disparity in India’s labour market has increased which is reflected from declining trend in ratio of female to male labour force participation rate except for urban females. In urban areas, female labour force participation more or less remained constant. Therefore, ratio of female to male labour force also remained constant between 2011-12 and 2017-18 (Figure 8B).
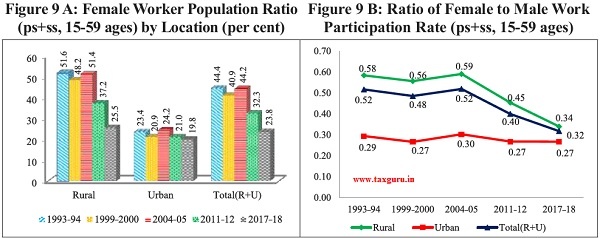
10.29 Female Worker Population Ratio (WPR) also shows a similar trend7. As per PLFS, female WPR for productive age group (15-59 ages) stood at 23.8 per cent (25.5 per
cent in rural areas and 19.8 per cent in urban areas) in 2017-18 as compared to 32.3 percent in 2011-12 (Figure 9A). As a result of this, ratio of female to male work participation rate has also shown consistent declining trend in India except for urban females (Figure 9 B).
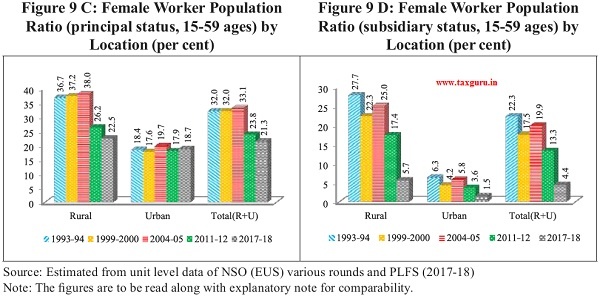
10.30 Based on the activity status – principal (ps) and subsidiary (ss)- indicates that participation of females, especially in rural areas, who were engaged in subsidiary activities has drastically declined (from 25 per cent in 2004-05 to 5.7 per cent in 2017-18) (Figure 9 D) as compared to females engaged as per principal status (Figure 9 C). This clearly indicates that those female workers who had stable jobs continued while those who were not full time workers are dropping out of the labour market.
Factors Influencing Female Labour Force Participation
10.31 While women account for almost half of India’s population, their participation in the labour market is almost one-third as well as declining over several Survey Rounds. To understand this declining trend, the activity status of females outside the workforce was examined separately for youth (15-29) as well as for the age groups (30-59 & 15-59). As seen in Table 8, in 2017-18, higher proportion of young males (10.5 per cent) were unemployed
–
compared to young females (3 per cent). The proportion of youth attending educational institutions has increased at a faster rate from 23 per cent in 2004-05 to 38.5 per cent in 2017-18 for young males, while for young females the proportion almost doubled from 15.8 per cent in 2004-05 to 30.3 per cent in 2017-18. It may be considered a remarkable achievement that around one-third of youth were engaged in acquiring skills and delayed their entry into labour market. However, among young females around 52.3 per cent were engaged in domestic activities in 2017-18 and this proportion has increased over the last two decades. Similarly, in the productive age group 30-59, where females were out of education, the proportion of females attending domestic duties increased from 46 per cent in 2004-05 to 65.4 per cent in 2017-18 (Table 8). For the productive age group (15-59 years) as compared to less than 1 per cent of males, about 60 per cent of working age females were outside labour market attending to domestic duties only.
10.32 The educational attainment of out of workforce productive age group females
Table 8: Distribution of Out-of-Work Force (principal status + subsidiary status, 15-59 age) population into major activities by Sex (percent)
| Activities | 2004-05 | 2011-12 | 2017-18 | |||
| Male | Female | Male | Female | Male | Female | |
|
15-29 Age group |
||||||
| Unemployed (A) | 3.91 | 2.18 | 3.77 | 1.62 | 10.45 | 2.94 |
| Out of labour force (B) | ||||||
| Attending Education Institutes | 23.19 | 15.88 | 34.33 | 25.44 | 38.47 | 30.30 |
| Attending domestic Duties | 0.47 | 45.92 | 0.51 | 49.25 | 1.03 | 52.29 |
| Others | 1.72 | 1.12 | 1.60 | 0.91 | 1.72 | 1.00 |
| Total Out-of-Work Force (A + B) | 29.28 | 65.09 | 40.21 | 77.25 | 51.68 | 86.53 |
|
30-59 Age group |
||||||
| Unemployed (A) | 0.43 | 0.49 | 0.36 | 0.24 | 1.29 | 0.48 |
| Out of labour force (B) | ||||||
| Attending Education Institutes | 0.03 | 0.05 | 0.03 | 0.05 | 0.10 | 0.11 |
| Attending domestic Duties | 0.24 | 46.03 | 0.22 | 58.52 | 0.37 | 65.39 |
| Others | 2.26 | 1.89 | 1.96 | 1.84 | 2.69 | 2.84 |
| Total Out-of-Work Force (A + B) | 2.96 | 48.47 | 2.57 | 60.63 | 4.45 | 68.82 |
|
15-59 Age group |
||||||
| Unemployed (A) | 2.01 | 1.24 | 1.86 | 0.83 | 5.30 | 1.51 |
| Out of labour force (B) | ||||||
| Attending Education Institutes | 10.50 | 7.07 | 15.11 | 10.89 | 16.90 | 12.75 |
| Attending domestic Duties | 0.34 | 45.98 | 0.35 | 54.57 | 0.66 | 59.90 |
| Others | 2.01 | 1.55 | 1.81 | 1.44 | 2.27 | 2.07 |
| Total Out-of-Work Force (A + B) | 14.86 | 55.83 | 19.12 | 67.72 | 25.13 | 76.24 |
Source: Estimated from unit level data of NSO (EUS) various rounds and PLFS (2017-18)
Note: The figures are to be read along with explanatory note for comparability; and ‘Others’ includes recipient of remittances, disabled and others.
shows interesting results. It was found that those with middle level and secondary level education were engaged in domestic duties compared to highly educated women for all age sub-groups. For the productive age group (15-59 years), only 5.3 per cent of highly educated women are engaged in full time domestic duties while remaining 54.6 per cent of women attending domestic duties are up to secondary level educated (Table 9). Thus, it is lack of attainment of appropriate education level /skill sets that are confining women to domestic duties.
Table 9: Distribution of female attending domestic duties (ps+ss) by Age Group and Level of Education in India,
2017-18 (per cent)
| Level of Education | Age Groups | ||
|
15-29 |
30-59 | 15-59 | |
| Illiterate | 8.0 | 26.1 | 18.5 |
| Up to Middle Level | 23.9 | 24.7 | 24.4 |
| Secondary | 14.3 | 9.8 | 11.7 |
| Graduate and above | 6.0 | 4.7 | 5.3 |
| Total | 52.3 | 65.4 | 59.9 |
Source: Annual Report, PLFS 2017-18
Note: Graduate and above includes diploma/certificate courses
10.33 Considerable amount of research work has been done to identify the reasons behind low and declining female labour force participation rates for India. The arguments advanced in support of the declining and low female LFPR are from both supply and demand side. On the supply side, it was argued that as more women in rural areas are now pursuing higher education has delayed their entry into the labour market (Rangarajan et. al., 2011). It could also be because the household incomes have risen in rural areas on account of higher wage levels which is dragging women out of the labour market (Himanshu, 2011). The female LFPR could be low also due to cultural factors, social constraints and patriarchal norms restricting mobility and freedom of women (Das, 2006, Banu, 2016). The relatively higher responsibilities of unpaid work and unpaid care work could also be constraining women participation in the labour market (World Economic Forum, 2018). On the demand side, absence of job opportunities and quality jobs and significant gender wage gap are restraining factors (World Bank, 2010; Chowdhury, 2011; Kapsos et. al, 2014). Sanghi et. al. (2015) using NSSO-EUS data concluded that besides income effect, education effect and the problem of underestimation, what is left unnoticed is the structural transformation of the economy and its resultant impact on the female labour market. Mehrotra and Sinha (2017) also pointed out that structural shift away from agricultural employment, and increased mechanization of agriculture were factors behind declining female employment trends in rural areas. In addition, it was also observed that the decline in animal husbandry, and in urban areas a fall in international demand for products of labour-intensive industries have led to lowering of female LFPR in India.
10.34 Low female wages in agriculture sector were driving out females engaged as unpaid labour. The structural transformation of the economy did not change the labour market commensurately. The fall in employment in agriculture has not shown concomitant increase in opportunities for women in the manufacturing sector where most women with middle to secondary levels of education and from middle income groups are likely to look for employment (Chandrasekhar and Ghosh, 2011). Withdrawal of men from agriculture and shift to the construction sector in urban areas, led to loss of jobs for rural women who were engaged as unpaid labour along with the men. The loss of jobs as casual labour in agriculture also led to withdrawal of women from labour force (Kannan and Raveendran, 2012). Thus, the achievements in female education and the subsequent loss of female dominated jobs in agriculture and manufacturing sector could have contributed to the continued decline in female LFPR. Though substantial exploration has been undertaken to explain declining female work participation from demand as well as supply side but there is still no consensus among the scholars regarding the declining trend in female employment in recent decades.
Initiatives to Improve Female Work Participation
10.35 To encourage female participation in the economy, various programmes/ legislative reforms are in place. A number of protective provisions have been incorporated in various labour laws for creating congenial work environment for women workers such as child care centers, time-off for feeding children, enhancement in paid maternity leave from 12 weeks to 26 weeks, provisions for mandatory crèche facility in the establishments having 50 or more employees, permitting women workers in the night shifts with adequate safety measures, etc. The Equal Remuneration Act, 1976 provides for payment of equal remuneration to men and women workers for same work or work of similar nature without any discrimination. Under the provisions of the Minimum Wages Act, 1948, the wages fixed by the appropriate Government are equally applicable to both male and female workers without any gender discrimination. In order to enhance the employability of female workers, the Government is providing training to them through a network of women Industrial Training Institutes, National Vocational Training Institutes and Regional Vocational Training Institutes. Besides these, various initiatives have been implemented for empowerment of women across the country. The details of these major schemes are as under:
i. Safety of Women at Workplace: Safety and security of women in the country is of utmost priority for the Government. The Sexual Harassment of Women at Workplace (Prevention, Prohibition and Redressal) Act, 2013 covers all women, irrespective of their age or employment status and protects them against sexual harassment at all workplaces both in public and private sector, whether organized or unorganized. The Act mandates all the workplace having more than 10 workers to constitute Internal Complaint Committee (ICC) for receiving complaints of sexual harassment. Similarly, the appropriate Government is authorized to constitute Local Complaint Committee (LCC) in every district which will receive complaints from organizations having less than 10 workers or if the complaint is against the employer himself.
ii. ahila Shakti Kendra Scheme: This scheme aims to empower rural women through community participation. The scheme envisages community engagement through College Student Volunteers to empower rural women in 115 aspirational districts as part of block level initiatives.
iii. Provision of safe and affordable accommodation: To provide safe and affordable accommodation to working women, Working Women Hostels have been established. These hostels have day care facility for the children of inmates too.
iv. Women Helpline Scheme (WHL): WHL implemented since 1st April, 2015 to provide 24 hours emergency and non-emergency response to women affected by violence through referral and information about women related government schemes/programmes across the country through a single uniform number (181).
v. One Stop Centre (OSC): This scheme facilitates access to an integrated range of services including police, medical, legal, psychological support and temporary shelter to women affected by violence. One Stop Centres are being set up in all districts of the country.
vi. Female Entrepreneurship: To promote female entrepreneurship, the Government has initiated schemes like: MUDRA, Stand Up India and Mahila e-Haat (online marketing platform to support women entrepreneurs/ SHGs/NGOs). Pradhan Mantri Mudra Yojana (PMMY) provides access to institutional finance to micro/small business units upto ` 10 lakh. Out of total beneficiaries, almost 75 per cent were women borrowers. To encourage further coverage of women borrowers, the Micro Units Development and Refinance Agency Ltd. (MUDRA) extends a rebate of 0.25 per cent on its refinance interest rate for PMMY loans given by Micro Finance Institutions to women borrowers. Stand-UP India, the Government provides bank loans between ` 10 lakh and ` 1 crore to at least one Scheduled Caste (SC)/ Scheduled Tribe (ST) borrower and at least one-woman borrower per bank branch for setting up greenfield enterprises in the manufacturing, services or the trading sector.
vii. Rashtriya Mahila Kosh (RMK) is an apex micro-finance organization that provides micro-credit at concessional terms to poor women for various livelihood and income generating activities. Among other things, RMK also promotes and supports expansion of entrepreneurship skills among women.
viii. Prime Minister’s Employment Generation Programme (PMEGP): Under the scheme, women entrepreneurs are provided 25 per cent and 35 per cent subsidies for the project set up in urban and rural areas respectively. For women beneficiaries, own contribution is only 5 per cent of the project cost while for general category it is 10 per cent. All the entrepreneurs including women are eligible for 2 weeks Entrepreneurship Development Programme (EDP) after the sanction of their projects from banks for financial assistance to setup their unit and also imparting training under EDP.
ix. Deendayal Antyodaya Yojana-National Rural Livelihoods Mission (DAY-NRLM) – seeks to reach out to 8-9 crore rural poor households and organize one-woman member from each household into affinity-based women SHGs and federations at village and at higher levels. Support is provided to the women for employment and self-employment venture under the scheme to enhance their farm livelihoods and non-farm livelihood through various components of schemes such as organic farming, Krishi Sakhi, Pashu Sakhi, dairy value chain interventions, Aajeevika Grameen Express Yojana, Start-up Village Entrepreneurship Programme etc. DAY-NRLM provides Revolving Funds (RF) at the rate of ` 10,000-15,000 per SHG and Community Investment Support Fund (CISF) to the extent of ` 2.5 lakh per SHG to support their income generating and livelihood activities.
HEALTH FOR ALL
10.36 The introduction of National Health Policy, 2017 for universal access to good quality health care services, and subsequent launch of Ayushman Bharat, with its two components: 1) Health & Wellness Centres to provide comprehensive primary health care, and 2) Pradhan Mantri Jan ArogyaYojana (PMJAY) to provide health cover to 10.74 crore poor & vulnerable families upto ` 5 lakh per family per year for secondary & tertiary hospitalization, speaks about Government’s efforts for a healthy India. The focus of healthcare is on four important pillars – preventive healthcare, providing affordable healthcare, building medical infrastructure and mission mode interventions for maternal health, child health and to combat communicable and non-communicab-g the marked increase in burden of non-communicable diseases, the Government is now focused on addressing this epidemiological transition from communicable diseases (CDs) to non-communicable diseases (NCDs).
Preventive Health Care
10.37 To promote preventive healthcare, one and half lakh Ayushman Bharat-Health & Wellness Centres (AB-HWCs) are proposed to be set up by 2022. A total of 28,005 have already been set up (as on 14 Jan 2020) to deliver comprehensive Primary Health Care services with focus on universal high quality screening, prevention, control and management of common
Table 10: India- Select Health Indicators
| Sl. No | Parameter | 1991 | 2001 | 2011 | Current level |
| 1 | Crude Birth Rate (per 1000 population) | 29.5 | 25.4 | 21.8 | 20.2 (2017) |
| 2 | Crude Death Rate (per 1000 population) |
9.8 | 8.4 | 7.1 | 6.3 (2017) |
| 3 | Total Fertility Rate | 3.6 | 3.1 | 2.4 | 2.2(2017) |
| 4 | Maternal Mortality Ratio (per 1,00,000 live births) | NA | 301 (2001-03) | 167 (2011-13) | 122 (2015-17) |
| 5 | Infant Mortality Rate (per 1000 live births) |
80 | 66 | 44 | 33(2017) |
| Rural | 87 | 72 | 48 | 37 | |
| Urban | 53 | 42 | 29 | 23 | |
| 6 | Child (0-4 years) Mortality Rate (per 1000 children) | 26.5 | 19.3 | 12.2 | 8.9(2017) |
| 7 | Life Expectancy at Birth | (1991-95) | (2001-05) | (2009-13) | (2013-17) |
| Total | 60.3 | 64.3 | 67.5 | 69.0 | |
| Rural | 58.9 | 63.0 | 66.3 | 67.7 | |
| Urban |
65.9 |
68.6 | 71.2 | 72.4 |
Sources: Sample Registration Survey (SRS) and SRS based Abridged Life Tables, Registrar General of India (RGI)
NCDs such as Hypertension, Diabetes, and the three common Cancers – Oral Cavity, Breast and Cervical Cancer, while continuing to provide services for Reproductive, Maternal, Adolescent and Child health (RMNCH+A) and for communicable diseases.
10.38 Under Mission Indradhanush, 3.39 crore children and 87.18 lakh pregnant women in 680 districts across the country (including Gram Swaraj Abhiyan [GSA] & extended GSA) have been vaccinated. New vaccines such as Measles-Rubella (MR), Pneumococcal Conjugate Vaccine (PCV), Rotavirus Vaccine (RVV) and Inactivated Polio Vaccine (IPV) have been introduced. As on 31st December 2019, 32.42 crore children have been vaccinated with MR. A total of 218.96 lakh doses of PCV have been administered (till November 2019), since introduction. RVV was introduced in 11 States and around 7.44 crore doses have been administered to children, till November 2019. Moreover, nearly 11.73 crore doses of IPV have been administered (as in November 2019) to children across the country since its introduction.
10.39 Apart from the above, recognizing the need for addressing the social determinants of health, the government has adopted a multi-sectoral approach and is increasingly synergizing its efforts with other Mission Mode initiatives of the Government such as Eat Right & Eat Safe, Fit India, Anaemia Mukt Bharat, Poshan Abhiyan and Swacch Bharat Abhiyaan etc.
10.40 Recognising the threat of nicotine addiction among youth and children through gateway products such as e-cigarettes, the government recently banned all commercial operations in e-cigarettes. Large pictorial warnings and quitline number on tobacco packs and the resulting increased call volumes from 20,000 to 2.50 lakh calls per month at the quitline services, indicate that government’s efforts to reduce tobacco use are starting to bear fruit.
Health Care Affordability
10.41 Access to healthcare has improved over the years in India. As per the latest National Health Accounts (NHA) 2016-17, the out of pocket expenditure (OoPE) as a percentage of total health expenditure has declined from 64.2 per cent in 2013-14 to 58.7 per cent in 2016-17. Primary healthcare accounts for 52.1 per cent of India’s current public expenditure on health as per the National Health Estimates, 2016-17. The National Health Policy, 2017 recommended to spend at least two third of Government’s health expenditure on primary healthcare.
10.42 Ayushman Bharat- Pradhan Mantri Jan Arogya Yojana (PM-JAY), the world’s largest health insurance scheme, is a major step towards providing affordable healthcare to the identified poor. The Scheme has been rolled out based on the deprivation and occupational criteria of the Socio-Economic Caste Census for rural and urban areas respectively. In addition, AB-HWCs will provide free essential medicines and diagnostic services closer to the community for their primary healthcare needs thereby aiming to reduce OoPE.
10.43 Under Free Drugs Service initiative, substantial funds have been given to States for provision of free drugs. All States/UTs have notified policy to provide essential drugs free in health facilities. Drugs procurement, quality system and distribution has been streamlined through IT based Drug Distribution Management Systems in 29 States.
10.44 Free Diagnostics Service initiative was launched to address the high OoPE on diagnostics and improve quality of healthcare services. The guidance document for implementation of Free Laboratory Services in States/ UTs was released in August 2019 to guide States/ UTs on planning and implementing Labs services in Hub and Spoke model, and the range of diagnostics tests have been expanded from earlier 7 tests to 14 tests at Sub Centre/ Health & Wellness Centre level, 19 tests to 63 tests at PHC level, 39 tests to 97 tests at CHC level and 56 tests to 134 tests at DH level. The tests encompass hematology, serology, bio-chemistry, clinical pathology, microbiology, radiology, and cardiology. As on 1st November 2019, FDI Laboratory services have been implemented in 33 States/UTs (PPP mode in 11 States/UTs and In-house mode in 22 States/UTs); FDI CT Scan services have been implemented in 23 States/UTs (PPP mode in 13 States/ UTs and In-house mode in 10 States/UTs) and FDI Teleradiology services have been implemented in 10 States in PPP mode.
10.45 In addition to the above, Pradhan Mantri Bharatiya Jan Aushadi Pariyojana (PMBJP) and Pradhan Mantri National Dialysis Programme (PMNDP) are some of the new initiatives that address the issue of high OoPE on account of drugs and hospital care.
Medical Infrastructure
10.46 The doctor-population ratio in India is 1:1456 (population estimated to be 1.35 billion) against the WHO recommendation of 1:1000. To address the shortage of doctors, the government has embarked on an ambitious programme for upgradation of district hospitals into medical colleges. In last 5 years, government has sanctioned 141 new medical colleges.
10.47 The norms for graduate and post graduate seats in medical colleges have also been revised. The maximum intake capacity at MBBS level has been increased from 150 to 250, the norms for setting up of Medical colleges in terms of requirement of land, faculty, staff bed strength etc have been rationalized. The Government operates Centrally Sponsored Scheme–establishment of New Medical Colleges attached with existing District/Referral Hospitals’ with fund sharing between Centre and States. As a result, the number MBBS and PG seats have increased by 27,235 and 15,000 respectively. These efforts would go a long way in addressing the shortage of doctors.
10.48 The Pradhan Mantri Swasthya Suraksha Yojana (PMSSY) was launched to augment the tertiary healthcare capacity in clinical care, medical education and research in underserved areas of the country, under which AIIMS like institutions are built and Government Medical Colleges are upgraded by setting-up Super Speciality Blocks.
10.49 National Medical Commission Act, 2019 was promulgated to enable constitution of National Medical Commission. Reforms have also been brought about with the introduction of a common entrance test NEET-UG for admission to all MBBS courses including AIIMS and JIPMER.
10.50 With the continuous efforts by the Government in the area of health care system, the progress in development of health care infrastructure along with availability of human resources has remarkably grown over the years (Table 11).
10.51 Government of India supports States in Health Systems Strengthening under the umbrella programme of National Health Mission (NHM). This has resulted in striking improvements in health infrastructure of public health facilities in States also. Apart from setting up AB-HWCs, work of new
Table 11: Health Care Infrastructure
| Facilities | 2014 | 2018 |
|
SC/PHC/CHC |
182709 ( as on 31.3.2014) | 189784 (as on 31.3.2018) |
| Government Hospital (rural & urban areas, including CHC) | 20306 | 25778 |
| AYUSH Hospital & Dispensaries | 29733 (as on 1.4.2014) | 31986 (as on 1.4.2018) |
| Medical Colleges | 398 (2014-15) | 539 (2019-20) |
| Nursing Personnel | 2621981 (as on 31.12.2014) | 2966375 (as on 31.12.2017) |
| Pharmacists | 664176 (as on 27.6.2014) | 1125222 ( as on 27.3.2019) |
| Doctors (Modern System)* | 747109 (upto 2014) | 923749 (upto 31.12.2018) |
| AYUSH Doctors | 736538 (as on 1.1.2014) | 799879 (as on 1.1.2018) |
Source: National Health Profile 2015 and 2019.
Notes: 1: SC: Sub Centre; PHC: Primary Health Centre; CHC: Community Health Centre; AYUSH: Ayurveda, Yoga, Unani, Siddha and Homeopathy
2: *Assuming 80 per cent of registered doctors are available.
construction/renovation of sub-centres, Primary Health Centre, Community Health Centres, Sub-District Hospitals, and District Hospitals has been undertaken across the country (Table12).
10.52 The Government has also supported States to add nearly 2.51 lakh additional health human resources including 10,767 General Duty Medical Officers, 3062 Specialists, 61,660 Staff Nurses, 84,077 Auxiliary Nurse Midwifes (ANMs), 42,031 Paramedics, 414 Public Health Managers and 17,265 Programme Management staff on contractual basis. Significant progress has also been made in multi-skilling of doctors at strategically located facilities identified by the States where there is shortage of specialists e.g. MBBS doctors are trained in Emergency Obstetric Care, Life Saving Anesthesia Skills
Table 12: Public Health Infrastructure under National Health Mission
| Facility | New Construction | Renovation/Upgradation | ||
| Sanctioned | Completed | Sanctioned | Completed | |
| Sub Center | 27573 | 21014 | 18707 | 15345 |
| Primary Health Centre | 2920 | 2264 | 13324 | 11462 |
| Community Health Centre | 604 | 473 | 6692 | 5771 |
| Sub District Hospital | 240 | 139 | 1150 | 963 |
| District Hospital | 172 | 129 | 3201 | 2325 |
| Total | 31509 | 24019 | 43074 | 35866 |
Source: Department of Health & FW (as on 30.6.2019)
and Laparoscopic Surgery. Similarly, due importance is given to capacity building of nursing staff and ANMs. The mission also supports co-location of AYUSH services in health facilities such as PHCs, CHCs and DHs. There are 10.42 lakh Accredited Social Health Workers (ASHAs) across the country in rural and urban areas under the NHM, who act as a link between the community and the public health system.
Mission Mode Interventions
10.53 In order to intensify efforts towards achievement of SDGs, the Government has launched ambitious programmes such as Ayushman Bharat, marking a paradigm shift in the way health care is delivered. Ayushman Bharat targets universal health coverage by focusing on preventive, promotive and palliative care apart from ambulatory care; and by providing protection against catastrophic health expenditure for secondary and tertiary hospital care. The new paradigm recognizes and addresses the emerging challenges of NCDs due to changing epidemiology and also targets to sustain the efforts for RMNCH+A and communicable diseases through initiatives such as as Surakshit Matritva Aashwasan (SUMAN), Social Awareness and Action to Neutralise Pneumonia Successfully (SAANS) and TB Harega Desh Jeetega.
10.54 The AB-HWCs would follow a well-defined referral and return linkages to ensure continuum of care. At all levels, tele-consultation would be used to improve referral advice and undertake virtual consultation including case management support by doctors and specialists. Several states have also initiated the use of digital platforms such as ECHO for continuous capacity building of the primary health team.
10.55 More than 7.78 crore people have visited these centres and individuals over 30 years of age have been screened for common NCDs. 2.94 crore individuals screened for hypertension and 2.51 crore screened for diabetes, conditions which cause majority of premature morbidity and mortality. The screening for NCDs is also being done for 3 common cancers, wherein as on 11.1.2020, individuals screened for oral cancer (1.52 crore), women for breast cancer (92 lakhs) and cervical cancer (62 lakhs).
HOUSING FOR ALL
10.56 As per recent NSO survey on Drinking Water, Sanitation, Hygiene and Housing Condition in India 2018, about 76.7 per cent of the households in the rural and about 96.0 per cent in the urban areas had the house of pucca structure. Pradhan Mantri Awaas Yojana-Gramin (PMAY-G) and Pradhan Mantri Awaas Yojana-Urban (PMAY-U) are two important schemes for achieving the target of housing for all by 2022.
10.57 More than four times increase in number of houses completed in a year under PMAY-G, from 11.95 lakh in 201415 to 47.33 lakh in 2018-19, signifies government’s commitment of housing for all. Under its Phase-I from 2016-17 to 201819, the scheme has delivered 86.59 lakh completed houses against the target of 1 crore as on 17th January, 2020. Under Phase-II (2019-20 to 2021-22), against the cumulative target of 1.95 crore houses, a total of 5,27,878 houses have been delivered under PMAY-G (as on 17th January, 2020).
10.58 Under PMAY-U, against assessed demand of 1.12 crore, 1.03 crore houses were sanctioned, 61 lakh grounded for construction and 32 lakh have been delivered as on 1st January, 2020. Covering a range of social groups, comprising senior citizens, construction workers, domestic workers, artisans, differently-abled (Divyang), transgender and leprosy patients, the scheme has promoted social inclusiveness, and improved upon women empowerment by giving them ownership of the house.
DRINKING WATER AND SANITATION
10.59 The Department of Drinking Water and Sanitation (DDWS), Ministry of Jal Shakti launched the 10 Year Rural Sanitation Strategy (2019-2029), which focus on sustaining the sanitation behaviour change that has been achieved under the Swachh Bharat Mission Grameen (SBM-G), ensuring that no one is left behind, and increasing access to solid and liquid waste management. Since the launch of the SBM-G in 2014, over 10 crore toilets have been built in rural areas; over 5.9 lakh villages, 699 districts, and 35 States/UTs have declared themselves Open Defecation Free (ODF). This strategy has been prepared by DDWS, in consultation with State Governments and other stakeholders, and it lays down a framework to guide local governments, policy makers, implementers and other relevant stakeholders in their planning for ODF Plus, where everyone uses a toilet, and every village has access to solid and liquid waste management.
10.60 Swachh Survekshan Grameen 2019 survey covered 17,450 villages in 698 districts across India and include 87,250 public places namely schools, anganwadi centers, public health centres, haat/bazaars/religious places, making it India’s largest rural sanitation survey. Around 2.5 lakh citizens were interviewed for their feedback as part of the survey. Citizens will also be mobilised to provide feedback on sanitation related issues online using an application developed for the purpose.
10.61 Jal Shakti Abhiyan was launched to accelerate progress on water conservation activities in the most water stressed blocks and districts of India. Jal Shakti Abhiyan (JSA) has delivered over 3.5 lakh water conservation measures in 256 districts. Out of these, 1.54 lakh are of water conservation and rain water harvesting measures, 20,000 relate to the rejuvenation of traditional water bodies, over 65,000 are reuse and recharge structures and 1.23 lakh are watershed development projects. An estimated 2.64 crore people have already participated in the Abhiyan making it a Jan Andolan.
CONCLUSION
10.62 The efforts of the government with the motto of Sabka Saath, Sabka Vikas and Sabka Vishwas have improved the access to social services. Over the years, the participation in education at all levels has improved both in rural and urban areas. Scaling up of the skill training through a wide network of ITIs and significant rise in women trainees. Under Ayushman Bharat, free diagnostic services are being made available at HWCs, PHCs, CHCs, and DHs and free drug services are provided in health facilities. New Health facilities as well as renovation of existing health facilities being undertaken under NHM. Under Mission Indradhanush, 3.39 crore children and 87.18 lakh pregnant women in 680 districts across the country (including GSA & extended GSA) has been vaccinated. Total formal employment in the economy increased from 8 per cent in 201112 to 9.98 per cent in 2017-18. Access to health services, inter-alia, through Ayushman Bharat and Mission Indradhanush across the country has improved. About 76.7 per cent of the households in the rural and about 96 per cent in the urban areas had houses of pucca structure. Jal Shakti Abhiyan launched to accelerate progress on water conservation activities in water stressed districts of India.
CHAPTER AT A GLANCE
> The expenditure on social services (health, education and others) by the Centre and States as a proportion of GDP increased from 6.2 per cent in 2014-15 to 7.7 per cent in 2019-20 (BE).
> Gross Enrolment Ratio at secondary, higher secondary and higher education level needs to be improved.> India’s ranking in Human Development Index improved to 129 in 2018 from 130 in 2017.
> Gender disparity in India’s labour market widened due to decline in female labour force participation especially in rural areas and around 60 per cent of productive age (15-59) group are engaged in full time domestic duties.> Total formal employment in the economy increased from 8 per cent in 2011-12 to 9.98 per cent in 2017-18.
> Access to health services inter-alia through Ayushman Bharat and Mission Indradhanush across the country has improved. About 76.7 per cent of the households in the rural and about 96 per cent in the urban areas had houses of pucca structure.> Mission Indradhanush has vaccinated 3.39 crore children and 87.18 lakh pregnant women of 681 districts across the country.
> Jal Shakti Abhiyan launched to accelerate progress on water conservation activities in water stressed districts of India.
REFERENCES
1. Banu, A. (2016), “Human development, disparity and vulnerability: Women in South Asia”, Background paper for Human Development Report
2. Chandrasekhar, C P and J Ghosh (2011), “Latest Employment Trends from the NSSO”, Business Line, 12 July.
3. Chowdhury, Subhanil (2011), “Employment in India: What Does the Latest Data Show?”, Economic & Political Weekly, August 6, 2011 vol xlvi no 32.
4. Das, M. B. (2006), “Do traditional axes of exclusion affect labour market outcomes in India?”, Social Development Papers, South Asia Series, No. 97 (Washington DC, World Bank).
5. Himanshu (2011), “Employment Trends in India: A Re-examination”, Economic and Political Weekly, Vol. 46, No. 37, September 10.
6. Kannan, K P and Raveendran G (2012), “Counting and Profiling the Missing Labour Force”, Economic & Political Weekly, 47(8).
7. Kapsos, S., Bourmpoula, E., & Silberman, A. (2014), “Why is female labour force participation declining so sharply in India?”, International Labour Organization.
8. Mehrotra, S., Sinha, S. (2017). “Explaining Falling Female Employment during a High Growth Period”, Economic and Political
Weekly l, 11, 54-62
9. Narayan. L; Sharmila (2019), “Declining Women Labour Force Participation in India-Causes and Issues,” Vol.9(4), April 2019, pp-294-309.
10. Rangarajan, C., Padma Iyer and Seema Kaul (2011), “Where is the missing Labour Force?”, Economic and Political Weekly, Vil.42 No.46 (39), pp- 68-72
11. Sanghi, S., Srija, A., & Vijay, S. S. (2015), “Decline in rural female labour force participation in India: A relook into the causes”, Vikalpa, 40(3), 255- 268.
12. World Economic Forum. (2018), “The global gender gap report” Geneva: World Economic Forum.
Notes:
1. The Human Development Report published by the United Nations Development Programme estimates the HDI in terms of three basic parameters: to live a long and healthy life, to be educated and knowledgeable, and to enjoy a decent economic standard of living.
2 The Government launched a new regular employment-unemployment survey, namely, annual Periodic Labour Force Survey (PLFS), 2017-18 with certain changes in survey methodology, data collection mechanism and sampling design vis-à-vis the earlier quinquennial (once in every five years) Employment and Unemployment Surveys (EUS) of NSO. Under the PLFS, households are selected in both rural and urban areas by providing 75 per cent weightage to households where at least one member has secondary education (Class 10) or above. In the EUS, affluence level and earning from non agricultural activities in rural areas and Monthly Per Capita Consumption Expenditure (MPCE) of household in selected blocks in urban areas were used for stratification of households. Due to the changes in methodology and sampling design, labour market estimates based on PLFS are not strictly comparable with the results of earlier quinquennial surveys on Employment-Unemployment conducted by NSO. The results of the PLFS with earlier rounds of NSO-EUS need to be read along with explanatory notes on survey methodology and sampling design. PLFS estimates and previous round estimates are juxtaposed only for making analytical reasoning and is not a comparison in the strictest sense of the term.
3 Usual status (ps+ss) gives an idea about average working condition of an individual for entire reference year. It can further be
subdivided in to two categories. One is principal status (ps) and other is subsidiary status (ss). Principal status (ps) measures the activity in which an individual has spent relatively longer time of a reference year (major time criterion) while subsidiary status (ss) measures the activity status of an individual who has spent majority of days out of work force but have worked for short period of time (more than 30 days) (Annual Report, PLFS 2017-18).
4 The NSO data classifies the workers on the basis of employment status into three categories viz., self-employed workers; regular wage/salaried employees; and casual labourers. The self-employed category includes those who work for themselves and do not sell their labour power to anyone else in return for wage. This category of workers includes all those workers who operated their enterprises or are engaged in a profession or trade, either on own account, individually or with partners, or as home-based workers (NCEUS; 2009). However, regular wage/salaried employees are those who receive predetermined wages/salary on regular basis. Moreover, casual worker includes those who are hired for very short time period on daily or monthly basis. Out of these three categories, regular wage/salaried employees are better in qualitative terms as they receive pre-determined wages/salary with or without other benefits like social/job security.
5. Own account workers include those who operated their enterprises on their own account or with one or a few partners and ran their enterprise without hiring any labour during the reference period while employers are those own account workers who ran their enterprise by hiring labourers. However, unpaid family labourers/helpers included those who were engaged in their household enterprises, working full or part time and did not receive any regular salary or wages in return for the work performed during the reference period. (Annual Report, PLFS 2017-18).
6. As per National Commission for Enterprises in Unorganized Sector (NCEUS) classification, “The unorganised sector consists of all unincorporated private enterprises owned by individuals or households engaged in the sale and production of goods and services operated on a proprietary or partnership basis and with less than ten total workers.” However, “informal workers consist of those working in the unorganised enterprises or households, excluding regular workers with social security benefits, and the workers in the formal sector without any employment benefits /social security provided by the employers.” (NCEUS, 2007a, p.3).
7. Labour force refers to those who are either engaged in any economic activities or are willing to pursue an economic activity in a reference period. It includes both (1) those who are in workforce; and (ii) unemployed. Of these, workforce refers to the population who are actively engaged in any economic activities and producing goods and services in a reference period while unemployed refers to all those who are seeking and available for work but had not worked in a reference year due to lack of work. Hence, Labour force participation rate (LFPR) can be defined as the proportion of population in the labour force to the total population. Similarly, Worker population ratio (WPR) can be defined as the proportion of employed persons to the total population (Annual Report, PLFS 2017-18).


