During the last five years, India’s economy has performed well. By opening up several pathways for trickle-down, the government has ensured that the benefits of growth and macroeconomic stability reach the bottom of the pyramid. To achieve the objective of becoming a USD 5 trillion economy by 2024-25, as laid down by the Prime Minister, India needs to sustain a real GDP growth rate of 8%. International experience, especially from high-growth East Asian economies, suggests that such growth can only be sustained by a “virtuous cycle” of savings, investment and exports catalysed and supported by a favourable demographic phase. Investment, especially private investment, is the “key driver” that drives demand, creates capacity, increases labour productivity, introduces new technology, allows creative destruction, and generates jobs. Exports must form an integral part of the growth model because higher savings preclude domestic consumption as the driver of final demand. Similarly, job creation is driven by this virtuous cycle. While the claim is often made that investment displaces jobs, this remains true only when viewed within the silo of a specific activity. When examined across the entire value chain, capital investment fosters job creation as the production of capital goods, research & development and supply chains generate jobs.
The Survey departs from traditional Anglo-Saxon thinking by advocating a growth model for India that views the economy as being either in a virtuous or a vicious cycle, and thus never in equilibrium. This model, in turn, stems from two key departures from the traditional view. First, the Survey departs from the concept of equilibrium as a key tenet, which is being challenged increasingly following the Global Financial Crisis. Second, the traditional view often attempts to solve job creation, demand, exports, and economic growth as separate problems. As these macro-economic phenomena exhibit significant complementarities, the Survey postulates the centrality of the triggering macro-economic variable that catalyses the economy into a virtuous cycle. The Survey makes the case for investment as that key driver. By presenting data as a public good, emphasizing legal reform, ensuring policy consistency, and encouraging behaviour change using principles of behavioural economics, the Survey aims to enable a self-sustaining virtuous cycle. Key ingredients include a focus on policies that nourish MSMEs to create more jobs and become more productive, reduce the cost of capital, and rationalise the risk-return trade-off for investments.
LAST FIVE YEARS: THE ACCOMPLISHMENTS
Macroeconomic Stability
1.1 World output grew at 3.6 per cent in 2014 and again in 2018. In the intervening period, when the world did not appear to have changed much, India took a few giant strides forward. India became the sixth largest economy by sustaining growth rates higher than China, thereby earning the epaulette of being the fastest growing major economy in the world (Figure 1). Importantly, this pace of growth was sustained while re-establishing macro-economic stability.
1.2 Average inflation in these five years was less than half the inflation level of the preceding five years, matching the lowest levels attained in the country’s post- independence history. The current account deficit (CAD) remained within manageable levels and foreign exchange reserves rose to all-time highs.
1.3 The performance was not just a one-time adjustment but stemmed from a new institutional framework. Following an agreement between Government of India (GOI) and Reserve Bank of India (RBI), a Monetary Policy Committee (MPC) was constituted in February, 2015 with the mandate to target a headline inflation of 4 per cent, with a band of two percentage points on either side. The framework has been successful in containing inflation. Since April 2015, when the MPC was first convened, the monthly headline inflation has always remained within the band except for one month.
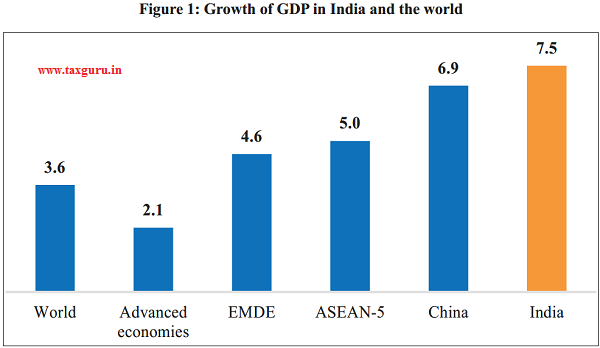
Source: World Economic Outlook, April 2019, IMF
Note: (1). EMDE – Emerging Market and Developing Economies; (2). ASEAN-5 composed of 5 countries: Indonesia, Malaysia, Philippines, Thailand, and Vietnam.
Shifting Gears: Private Investment as the Key Driver of Growth, Jobs, Exports and Demand
1.4 Discipline was also imposed on the Gross Fiscal Deficit (GFD). The Fiscal Responsibility and Budget Management (FRBM) Act of 2003, which got a new lease of life since 2016, determines the glide path for the ratio of GFD to GDP to reach an eventual target of 3 per cent. The ratio declined from 4.5 per cent in 2013-14 to 3.4 per cent in 2018-19. Other macro-stability indicators have similarly improved.
Beneficiary focus and targeted delivery
1.5 In addition to re-establising macroeconomic stability, the government also focused on last-mile delivery of basic services to the poor, on basic safety-nets, and on creating pathways for the benefits of growth to reach the bottom of the socio-economic ladder. The promulgation of the Aadhaar (Targeted Delivery of Financial and Other Subsidies, Benefits, and Services) Act, 2016 was one such initiative that opened a major pathway to this trickle-down. By assigning a unique identification number to every individual, the government now has the ability to provide targeted support. Presently, Aadhaar coverage stands at more than 90 per cent of the country’s population.
1.6 Another pathway for the trickle-down is the Pradhan Mantri Jan Dhan Yojana (PMJDY), a financial inclusion initiative. The linking of mobile numbers with bank account numbers and subsequently Aadhaar, created a JAM (Jan Dhan, Aadhaar, Mobile) trinity that further secured Direct Benefit Transfers (DBT) to the intended beneficiaries. Presently close to `1 lakh crore is deposited in more than 35 crore bank accounts opened under PMJDY. The JAM trinity has enabled cumulative transfers thus far of around `7.3 lakh crore. Presently 55 central ministries through 370 cash-based schemes are transferring benefits under the DBT mechanism. Chapter 10 in Volume I of the Survey, in fact, provides careful evidence of this targeting.
1.7 Major schemes implemented under DBT include MGNREGS (Mahatma Gandhi National Rural Employment Guarantee Scheme), NSAP (National Social Assistance Program), PMAY-G (Pradhan Mantri Awas Yojna- Gramin), besides various scholarships and fertilizer subsidy schemes. A key initiative for last-mile delivery was the Pradhan Mantri Ujjwala Yojana (PMUY) that was launched in 2016. The PMUY had originally targeted to provide 5 crore LPG connections over a span of three years to BPL (Below Poverty Line) families with a support of `1,600 per connection. Till date more than 70 million PMUY-LPG connections have been released to women residing in more than 700 districts. In 2018, another effort to provide a basic safety net was launched through the Ayushman Bharat Yojana (ABY), which provides an insurance cover of `5,00,000 for cashless treatment to each of the 100 million BPL families at a nominal premium of `100 per month. Till date, the scheme has empaneled more than 15,000 hospitals, which have admitted about 2.6 million persons from the 346 million enlisted beneficiaries.
Infrastructure
1.8 The creation of physical infrastructure accelerated significantly during 2014-19. In April 2018, electricity finally reached every village in India with the effort to electrify every home still ongoing. The construction of national highways (NH) proceeded at a rapid pace with more than 20 per cent of the existing highway length of 132,000 km being constructed in the last four years alone. The UDAAN scheme was launched in 2017 to foster regional connectivity by extending flight connectivity to Tier-3 and Tier-4 towns in the country. Over 30 unserved and underserved airports have been mainstreamed under UDAAN with flights creating additional 40 lakh seating capacity. The scheme has also sparked significant increase in helicopter services in hilly areas and islands that engage 31 heliports. The infrastructure of the North-Eastern states was a special focus and there has been a significant improvement in connectivity with the building of key bridges, and the expansion of railways/highways. The 4.94 km long Bogibeel bridge in Assam was inaugurated in December 2018; it is the second longest rail-cum-road bridge in Asia.
Federalism
1.9 Fiscal federalism strengthened significantly when the Fourteenth Finance Commission increased the share of states in the divisible pool of central taxes from 32 per cent to 42 per cent. Although central grants to states saw compensatory cuts, the shift empowers states to manage their revenues and expenditures independently.
1.10 The launch of the GST (Goods and Services Tax) in July, 2017 added a new dimension to centre-state and inter-state financial relations. The GST Council experience provides key learning for implementing cooperative federalism in several other areas such as labour and land regulation. Niti Aayog has helped institutionalize cooperative federalism by setting up teams from both the states and the central government to jointly evolve strategies for addressing development challenges. States have also been involved in a friendly competition to improve their Key Performance Indicators (KPIs).
Corporate Exits
1.11 When the Insolvency and Bankruptcy Code (IBC) was introduced in 2016, it consolidated the insolvency resolution process into a single law by repealing/ in operation. IBC set a time limit for closing of insolvency and bankruptcy cases within which assets of a defaulting borrower are auctioned to pay off the debt owed to lending institutions. Following the operationalization of IBC since 2017, a significant number of non-performing assets have been brought under its ambit. In addition to the large sums recovered by creditors from resolution or liquidation, the introduction of a framework for exit has improved the overall business culture of the country. Chapter 3 in Volume II of the Survey explores this topic in detail.
THE NEXT FIVE YEARS: A BLUEPRINT FOR GROWTH AND JOBS
1.12 With the micro-economic and macro-economic foundations laid over the last five years, the Indian economy is ready to shift gears so that economic growth, jobs and exports can be pushed up to the next level. For this purpose, the Survey presents a blueprint.
Emphasising Growth
1.13 As articulated by the Prime Minister, Shri. Narendra Modi, India aims to grow into a USD 5 trillion economy by 2024-25, which will make India the third-largest economy in the world. Given 4% inflation, as the Monetary Policy Framework specified by the Government for the Reserve Bank of India, this requires real annual growth rate in GDP of 8 per cent.1 What are the ingredients of a model that can generate such growth?
1.14 To understand this key question, we examine the drivers of economic growth followed by countries across the globe. In recent times, Chinese economic growth stands out for its explosive growth over a long period of four decades. Post war economic expansion in Western Europe led to high growth rates of its economies. During 1950-73, Japan’s GDP growth rate frequently exceeded 10 per cent. Post World War II, Hong Kong, Singapore, South Korea, and Taiwan successfully maintained a rapid growth rate of more than 7 per cent until 1980s.
A virtuous cycle of savings, investment, exports and growth with investment as the “central driver”
1.15 The overwhelming evidence across the globe, especially from China and East Asia in recent times, is that high growth rates have only been sustained by a growth model driven by a virtuous cycle of savings, investment and exports catalysed and supported by a favourable demographic phase. As we explain in detail below, investment, especially private investment, is the “key driver” that drives demand, creates capacity, increases labour productivity, introduces new technology, allows creative destruction, and generates jobs.
1.16 We depart from traditional thinking by outlining a growth model that views the economy as being in constant disequilibrium-a virtuous cycle or a vicious cycle. When the economy is in a virtuous cycle, investment, productivity growth, job creation, demand and exports feed into each other and enable animal spirits in the economy to thrive. In contrast, when the economy is in a vicious cycle, moderation in these variables dampen each other and thereby dampen the animal spirits in the economy.
1.17 As we describe in the next section, our view of the economy in either a virtuous or a vicious cycle—with investment as the key driver of this cycle—stems from two key departures from the traditional Anglo-Saxon view of the economy.
1.18 First, the traditional view, which has come under significant challenge following the Global Financial Crisis, considers the concept of equilibrium as a key tenet. In contrast, by imbibing some of the new learning from the economics literature following the Global Financial Crisis, we view the economy as being in a constant state of disequilibrium as captured by a virtuous or a vicious cycle.
1.19 Second, the traditional view often attempts to solve job creation, demand, exports, and economic growth as separate problems. In contrast, as we show below, these macro-economic phenomena exhibit significant complementarities. Therefore, understanding the “key driver” and enhancing the same enables simultaneous growth in each of the other macro phenomena.
1.20 When viewed in this manner, the triggering macro-economic “key driver” that catalyses the economy into a virtuous cycle becomes critical. This Survey makes the case for investment as the “key driver” that can create a self-sustaining virtuous cycle in India. This investment can be both government investments in infrastructure, as such investment crowds in private investment (Chakrabarti, Subramanian and Sesha, 2017), and private investment in itself.
Evidence supporting the “virtuous cycle” view
1.21 Figure 2 shows how the share of GCF, savings and exports in GDP evolved for China as a function of the log of GDP per capita from 1980 to 2017. Crucially, we note that all the three macro-variables increased as the country became richer. Thus, as the economy started doing better, as measured by the rising GDP per capita, China’s savings, investment and exports increased further.3 Figures 3 and 4 show the same relationships for saving and investment for four countries in East Asia (Thailand, Indonesia, Malaysia and South Korea), which witnessed high growth before the Asian Financial Crisis. The time period employed in these charts is 1980-1995, i.e. before the Asian Financial Crisis. While Figure 3 shows the relationship of investment and savings, Figure 4 shows the same for exports except for South Korea. The inference that we made using China, thus, remains unchanged by examining Figure 3 and 4.
Figure 2: Share of GCF, Savings and
Exports in GDP vs. log GDP Per Capita in
constant 2010 US$: China (1980-2017)2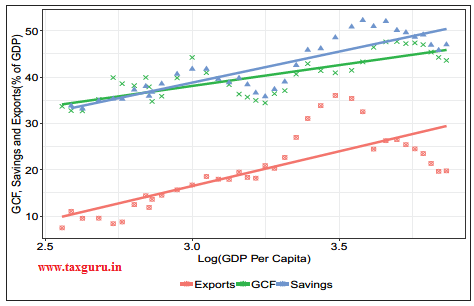
Source: World Bank
Note: GDP per capita is in constant 2010 US$ and the time period used is 1980-2017. The logarithmic scale taken for the x-axis is with base 10 to enable ease of reading.
1.22 Sandri (2014) provides a different way of looking at the same phenomenon.
Figure 3: Share of GCF and Savings in GDP vs. log GDP Per Capita in constant 2010 US$: High Growth East Asian Economies ex-China (1980-1995)
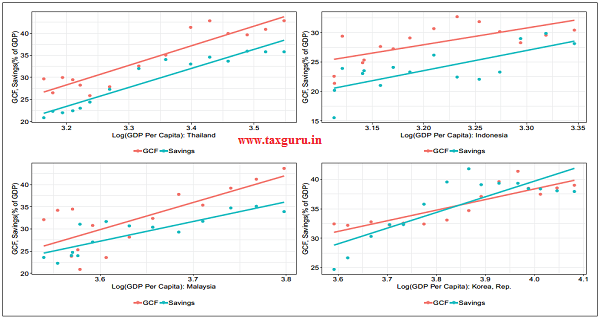
Source: World Bank
Notes: GDP per capita is in constant 2010 US$ and the time period used is 1980-1995. The logarithmic scale taken for the x-axis is with base 10 to enable ease of reading. High Growth East Asian Economies correspond to Indonesia, Malaysia, South Korea and Thailand.
Figure 4: Share of Exports in GDP (%) vs. log GDP Per Capita in constant 2010 US$: High Growth East Asian Economies ex China (1980-1995)
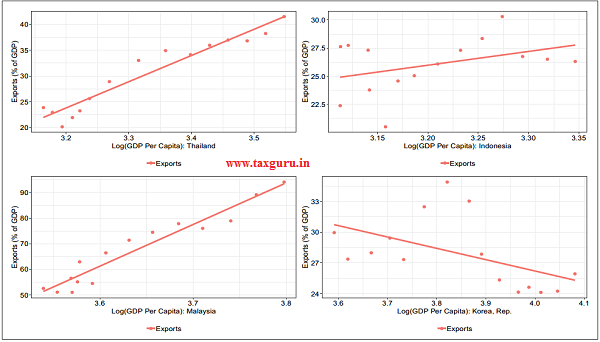
Source: World Bank
Notes: GDP per capita is in constant 2010 US$ and the time period used is 1980-1995. The logarithmic scale taken for the x-axis is with base 10 to enable ease of reading. High Growth East Asian Economies Correspond to Indonesia, Malaysia, South Korea and Thailand.
By averaging across 62 episodes of growth spurts from 1960 to 2011 among non-OECD countries, Sandri (2014) demonstrates that productivity growth across these episodes is combined with a rapidly rising investment rate and an even more steeply increasing savings rate.
1.23 China has relied primarily on savings and investment with consumption decreasing significantly as a share of GDP (Figure 6). China remains an investment-driven economy even today with its investment and savings rates reaching about 45% of GDP even in 2017.
1.24 For China and other East Asian Economies, Figure 7 shows the strong
Figure 5: Changes in productivity, investment, savings and current account across 62 episodes of growth accelerations in non-OECD countries (1960-2011)
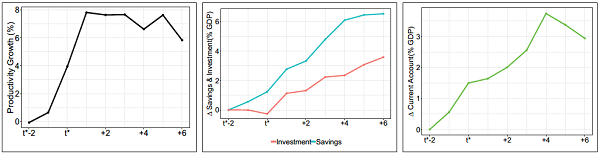
Source: Sandri (2014)
Figure 6: Consumption, Gross Capital Formation and Savings to GDP for China (1980-2017)
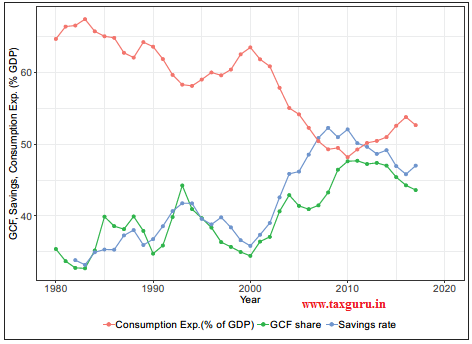
Source: World Bank
Figure 7: GDP Growth vs. Gross Capital Formation to GDP for China and High Growth East Asian Economies ex-China (1980-2000)
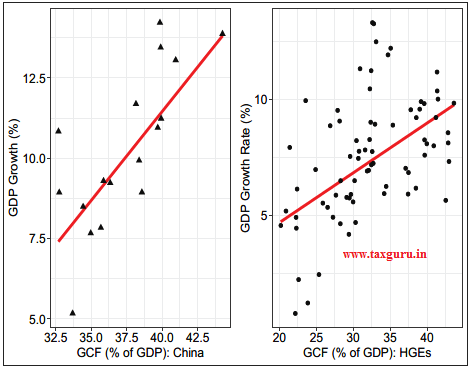
Source: World Bank
Notes: The left panel shows the relationship for China while the right panel shows the same for the four high growth East Asian economies of Thailand, Indonesia, Malaysia and South Korea. Time period used is 1980- 2000. HGEs correspond to the four High Growth East Asian economies of Thailand, Indonesia, Malaysia and South Korea.
correlation between investment as measured by the Gross Capital Formation and GDP growth while Figure 8 shows an equally stronger correlation between investment and savings.
1.25 Thus, the evidence in this section
Figure 8: Gross Capital Formation to GDP vs. Savings rate for China and High Growth East Asian Economies ex-China (1980-2000)
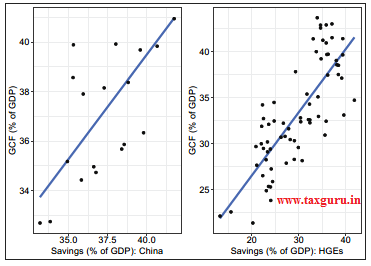
Source: World Bank
Notes: The left panel shows the relationship for China while the right panel shows the same for the four high growth East Asian economies of Thailand, Indonesia, Malaysia and South Korea. Time period taken is 1980- 2000.
suggests that savings, investment and GDP growth have grown in a virtuous cycle in the high growth economies, be it China or other East Asian economies.
Importance of savings
1.26 As Feldstein and Horioka (1980) demonstrated in what has since been labelled the “Feldstein-Horioka puzzle”, a high investment effort must be backed by domestic savings. Further research (Carroll and Weil, 1994; Attanasio, Picci and Scorcu, 2000; Rodrik, 2000) has since shown that savings and growth are not only positively correlated but their positive correlation is even stronger than that between growth and investment (Gourinchas and Jeanne, 2013). In fact, Sandri (2014) argues that as investment is risky, entrepreneurs are exposed to the risk of idiosyncratic business failure that leads to the loss of the invested capital. Therefore, savings have to increase more than investment to allow for the accumulation of precautionary savings. The evidence from Sandri (2014) for the 62 episodes of growth acceleration(Figure 5) and China (Figure 6) shows the same as well.
Jobs
1.27 A general apprehension is that high investment rate will substitute labour. This thinking has led to much debate about labour-intensive versus capital-intensive modes of production. However, the Chinese experience illustrates how a country with the highest investment rates also created the most jobs. What matters most is whether or not investment enhances productivity and thereby international competitiveness. The misconception arises from a view buried in the silo of a specific activity. When examined in the full value chain, capital investment fosters job creation as capital goods production, research and development, and supply chains also generate jobs. International evidence also suggests that capital and labour are complementary when high investment rate drives growth. For instance, Lin (2011) shows that the coming of software and computers, while having replaced some white collar tasks, have also generated new labour centric tasks related to software and application development, computer security, and specialised tasks for loan application analysts and medical equipment technicians.4 Figure 9 shows how unemployment rates decreases with greater gross capital formation in East Asia and Pacific, thereby providing additional evidence that labour and investment complement each other. Therefore, job creation can indeed be
fostered by encouraging investment.
Exports
1.28 With the share of consumption in GDP constrained by the high level of savings, domestic consumption can be, at best, act as
Figure 9: Unemployment Rate vs. Gross Capital Formation (GCF) to GDP for East Asia and Pacific (1960-2017)
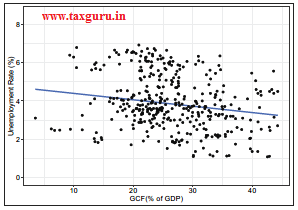
Source: World Bank
a force-multiplier when high income growth feeds consumption. So, where would the final demand for the large capacities created by high investment come from? The answer is exports. This is why an aggressive export strategy must be a part of any investment driven growth model. Figure 10 shows the
Figure 10: GDP Growth vs. Growth in Exports for High Growth East Asian Economies (1980-2017)
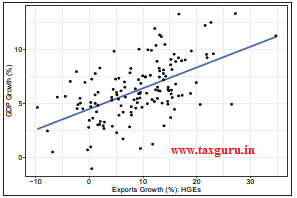
Source: World Bank
Note: Time period taken is 1980-2017 and High Growth East Asian Economies correspond to Indonesia, Malaysia, South Korea and Thailand.
strong correlation between growth in exports and GDP growth for the high growth East Asian economies.
1.29 The global market is extremely competitive with the firms that are able to produce at the lowest costs having the ability to gain market share in exports. So, average productivity of firms in the economy becomes crucial to export competitiveness. As seen in Figure 11, capital investment enhances total factor productivity, which in turn enhances export performance. Therefore, investment becomes crucial to enhancing export performance.
1.30 While it is true that world trade is currently facing some disruptions, India’s share in global exports is so low that it should focus on market share. One could even argue that the current disruptions provide an opportunity for India to insert itself into global supply chains. The High Level Advisory Group, chaired by Dr Surjit Bhalla, submitted its report in June 2019 on how India can enhance its exports. Its recommendations need to be studied and implemented where possible.
GOING BEYOND THE ECONOMICS OF ʻEQUILIBRIUMʼ IN THE BLUEPRINT
“If man is not to do more harm than good in his efforts to improve the social order, he will learn that in this, as in all other fields where essential complexity of an organized kind prevails, he cannot acquire the full knowledge which will make mastery of the events possible. He will therefore have to use what knowledge he can achieve, not to shape the results as the craftsman shapes his handiwork, but rather to cultivate a growth by providing the appropriate environment, in the manner in which the gardener does this for his plants.”
Friederich Von Hayek, Nobel prize speech, 1974.
1.31 As the above quote from Hayek (1974) illustrates, the blueprint starts from the philosophy that economies are intricately interwoven systems. Therefore, they can neither be meaningfully viewed in silos nor can they be analysed without accounting for dynamic effects over time. Moreover, economies may rarely be in a state of equilibrium. While writing about economic theories following the Global Financial Crisis, Rodrik (2018) laments:
“Why do we focus so much on the perfectly rational individual even though real people do not seem to behave quite that way? Shouldn’t we be paying a wee bit more attention to
Figure 11: Effect of GCFC Growth on Productivity and in turn on exports for OECD countries (1985-2017)
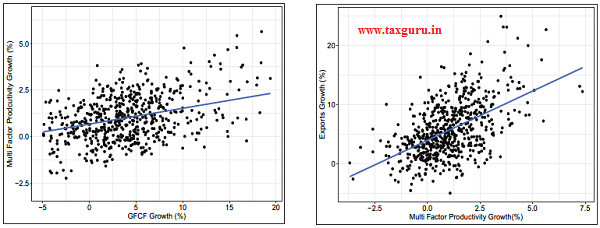
Source: OECD Database.
disequilibrium, in addition to equilibrium? Why do our models exclude social and institutional features without which markets could not work? Why do we emphasize math so much and disregard things that cannot be easily quantified?”
1.32 To highlight the inadequacies in economic models following the Global Financial Crisis, the OECD created the group New Approaches to Economic Challenges (NAEC). In a blog post on NEAC, Ramos (2017) highlights:
“The very name of (traditional economic) models, general equilibrium, shows that they assume that the economy is basically in balance until an outside shock upsets it. They assume that you can understand the economy by studying a representative agent whose expectations and decisions are rational. This view is essentially linear, and the policy advice it generates is tailored to a linear system, where an action produces a fairly predictable reaction… Real life is not like that… We need a new approach to economics that isn’t just about quantitative economics.
An approach that integrates behavioural economics and complex systems theory, as well as economic history.”
1.33 As Box 1 illustrates, the meltdown of economic activity following the Global Financial Crisis highlighted that economies may be in a vicious cycle, where moderation in demand, jobs and investment feed into each other and thereby dampen the animal spirits in the economy. Therefore, as highlighted by Romer (2015), Ramos (2017) and Rodrik (2018), economic thinkers now recognise the need for economics to embrace the learning from other fields. They acknowledge that the concept of treating an economy as always being in equilibrium may “force fit” the “standard” framework to an ever-changing world. Instead, thinking about economies as being in the constant disequilibrium of virtuous or vicious cycles provides a more apt framework for the current times. Therefore, when the economy is viewed, proper sequencing of policy levers assumes importance, especially because of the presence of complementarities between different elements of an economy.
Box 1: The need for economic theory to be contextualised to India
The Global Financial Crisis exposed the problems embedded in conventional macroeconomic theories. Yet, to use this failure as an excuse to disband economic thinking would be to throw the “proverbial baby with the bath water” for theories are required in our field to discipline our thinking and thereby enable careful policymaking. Therefore, economic theories, in general and macroeconomics, in particular, may need to adapt to a world that is in constant disequilibrium. In this context, it is useful to understand the process of theory building in economics and contrast the same with other disciplines to enable us to develop the appropriate model for economic development in India.
The process of building theories in economics proceeds as follows:
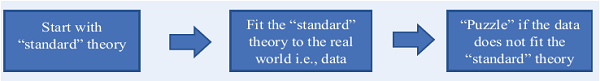
Consider the classic paper by Lucas (1990) to understand this flaw in the theory building process in economics. The paper attempts to explain why capital does not flow, as standard theory predicts, from capital-rich to capital-poor countries, because the latter would have higher returns. The theory starts with some assumptions in “standard” theory such as individuals always making “rational” decisions, the preferences of a collection of individuals captured by the preference of a “representative agent”, the law of diminishing returns, etc.
Having constructed the “standard” theory, the paper finds that the theory does not fit the real world, where capital flows from the poor to rich countries rather than vice versa. Capital flows from China to the United States provides a salient example though the phenomenon is more pervasive. As the “standard” theory does not fit the real world, the study labels the real world phenomenon “a puzzle”.
In contrast, in other disciplines, especially the natural sciences and engineering, the process of building theories proceeds in the following direction:
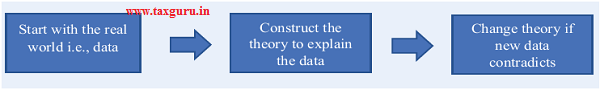
If we adopt this discipline, the phenomenon studied in Lucas (1990) may not be a puzzle. Consider a business that becomes extremely productive and is able to produce goods at very low prices, thereby capturing large market share and generating huge profits. The profits are usually ploughed back into the business to fund further investment. But suppose the profits are so large that even after reinvesting the entire amount required for funding new projects, the business is still left with a surplus. What would the business do? Invest this excess surplus in “other assets.” For instance, the business may invest in other firms. This is what China is doing. Why is it a puzzle then?
Another prominent example of “standard” theory is the use of the dynamic stochastic general equilibrium (DSGE) model in macroeconomics. Despite the large literature in this area, which posited DSGE models of enormous varieties, the pre-crisis models assumed the financial sector as a side-show. Therefore, any problems arising from potential misallocations within the financial sector were absent from the DGSE models. This is especially relevant in the Indian context given the recent experience of distress in the banking sector and the overhang that it created on the economy.
While a growing literature has since fixed the problem in DGSE models, such ex post facto fixing may not be adequate as some other critical element omitted from the current models will have to wait for next crisis to uncover. This ex post fixing stems from the insistence on using the “standard” theory to understand real world phenomeona. The adapting of DGSE models to the Indian reality is critical because the financial sector in India differs significantly from those in the Anglo-Saxon countries.
The case of Lucas (1990) and the over-reliance on DGSE models are but two examples that highlight the need for evolving macroeconomic thinking that fits the institutional differences in a country like India vis-à-vis the Anglo-Saxon economies.
NAVIGATING A WORLD OF CONSTANT DIS-EQUILIBRIUM
1.34 An economy that is in a constant state of dis-equilibrium needs a new approach to navigate. The earlier attempt to create five-year plans, largely using the equilibrium framework, failed because it was too prescriptive for an inherently unpredictable world. Therefore, navigating this uncertain world of dis-equilibrium requires three elements : (i) a clear vision; (ii) a general strategy to achieve the vision; and (iii) the flexibility and willingness to continously recalibrate tactics in response to unanticipated situations. In earlier sections, we have described a broad strategy to achieve the vision of a US$5 trillion economy. We now turn to some of the tactics. Figure
Figure 12: Tools for navigating the economy in a constant state of disequilibrium
Source: Adapted from NEAC, OECD
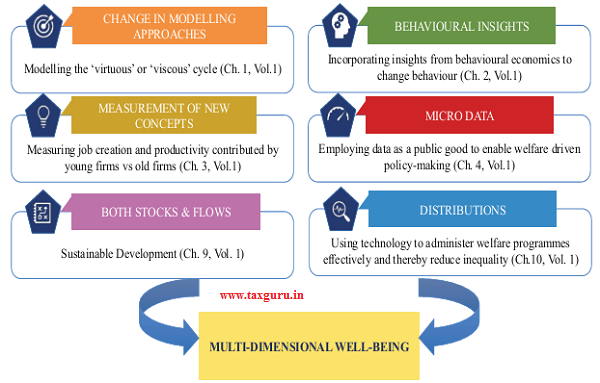
12 below shows the approach advocated by NEAC, OECD to navigate this world. Apart from the need to model the different elements of the economy simultaneously in an integrated manner, this approach critically requires assimilation of several other tools. Several chapters in Volume 1 of The Survey lay out the policy details for navigating this world. This chapter lays out the framework for integrated modelling of the various economic phenomena. Chapter 2 in Volume 1 delves deep into utilising the insights from behavioural economics for behaviour change that can thereby foster productivity and economic growth. Chapter 3 in Volume 1 pursues the measurement of new concepts by examining the impact of young versus old firms in fostering job creation and enhancing productivity. Chapter 10 in Volume 1 studies how the benefits of technology can be applied to enhance the efficacy of welfare programmes and thereby generate better distributional outcomes in the Indian society. Chapter 4 in Volume 1 describes the use of data as a public good for enhancing welfare. Chapter 9 focuses on the use of energy for sustainable development of the Indian economy.
Behavioural economics
1.35 As policymaking must keep real people as its focus, rather than the optimization-focused robots that conventional economics assumes, the insights from behavioural economics need to be integrated into policymaking to foster productivity and economic growth. Chapter 2 of the Survey, therefore, delves deep into this subject. By analysing the successful behavioural change effected by the Swachh Bharat Mission and the Beti Bachao, Beti Padhao campaigns, the chapter incorporates their learning and lays out frameworks for integrating behavioural economics into policymaking in various contexts:
(i) The Beti Bachao, Beti Padhao campaign has helped in improving child sex ratios, particularly in large states where the child sex ratio was poor. Therefore, the campaign has had the maximum impact in states that plausibly also needed the greatest pivot in their social norms. Taking the learning from this campaign, the chapter attempts to further the cause of Gender equality by coining the slogan of BADLAV (Beti Aapki Dhan Lakshmi Aur Vijay-lakshmi) to inter alia enhance contribution of women in the workforce and the economy;
(ii) The Swachh Bharat Mission has helped increase the percentage of villages that are Open Defecation Free and has enhanced access and usage of toilets. This improvement in sanitation has helped improve health outcomes as is seen in the number of malaria and diarrhoea cases and the number of still births and children with low birth weight. Incorporating the learning from this successful behavioural change, the chapter develops the framework to use behavioural insights for a healthy India. The framework embeds the idea of taking off from the Swachh Bharat Mission into “Swasth + Ayushman = Sundar” Bharat. This would enhance labour productivity and enhance savings, and thereby investment;
(iii) The creation of the Insolvency and Bankruptcy (IBC) process has helped bring a large number of non-performing assets into the IBC process. Further, the threat created of losing control under IBC is helping change the credit culture in the country. Insights from behavioural economics can be utilised to enhance the credit culture, especially with respect to frauds and wilful defaults, by drawing on the social and cultural norm of the “doctrine of pious obligation.” This, in turn, will foster credit growth and investment.
(iv) Several changes brought through the use of technology in tax administration have decreased manual intervention in tax administration, and have thereby improved the experience of a large majority of taxpayers. Behavioural insights can be leveraged to transform the tax culture from one of tax evasion to tax compliance. This would then provide the necessary revenues for investments in both the hard infrastructure of roads, ports, railways, etc. and the soft infrastructure of skills and education;
(v) The introduction of the GST represented a salient instance where policymakers exhibited the appetite to introduce bold reform by eschewing loss aversion, whereby a policy that creates some short-term losses while creating large long-term benefits may lack enough support (Milkman et al. 2012). Behavioural insights can build on the positive outcome of enacting such a path-breaking policy change to reduce loss aversion and thereby improve policy and legislative outcomes.
1.36 Figure 13 below summarises the seven principles of behavioural economics that can be applied to achieve the above outcomes. Chapter 2 of the Survey explicitly lays out applications in each of these areas.
Data as a public good
“Cross the river by feeling the stones.”
– Deng Xiaoping
1.37 Having set out the broad strategy for achieving the goal of a US$5 trillion economy, continuous re-calibration of policies to achieve this goal is necessary. Data-driven evidence enables this re-calibration. Deng Xiaoping’s exhortation to “cross the river by feeling the stones” is relevant in this context. If the economy in constant disequilibrium represents the flowing river, then data-driven policy making represents the process of feeling the stones for necessary re-calibration.
1.38 Chapter 4 in Volume 1 of the Survey
Figure 13: Principles of behavioural economics to foster behavioural change
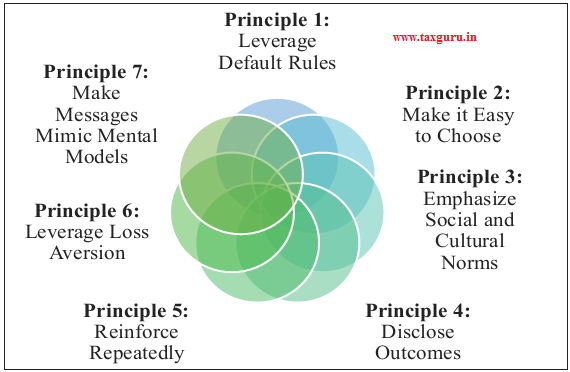
lays out the framework for creating data “of the people, by the people, for the people.” The chapter surmises that society’s optimal consumption of data is higher than ever before because of the exponential decline in the marginal cost of data combined with the manifold increase in its marginal benefits to society. While private sector does a good job of harnessing data where it is profitable, government intervention is needed in social sectors of the country where private investment in data remains inadequate. Governments already hold a rich repository of administrative, survey, institutional and transactions data about citizens. However, these data are scattered across numerous government bodies. Utilising the information embedded in these distinct datasets would inter alia enable government to enhance ease of living for citizens, enable truly evidence-based policy, improve targeting in welfare schemes, uncover unmet needs, integrate fragmented markets, bring greater accountability in public services, generate greater citizen participation in governance, etc. Given that sophisticated technologies already exist to protect privacy and share confidential information, governments can create data as a public good within the legal
framework of data privacy.
Legal Systems and Contract Enforcement
1.39 The economic model described in the blueprint is explicitly about creating virtuous cycles in an evolving, complex landscape. It is about investment, risk-taking and innovation in an environment that is inherently uncertain and unpredictable due to a range of factors from changing technology and consumer preferences to geopolitics and economic cycles. This is a world of “butterfly effects” and unintended consequences, where uncertainty is inevitable. As uncertainty exacerbates the temptation to renege on contracts when the ex post outcome is different from the one expected ex ante, the ability to enforce contracts and the rule of law become critical to navigating an uncertain world (Acharya and Subramanian, 2009; Acharya, Baghai and Subramanian, 2013, 2014; Chava et al., 2013; Sapra, Subramanian and Subramanian, 2013; Subramanian and Tung, 2016; Subramanian and Megginson, 2018). While a well-functioning legal system is important to economies in all situations, itis absolutely central to one that aims to drive economic growth through high investment rates in an unpredictable world.
1.40 The importance of the legal system and contract enforcement are repeatedly emphasized by ancient Indian economic thinkers such as Kautilya and Kamandak. They saw the Rule of Law as key to averting Matsya-nyaya or Law of the Fish (i.e., law of the jungle). Nobel prize-winning Austrian economist Friedrich von Hayek echoed the same sentiment in his famous book ‘The Road to Serfdom’:
“Nothing distinguished more clearly conditions in a free country from those in a country under arbitrary government than the observance in the former of the great principles known as the Rule of Law”.
1.41 Unfortunately, India’s legal system, burdened by 3.5 crore pending cases, is arguably now the single biggest constraint to doing business in India and thereby fostering investment. The World Bank’s latest Ease of Doing Business Report ranked India at 163 for contract enforcement. Experience shows that every other field of economic reform, be it property rights, taxes and insolvency, eventually flounders because it gets entangled in the legal system. This is why the legal sector reforms must be a top priority.
1.42 The good news is that the problem is not insurmountable. A scenario analysis of the effort needed to clear the backlog in five years suggests that significant efficiency gains are also necessary. At sanctioned strength, productivity will need to increase by 24.5 per cent, 4.3 per cent and 18 per cent for lower courts, High Court and Supreme Court respectively. The use of technology, increase in working days and administrative/ process reforms can enable these ambitious yet achievable efficiency gains. Given the potential economic and social multipliers of a well-functioning legal system, strengthening the legal system may be the best investment Indian reformers can make.
Consistency in Economic Policymaking
1.43 In the world of constant uncertainty, economic policymaking can either alleviate the uncertainty faced by investors or exacerbate it. The earlier attempt to create five-year plans, largely using the equilibrium framework, aimed to solve this problem. However, as we discovered to our dismay, the best-laid plans can get unravelled in an uncertain world that is in perpetual dis-equilibrium. Therefore, navigating this uncertain world of dis-equilibrium requires three elements: (i) a clear vision; (ii) a general strategy to achieve the vision; and (iii) the flexibility and willingness to continuously recalibrate tactics in response to unanticipated situations. Having taken the Prime Minister’s vision of a US$5 trillion economy, this Economic Survey lays out a general blueprint as the strategy to achieve this vision. However, as discussed above, policies must respond continually to the flow of real-time data.
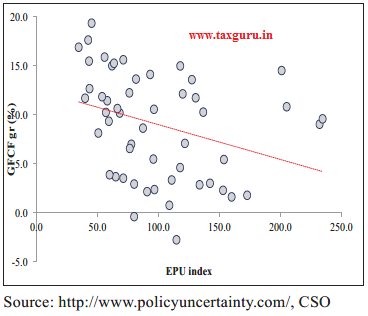
1.44 The obvious problem from having such tactical flexibility is that it creates its own uncertainty. This is particularly the case when major reforms are being carried out. In this context, in Chapter 6 of Volume 1 of the Survey, we examine how economic policy uncertainty has evolved in India over the last few years. More importantly, given our emphasis on investment as the key driver of the virtuous cycle, we examine the relationship of economic policy uncertainty with investment. To capture economic policy uncertainty, we use the Baker et al. (2016) index, which has been used widely across the world. We find that while this uncertainty was higher during episodes of greater uncertainty such as the taper tantrum in 2013, overall economic policy uncertainty has significantly decreased over the last decade (Figure 14). A noteworthy feature of this Figure is that
Figure 14: Economic policy uncertainty in India (2011-2019)
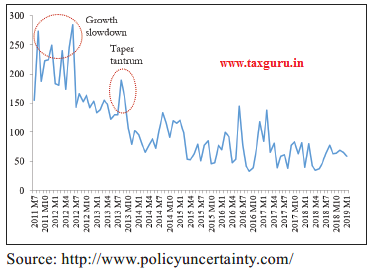
the introduction of GST barely increased the economic policy uncertainty despite the enormous change that it entailed. This illustrates that path-breaking reforms that are consistent with a well-articulated vision do not create as much disruption as some people may fear. The continued decrease in economic policy uncertainty in India post 2015 is as exceptional because it contrasts sharply with the increase in economic policy uncertainty in major countries during this period, including the U.S.
1.45 Surges in economic policy uncertainty increase the systematic risk, and thereby the cost of capital in the economy. As a result, higher economic policy uncertainty lowers investment, especially because of the irreversibility of investment. Consistent with this thesis, we find that an increase in economic policy uncertainty dampens investment growth in India (Figure 15). The impulse-response function suggests that an increase in economic policy uncertainty affects growth in investment for about five quarters.
1.46 This effect of economic policy uncertainty, therefore, provides important policy implications for managing an economy in constant disequilibrium. First, the predictability of policy stems from being consistent with the overall vision and strategy
Figure 15: Investment growth and economic policy uncertainty index
 rather than from tactical inflexibility. Second, “what gets measured gets acted upon”. So, economic policy uncertainty index must be tracked at the highest level on a quarterly basis. Finally, quality assurance of processes in policymaking must be implemented in government via international quality certifications.
MAJOR FACTORS, REFORMS AND RISKS
Role of demographics in the “virtuous cycle”
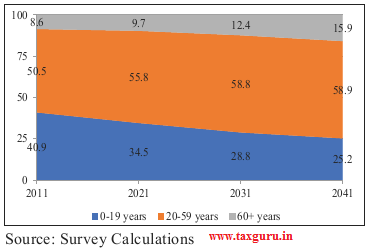
1.47 As we shall discuss in Chapter 7 in Volume 1 of the Survey, India has already entered this demographic phase of a high share of working age population, and will remain in this “demographic dividend” zone for over two decades. Figure 16, in fact, highlights that the working age population (20-59 years), which comprised 50.5 per cent of the overall population in 2011, will increase to about 60 per cent in 2041.
1.48 Change in demographics, especially in the age structure of the population, has been shown to have had a significant effect on economic growth throughout Asia between 1960 and 1990 (Bloom and Williamson, 1998). A rise in the share of the working-age
Figure 16: Demographic composition in India (2011-2041)
population, brought about by a decline in the fertility rate, increases income per capita as output per worker remains unchanged but the number of youth dependents declines. The rise in the working-age share in Asia created this accounting effect, but it also brought with it behavioural changes. Savings increased as life expectancy increased (Lee, Mason and Miller 2000; Bloom, Canning, Mansfield and Moore 2007), and consequently investment increased. In fact, changes in growth of labour force per capita, changes in the savings rate, and changes in the investment rate are three plausible mechanisms by which demographics affects the economic growth (Higgins and Williamson, 1997; Bloom and Williamson, 1998).
1.49 Figure 17 shows how savings rate in China and other high-growth East Asian economies was driven significantly by change in its demographics from a predominantly young to an older population. While the top panels show the change in the demographics,
Figure 17: Impact of demographics on savings for China and other High-growth East Asian Economies
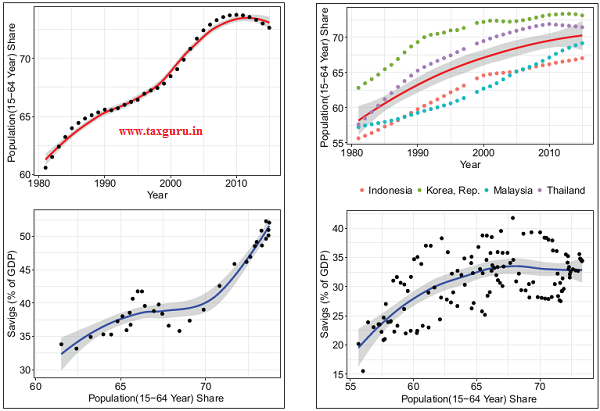
Source: World Bank
Note: Time period taken is 1980-2015 and High Growth Economies pertain to Indonesia, Malaysia, South Korea and Thailand.
the bottom panels illustrate how closely the household saving rate and the working age proportion of the population move together in China and other high-growth East Asian economies. This makes sense because only people who are earning income can save, and the majority of income for the majority of people will be labour income. But, in addition to this effect of demographic composition, having fewer “mouths to feed” raises the availability of resources that can be saved for the future. Second, due to the importance of children as a source of retirement income in the Asian/Indian context, the decline in the number of children by the working generation promotes saving as they must rely more on savings for retirement in comparison to previous generations. Finally, saving also increases as a result of a composition effect: a large portion of saving tends to occur between the ages of 40 to 65 as people start to save for retirement.
1.50 As Bosworth and Chowdorow-Reich (2007) show for Asia, both savings and investment rise with the proportion of the working population (Figure 18). Notice that this figure shows the coefficient of the effect of proportion of each age group in the population on investment and savings. A positive coefficient indicates that the effect
Figure 18: Impact of composition of demographics on savings in Asia
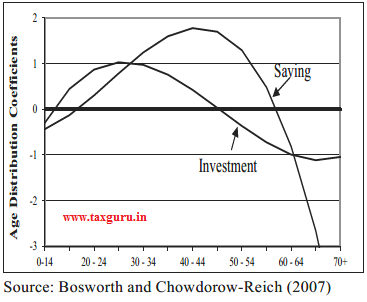
of the age group is to increase savings/ investment while a negative coefficient indicates that this effect decreases savings/ investment. Investment rises significantly with an increase in each of the age cohorts till age 50 while savings rises significantly with an increase in each of the age cohorts till age 60.
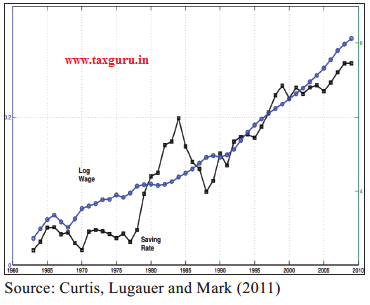
1.51 Figure 19 shows how wages affected China’s savings rate. This relationship is crucial to note because without an increase in the earnings of the working population, neither consumption nor savings can increase. Therefore, jobs that pay meaningful wages become crucial in driving savings rate in the economy. The “virtuous cycle” that we describe fosters job creation by exploiting the complementarity between capital and labour, on the one hand, and by increase overall productivity and labour productivity, on the other hand. Policy changes to enhance productivity and job creation in the economy, which we describe in Section 5.2, become crucial in this context.
1.52 Our analysis, thus, shows that savings is driven primarily by demographics and income growth. Therefore, keeping domestic interest rates high may not encourage savings behaviour; a mildly positive real rate is good
Figure 19: Impact of wages on savings in China (1963-2009)
enough. As demographics and wages are the major factors that drive savings, policymakers obtain a key degree of freedom. Specifically, the two parts of the financial system, the savers and the borrowers, can be disentangled. As investment depends crucially on a low cost of capital, reducing real interest rates need not necessarily lower savings when the demographics are favourable. At the same time, the reduction in real interest rates can foster investment and thereby set in motion the virtuous cycle of investment, growth, exports and jobs.
Role of job creation and earnings
1.53 Chapter 3 in Volume 1 of the Survey recognises a startling fact. Dwarfs, which we define as small firms that never grow beyond their small size, dominates the Indian economy and holds back job creation and productivity. Firms employing less than 100 workers are categorized as small and firms employing 100 or more workers as relatively large. Though a firm employing 100 workers is definitely not large in the global context, they are relatively large in the Indian context. Firms that are both small and older than ten years are categorized as dwarfs as these firms have continued to be stunted in their growth despite surviving for more than 10 years.5
1.54 Figure 20 shows the share of dwarfs in the number of firms, the share in employment
Figure 20: Share of dwarfs versus other firms in number, employment and productivity
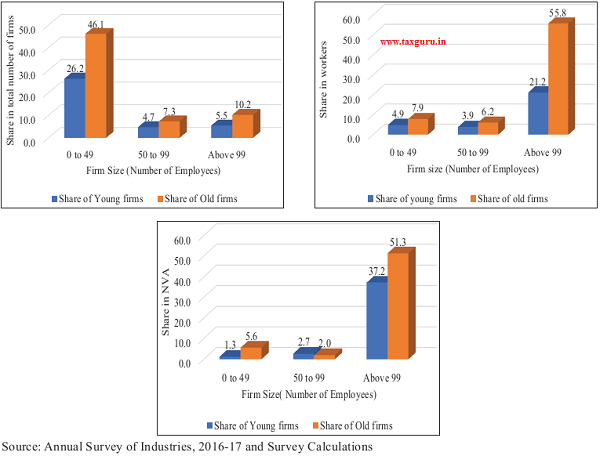
and their share in Net Value Added (NVA). This analysis has been conducted using firm-level data from the Annual Survey of Industries for the year 2016-17, which is the latest available. While dwarfs account for half of all the firms in organized manufacturing by number, their share in employment is only 13.3%. In fact, their share in NVA is a miniscule 4.7% despite them dominating half the economic landscape. In contrast, young, large firms (firms that have more than 100 employees and are not more than 10 years old) account for only 6.2% of firms by number but contribute a quarter of the employment and 38% of the NVA. Large, but old firms (firms that have more than 100 employees and are more than 10 years old) account for only 9.5% of firms by number but contribute half of the employment as well as the NVA. Thus, firms that are able to grow over time to become large are the biggest contributors to employment and productivity in the economy. In contrast, dwarfs that remain small despite becoming older remain the lowest contributors to employment and productivity in the economy.
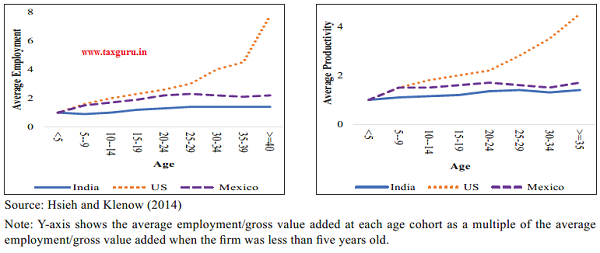
1.55 As a cross-country comparison, the Chapter shows that an average firm in the U.S. employs more than seven times as many workers when it is 40 years of age when compared to the average workers it employed when it was less than five years of age. An average firm in Mexico doubles its employment when it is forty years of age when compared to the workers it employed when it was less than five years of age. In contrast, an average firm in India only employs 40% more workers when it is forty years of age when compared to the workers it employed when it was less than five years of age. Thus, firms in India do not grow enough to create the necessary jobs and productivity in the economy (Figure 21).
1.56 Chapter 3 of the Survey then highlights that restrictive labour regulations, which exempt small firms from such regulations, and other size based incentives, which provide benefits to MSMEs irrespective of their age, have played a crucial role in providing perverse incentives for firms to remain significantly smaller in the Indian economic landscape. The Chapter, therefore, recommends focusing incentives on infant firms, i.e. firms less than ten years of age, with the appropriate grandfathering of the existing pattern of incentives to MSMEs. Further, the Chapter highlights using the labour law changes in Rajasthan that reforms of restrictive labour regulation can foster job creation and capital accumulation in the
Figure 21: Growth of jobs and productivity with age for firms in India, Mexico and U.S.
states. The labour law changes are crucial also because they can enhance investment (Subramanian and Tung, 2016; Subramanian and Megginson, 2018).
The role of the financial sector
1.57 The investment-led growth model implies a rapid expansion in the financial system by a factor of magnitude – both banks and capital markets. In turn, this runs up the risk that such a rapid expansion could be disrupted by a major financial crisis that derails the savings-investment dynamic. This is no idle concern as illustrated by the Asian Crisis of 1997-98. Some South-East Asian countries appeared to be recreating the East Asian miracle in the nineties, but were unable to sustain the virtuous cycle because of large scale misallocation of capital. Our own experience of rapid credit expansion from 2006 to 2012 illustrates the same risk, where the quality of credit sharply deteriorated when the quantity was expanded. In this context, recent efforts to clean up the banks and establish a bankruptcy process should be seen as valuable investment that must be completed. If India had attempted to press the accelerator five years ago, it would have almost certainly been hit by a major financial crisis in a few years. Painful as it may have seemed, the banking sector clean up and the IBC framework are important foundations that will now reap benefits when the investment-driven growth model is put into motion as the incentives get aligned towards better quality lending (Sarkar, Subramanian and Tantri, 2019).
1.58 Now that the foundations for expansion have been laid, it is now time to significantly lower the cost of capital. Figure 22 shows how the real rate of interest has increased significantly in India over the years. In fact, a cross-country comparison shows that the cost of capital remains quite high in India (see Figure 23), which affects investment prospects in the country.
The risk-return trade-off in the economy
1.59 Another aspect that constrains the savings-investment driven model for growth, jobs and exports pertains to the incentive structure prevailing for risk-taking in the
Figure 22: Real rates of interest (Jan 2012 – May 2019)
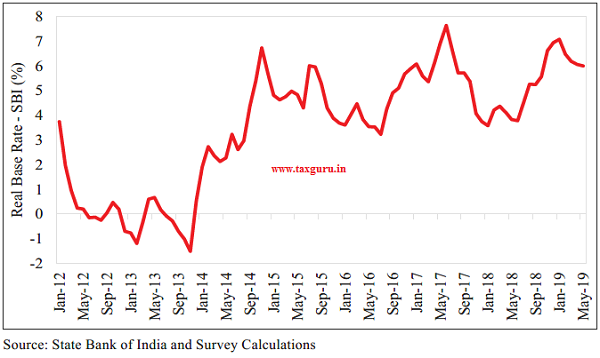
Figure 23: Cross-country comparison of Cost of Capital across some sectors
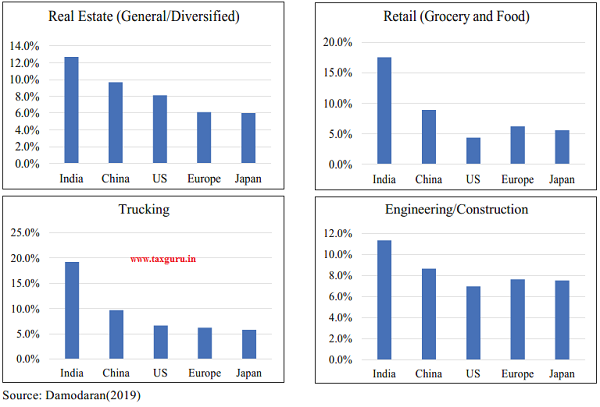
economy. The following aspects of the risk-return trade-off need attention.
1.60 As investment represents a forward-looking activity, investors eventually make their decisions to invest based on the risk-adjusted return they expect. In other words, if two projects offer the same return but one of them is riskier, then investors choose the less risky project to invest. Therefore, systematically lowering the risks faced by investors in India is critical for the success of the investment-driven model for economic growth. Risk pertains to the possibilities of upside, when a project performs well, and downside, when the project fails. So, the implementation of the IBC is crucial in this regard as it puts into process a framework for reconfiguration of assets following business failure. However, the after-tax return for successful projects crucially affects the risk-return trade-off and thereby becomes critical to foster investment.
1.61 Optimal tax policy plays a crucial role in this regard. Countries across the world recognise the need to evolve tax system that can foster innovation. Therefore, tax policy and its implementation for start-ups must be rationalised to foster innovative investments in the Indian economy. Several studies have also suggested that capital gains tax can have significant economic consequences for individual investors in terms of its lock-in effects and associated deterring incentives to use capital gains into riskier investments (Meade, 1990). Design of optimal tax policy also aims to raise revenue efficiently and fairly, while encouraging the bonafide taxpayers and punishing the malafide ones. However, achieving this optimality is not an easy task. Therefore, to foster investment, getting this balance right is extremely critical in the Indian context.
1.62 Growth in the new economy cannot be fostered without an ecosystem that rewards innovation and entrepreneurship (Acharya and Subramanian, 2009; Acharya, Baghai and Subramanian, 2013, 2014; Chava et al., 2013; Sapra, Subramanian and Subramanian, 2013). Startups and innovative ventures face significantly greater uncertainty than traditional “brick-and-mortar” firms. Yet, policy ambiguities that create collateral damage for genuine risk-takers can affect investments by dampening the animal spirits in the economy.
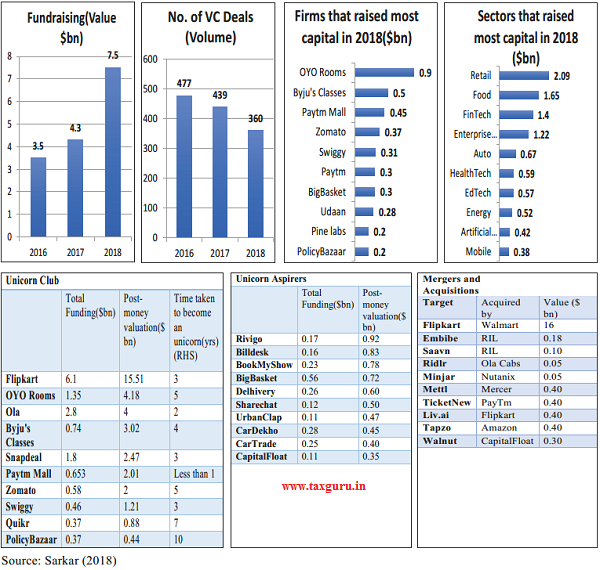
1.63 Ranked third in the world in the start-up ecosystem, a growing number of domestic Indian enterprises are developing solutions aimed at managing and solving urban challenges. While a majority of these are tech-start-ups concerned with e-commerce and consumer products and services, 2018 was touted as the year of food start-ups. Figure 24 shows statistics that depict the vibrant start-up ecosystem that has developed in India. B2C start-ups concerned with easing public service delivery and driving efficiencies, whether in waste, water or energy, are slowly
Figure 24: Trends in India’s start-ups (2018)
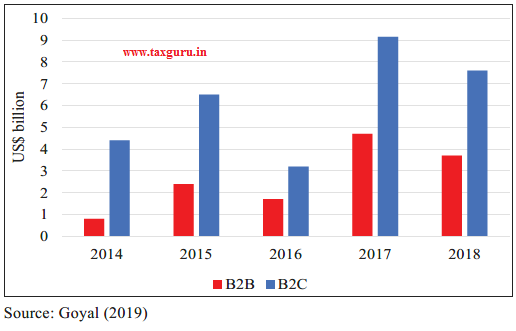
but surely emerging. Figure 25 highlights this fact as private investment into B2C start-ups is much higher than that into B2B start-ups.
1.64 Continuing the creation of an ecosystem for private investment, especially in the new economy, is therefore critical to enable the virtuous cycle of investment, demand, exports, growth and jobs.
Figure 25: Funding in B2C startups higher than in B2B startups
CHAPTER AT A GLANCE
> During the last five years, India’s economy has performed well. By opening up several pathways for trickle-down, the government has ensured that the benefits of growth and macroeconomic stability reach the bottom of the pyramid.
> To achieve the objective of becoming a US$5 trillion economy by 2024-25, India needs to sustain a real GDP growth rate of 8%. International experience, especially from high-growth East Asian economies, suggests that such growth can only be sustained by a “virtuous cycle” of savings, investment and exports catalysed and supported by a favourable demographic phase. Investment, especially private investment, is the “key driver” that drives demand, creates capacity, increases labour productivity, introduces new technology, allows creative destruction and generates jobs.
> Exports must form an integral part of the growth model because higher savings preclude domestic consumption as the driver of final demand. Similarly, job creation is driven by this virtuous cycle. While the claim is often made that investment displaces jobs, this remains true only when viewed within the silo of a specific activity. When examined across the entire value chain, capital investment fosters job creation as production of capital goods, research & development and supply chains generate jobs.
> In postulating the above growth model, the Survey departs from traditional Anglo-Saxon thinking by viewing the economy as being either in a virtuous or a vicious cycle, and thus never in equilibrium.
> By presenting data as a public good, emphasizing legal reform, ensuring policy consistency, and encouraging behaviour change using principles of behavioural economics, the Survey aims to enable a self-sustaining virtuous cycle. Key ingredients include a focus on policies that nourish MSMEs to create more jobs and become more productive, reduce the cost of capital, and rationalise the risk-return trade-off for investments.
REFERENCES
Acharya, Viral V. and Krishnamurthy V. Subramanian. 2009. “Bankruptcy Codes and Innovation,” The Review of Financial Studies, 22(12), 4949-4988.
Acharya, Viral, Ramin, Baghai and Krishnamurthy V. Subramanian. 2013. “Labor Laws and Innovation,” Journal of Law and Economics, 56(4), 997-1037.
Acharya, Viral, Ramin, Baghai and Krishnamurthy V. Subramanian. 2014. “Wrongful Discharge Laws and Innovation,” The Review of Financial Studies, 27(1).
Attanasio, Orazio P., Lucio Picci, and Antonello E. Scorcu, 2000. “Saving, Growth, and Investment: A Macroeconomic Analysis Using a Panel of Countries,” The Review of Economics and Statistics 82(2):182-211.
Baker, Scott R., Nicholas Bloom, and Steven 2016. “Measuring Economic Policy Uncertainty.” The Quarterly Journal of Economics 131(4): 1593–1636.
Bloom, David E., and Jeffrey G. Williamson.1998. “Demographic Transitions and Economic Miracles in Emerging Asia.” The World Bank Economic Review 12(3): 419–455.
Bloom, David E., David Canning, Richard Mansfield, and Michael Moore. 2007. “Demographic change, social security systems, and savings.” Journal of Monetary Economics 54(1): 92-114.
Bosworth, Barry, and Gabriel Chodorow-Reich. 2007. “Saving and Demographic Change: The Global Dimension.” SSRN. https://ssrn.com/abstract=1299702.
Carroll, Christopher D., and David N., Weil. 1994. “Saving and growth: a reinterpretation.” Carnegie-Rochester Conference Series on Public Policy 40(1): 133-192.
Chakrabarti, Rajesh, Krishnamurthy V. Subramanian and Sesha Meka. 2017. “Localization of FDI flows: Evidence on Infrastructure as a critical determinant of FDI,” Journal of Law, Finance and Accounting, 2(1), 205-246.
Chava, S., Alexander Oettl, Ajay Subramanian and Krishnamurthy V. Subramanian. 2013. “Banking Deregulation and Innovation,” Journal of Financial Economics, 109(3), 759-774.
Curtis, Chadwick C., Steven Lugauer, and Nelson C. Mark. 2011. “Demographic Patterns and Household Saving in China.” American Economic Journal: Macroeconomics 7(2): 58-94.
Curtis, Chadwick C., Steven Lugauer, and Nelson C. Mark. 2017. “Demographics and aggregate household saving in Japan, China, and India.” Journal of Macroeconomics 51(C):175-191.
Damodaran, Aswath. 2019. “Data: Current.” Damodaran Online(blog), January 5. http:// pages.stern.nyu.edu/~ adamodar/New_ Home_Page/datacurrent.html.
European Commission. Effectiveness of tax incentives for venture capital and business angels to foster the investment of SMEs and start-ups. Brussels: European Commission, 2017. https://ec.europa.eu/taxation_customs/ sites/taxation/files/final_report_2017_taxud_ venture-capital_business-angels.pdf.
Feldstein, Martin, and Charles Horioka. 1980. “Domestic saving and international capital flows.” Economic Journal 90(358): 314-329.
Fu, Xiaolan, and V. N. Balasubramanyam. 2005. “Exports, foreign direct investment and employment: The case of China.” World Economy 28(4): 607-625.
Gourinchas, Pierre-Olivier, and Olivier Jeanne. 2013. “Capital Flows to Developing Countries: The Allocation Puzzle.” The Review of Economic Studies 80(4):1484-1515.
Goyal, Malini. 2019. “How the centre of gravity of India’s startup ecosystem is shifting towards B2B startups.” Economic Times, March 2019. https://economictimes. indiatimes.com/small-biz/startups/features/ how-the-centre-of-gravity-of-indias-startup-ecosystem-is-shifting-towards-b2b-startups/ articleshow/68235644.cms?from=mdr
Haskel, Jonathan E., Sonia C. Pereira, and Matthew J. Slaughter. 2007. “Does inward foreign direct investment boost the productivity of domestic firms?” The Review of economics and statistics 89(3): 482-496.
Hayek, Friedrich August von. 1974. “The Pretence of Knowledge.” Prize Lecture, The Sveriges Riksbank Prize in Economic Sciences in Memory of Alfred Nobel. https:// www.nobelprize.org/prizes/economic-sciences/1974/hayek/lecture/.
Higgins Matthew, and Jeffrey .G. Williamson. 1997. “Age structure dynamics in Asia and dependence on foreign capital.” Population and Development Review 23 (2): 261-293.
Hsieh, Chang-Tai, and Peter J. Klenow. 2014. “The Life Cycle of Plants in India and Mexico.” The Quarterly Journal of Economics 129(3): 1035–1084.
Jin, Keyu. 2012. “Industrial Structure and Capital Flows.” American Economic Review 102 (5), 2111–46.
Lee, Ronald, Andrew Mason, and Tim Miller. 2000. “Life Cycle Saving and the Demographic Transition: The Case of Taiwan.” Population and Development Review 26: 194-219.
Lin, Jeffrey. 2011. “Technological Adaptation, Cities, and New Work.” Review of Economics and Statistics 93(2): 554–74.
Lucas, Robert. E. Jr. 1990. “Why doesn’t capital flow from rich to poor countries?” American Economic Review 80(2): 92–96.
Meade, Janet A. 1990. “The Impact of Different Capital Gains Tax Regimes on the Lock-In Effect and New Risky Investment Decisions.” The Accounting Review 65(2): 406-431.
Milkman, Katherine L., Mary Carol Mazza, Lisa L. Shu, Chia-Jung Tsay, and Max H. Bazerman. 2012. “Policy Bundling to Overcome Loss Aversion: A Method for Improving Legislative Outcomes.” Organizational Behavior and Human Decision Processes 117(1): 158-167.
Perotti, Enrico C., Laixiang Sun, and Liang Zou. 1999. “State-Owned versus Township and Village Enterprises in China.” Comparitive Economic Studies 41:1-20.
Ramos, Gabriela. 2017. “We need an empowering narrative.” OECD Insights (blog), June 23. http://oecdinsights. org/20 17/06/23/we-need-an-empowering-narrative/.
Rodrik, Dani. 2000. “Savings Transitions.” World Bank Economic Review 14(3): 481-507.
Rodrik, Dani. 2018. “Second thoughts on economics rules.” Journal of Economic Methodology 25(3): 1-6.
Romer, Paul. 2015. “Mathiness in the theory of economic growth.” American Economic Review 105(5):89-93.
Sandri, Damiano. 2014. “Growth and capital flows with risky entrepreneurship.” American Economic Journal: Macroeconomics 6(3): 102-123.
Sapra, H., Ajay Subramanian and Krishnamurthy V. Subramanian. 2014. “Corporate Governance and Innovation: Theory and Evidence,” Journal of Financial and Quantitative Analysis, 49(4), 957 – 1003.
Sarkar, Ranju. 2018. “With record capital raising, 2018 was year of transformation for start-ups.” Business Standard, December 2018. https://www.business-standard.com/ article/companies/with-record-capital-raising-2018-was-year-of-transformation-for-start-ups-118122900674_1.html.
Sarkar, A., Krishnamurthy V. Subramanian and Prasanna Tantri. 2019. “Effects of CEO Turnover in Banks: Evidence Using Exogenous Turnovers in Indian Banks,” Journal of Financial and Quantitative Analysis, 54(1), 183-214.
Subramanian, Krishnamurthy V. 2011. Lessons from the financial crisis: failure of markets or failure of regulation? Macroeconomics and Finance in Emerging Market Economies, 4(2).
Subramanian, Krishnamurthy V. and William Megginson, 2018. “Employment Protection Laws and Privatization,” Journal of Law and Economics, 61(1), 97-123.
Subramanian, Krishnamurthy V. and Frederick Tung, 2016. “Law and Project Finance,” Journal of Financial Intermediation, 25(1), 154-177.
Wei, Yingqi, and V. N. Balasubramanyam. 2015. “A Comparative Analysis of China and India’s Manufacturing Sectors.” Economics Working Paper Series 2015/003. Lancaster University Management School. https://www. lancaster.ac.uk/media/lancaster-university/ contentassets/documents/lums/economics/ working-papers/LancasterWP2015_003.pdf.
Note :
1. Among the different modelling possibilities, assume a 0.7% increase in total factor productivity in India when compared to the U.S. and a constant real effective exchange rate. This then translates into an exchange rate of INR 75 per USD in March 2025, which implies that the Indian economy must have a nominal GDP of 375 lakh crores in March 2025. An 8% real growth rate for GDP combined with 4% inflation would deliver this nominal GDP. While the export growth required to deliver the 8% real GDP growth rate may require a depreciation of the real effective exchange rate, we emphasize export growth stemming from increases in productivity rather than currency depreciation.
2 Instead of examining the relationship between log of investment and log of GDP per capita, which would not capture the non-linearities embedded in a virtuous cycle, we examine the relationship between the share of investment in GDP to log of GDP per capita so that the change in this share with a change in GDP per capita can be examined. A similar rationale applies for the use of shares of exports and savings to GDP on the y-axis.
3 Though there is an exponential increase and then a dip post the year 2000 in the export to GDP ratio for China, the overall linear trend is still increasing.
4 The success story of Town and Village Enterprises (TVEs) in China becoming the engines of its spectacular growth shows how labour-intensive manufacturing investment can simultaneously boost productivity, job creation and exports (Wei and Balasubramanyam, 2015). While in 1980, there were about 1.4 million TVEs with 30 million employees, by 1996, there were 23.4 million TVEs with 135 million workers contributing nearly 30% of China’s GDP and 50% of the industrial output (Perotti et al., 1999). By 1999, TVE exports accounted for 48% of China’s total exports and much of these were labourintensive products involving simple production techniques (Fu and Balasubramanyam, 2005)
5 Disclaimer: The Survey uses the term “dwarfs” for firms that remain small despite being old is contrasted to “infants” for firms that are small because they are young. This usage is purely for firms and has no correlation with such usage for individuals and is therefore not intended to harm any sensibilities, whatsoever.
Source- Economic Survey 2018-19 Volume 1


