– Thirukural, Chapter 76, verse 753.
Contextual translation: “The one who utilizes all resources and opportunities at hand is an efficient (entrepreneur) and nothing is impossible for him to achieve.”
The ‘Startup India’ campaign of the Government of India recognizes entrepreneurship as an increasingly important strategy to fuel productivity growth and wealth creation in India. Given this initative, this chapter examines the content and drivers of entrepreneurial activity at the bottom of the administrative pyramid – over 500 districts in India. The analysis employs comprehensive data on new firm creation in the formal sector across all these districts from the Ministry of Corporate Affairs (MCA)-21 database. First, using the World Bank’s Data on Entrepreneurship, this chapter confirms that India ranks third in number of new firms created. The same data shows that new firm creation has gone up dramatically in India since 2014. While the number of new firms in the formal sector grew at a compounded annual growth rate of 3.8 per cent from 2006-2014, the growth rate from 2014 to 2018 has been 12.2 per cent. As a result, from about 70,000 new firms created in 2014, the number has grown by about 80 per cent to about 1,24,000 new firms in 2018. Second, reflecting India’s new economic structure, i.e. comparative advantage in the Services sector, new firm creation in services is significantly higher than that in manufacturing, infrastructure or agriculture. Third, grassroots entrepreneurship is not just driven by necessity as a 10 percent increase in registration of new firms in a district yields a 1.8 percent increase in GDDP. Thus, entrepreneurship at the bottom of the administrative pyramid – a district – has a significant impact on wealth creation at the grassroot level. This impact of entrepreneurial activity on GDDP is maximal for the manufacturing and services sectors. Fourth, birth of new firms is very heterogeneous across Indian districts and across sectors. Moreover, it is dispersed across India and is not restricted to just a few cities. Fifth, literacy and education in the district foster local entrepreneurship significantly. For instance, the eastern part of India has the lowest literacy rate of about 59.6 per cent according to the census of 2011. This is also the region in which new firm formation is the lowest. In fact, the impact of literacy on entrepreneurship is most pronounced when it is above 70 per cent. Sixth, the level of local education and the quality of physical infrastructure in the district influence new firm creation significantly. Finally, policies that enable ease of doing business and flexible labour regulation enable new firm creation, especially in the manufacturing sector. As the manufacturing sector has the greatest potential to create jobs for our youth, enhancing ease of doing business and implementing flexible labour laws can create the maximum jobs in districts and thereby in the states. Literacy, education and physical infrastructure are the other policy levers that district and state administrations must focus on foster entrepreneurship and thereby job creation and wealth creation.
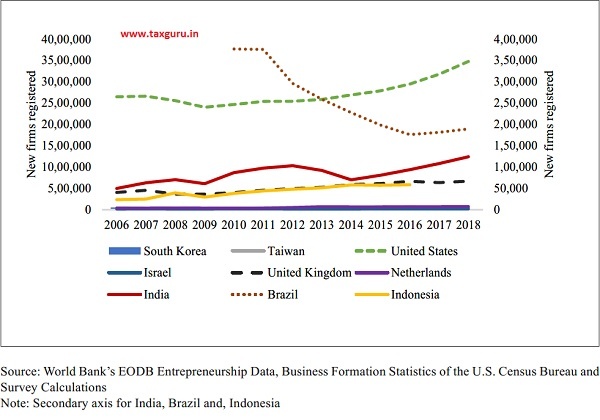
2.1 Entrepreneurship represents a key focus area for many policy makers given its role in economic development and subsequent employment growth. Entrepreneurs are seen as agents of change that accelerate innovation in the economy. Figure 1 uses the World Bank’s EODB Entrepreneurship data together with that from the U.S. Census Bureau to compare total number of new firms in India with that in a diverse cross-section of countries in Asia, Europe and North America. The chart clearly establishes that India has the 3rd largest entrepreneurship ecosystem in the world. Also, while the number of new firms in the formal sector grew at a cumulative annual growth rate of 3.8 per cent from 2006-2014, the growth rate from 2014 to 2018 has been 12.2 per cent. As a result, from about 70,000 new firms created in 2014, the number has grown by about 80 per cent to about 1,24,000 new firms in 2018.
Figure 1: Comparison of entrepreneurial activity (new firms) across countries
Box 1: Data and Methodolody
The sample is constructed at the intersection of three data sources. First, data is obtained on district-level GDP at current prices from the CEIC India Premium database. This data spans financial years ending 2000 through 2018. Therefore, there are 5,591 district-year observations comprising district-level GDP of 504 districts across 22 states in India.
Entrepreneurship is measured as the count of new firms in the Ministry of Corporate Affairs (MCA) – 21 database, a public dataset that provides a one-time snapshot of all active firms registered with the Ministry of Corporate Affairs (MCA) between 1990 and 2018. Each firm is then matched to a district using the registered office address of the firm in MCA-21.The implications of using these data are twofold. First, the measure of entrepreneurship is restricted to the private corporate sector in the formal economy and does not include establishments that are expansions by existing companies. Second, since this data is only a onetime snapshot of active firms registered with the MCA, at least one limitation imposed is that the firms that did not survive until 2018 cannot be tracked. This survivor bias in our data also implies that the estimates of the impact of entrepreneurship might be biased upward.
Third, data relating to the physical and social infrastructure of a district is accumulated from the Socioeconomic High-resolution Rural-Urban Geographic Dataset on India (SHRUG, available at http:// www.devdatalab.org/shrug_download/) which comprises of a set of variables that describe the extent of socio-economic development in India. Among other things, SHRUG contains variables that describe the demographic, socioeconomic, firm and political infrastructure of every district between 1990–2018 that it cumulates from a variety of data sources. These sources comprise data from the Census of India relating to the years 1991, 2001 and 2011, Socio-Economic Caste Census of 2012, and Pradhan Mantri Gram Sadak Yojana (PMGSY) public data to construct a variety of indices that describe the social and physical infrastructure of every district in India.
For cross-country comparison, we use the Entrepreneurship World Bank’s EODB Entrepreneurship Data for all countries except the U.S. and the Business Formation Statistics of the U.S. Census Bureau for the U.S.
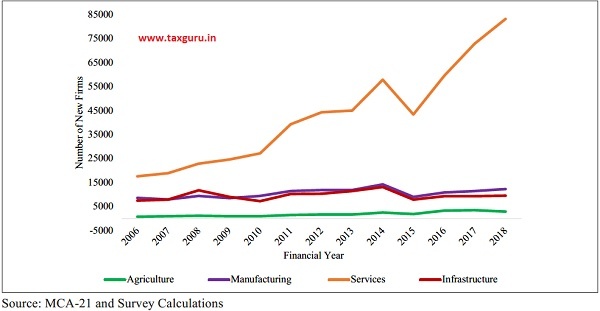
2.2 On a per-capita basis, India has low rates of entrepreneurship in the formal economy. Between 2006 and 2016, the mean (median) number of new firms registered per year per 1000 workers was 0.10 (0.11). In contrast, the mean (median) entrepreneurial intensity for the United Kingdom and the United States was 12.22 (11.84) and 12.12 (11.81) respectively. In general, the entrepreneurial intensity is significantly higher for the developed economies. It is also growing across all countries except Brazil, which has seen a significant decline from 2010 to 2018. It is important to note that in contrast to the other countries, a large number of India’s enterprises operate in the informal economy which is not captured in these data. Notwithstanding the relatively lower rates of entrepreneurial intensity, Figure 2a emphasizes significant growth in the birth of new firms over time. New firm creation has gone up dramatically since 2014 as discussed above. Figure 2b shows that this growth is particularly pronounced for the services sector. This fact reflects India’s new economic structure, i.e. comparative advantage in the Services sector.
ENTREPRENEURSHIP AND GDP
2.3 The entrepreneurial activity is related to economic growth. See Box 2 for details on estimation of this relationship.
2.4 Figure 3a presents the scatter plot and trend line for the regression of the natural log of Gross Domestic District Product (GDDP)
Figure 2a: Growth in new firms over time in India

Figure 2b: Growth in new firms over time in India
Box 2: Estimating the relationship between Entreprneeureship and GDP
To explore how district-level GDP varies by the number of new firms in the district, we implemented an OLS specification that regresses the district GDP (at current prices in natural log) on the number of new firms (once again in natural log) as the primary independent variable. Given our premise that infrastructural and environmental differences mainly vary by state, we also use 21 state fixed effects are used in addition to including 17 time dummies. To minimize the possibility that the number of new firms might be endogenous to district-level GDP, the number of new firms in a district is lagged by three years. In sum, we the following is estimated
In (District GDPit) = α+β (new firms i,t-3)+ Xi + ιt + ε it (1)
In (1) above, subscripts i and t, indexes a district and year respectively, Xi denotes state fixed effects and τt denotes year fixed effects. To ensure that the standard errors are not inflated we cluster our the errors at the district-level on the natural log of new firms established in the focal district 3 years back. It is clear that entrepreneurial activity has a significant positive impact on GDDP. Specifically, a 10 per cent increase in registration of new firms per district-year yields a 1.8 per cent increase in GDDP. The results emphasize the importance of entrepreneurship as an engine of economic growth and change in India. They further mute the view that entrepreneurial activity in emerging economies like India is largely necessity driven and typically borne from a lack of alternative employment options. Rather, the findings highlight the incidence of productive and growth-focused entrepreneurial activity in the formal sector in
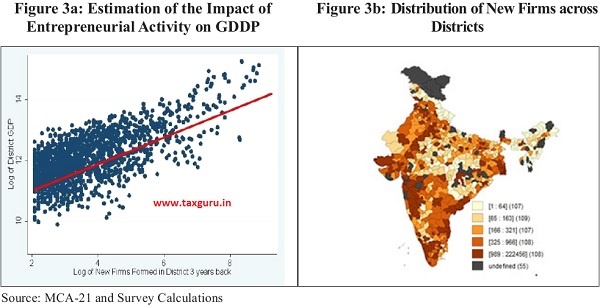
India. Figure 3b represents spatial dispersion in entrepreneurial activity as defined by establishment of new firms. We find that, though the peninsular states dominate entry of new firms, entrepreneurship is dispersed across India and is not restricted just to a few metropolitan cities.
Spatial Heterogeneity in Entrepreneurial Activity
2.5 Figure 4a, which shows the coefficient plot for the estimation of impact of entrepreneurial activity by sector, highlights that the impact of new firm entry is greatest in the Manufacturing and Services sectors. The findings emphasize the fundamental role that entrepreneurship can play in India’s economic growth in the decades ahead. Movement of labour from other unproductive sectors and subsistence entrepreneurship into entrepreneurship in formal manufacturing and services can help close India’s productivity gaps. To the extent that the manufacturing and services sectors are underdeveloped relative to economies of similar size, greater entrepreneurial activity will help close such gaps.
2.6 Figure 4b below presents the growth in entrepreneurial activity over time for each of the four regions in India. All regions demonstrate strong growth in entrepreneurial activity over time with the exception of the eastern states. Irrespective of the level of entrepreneurial activity, all regions demonstrate a strong relationship between

entreprenurship and GDDP signifying the pervasive benefits of entrepreneurship.
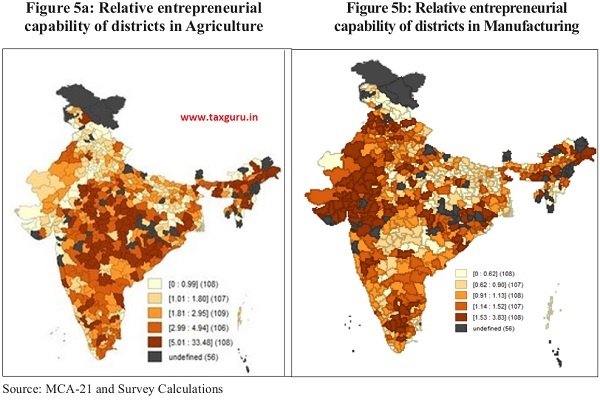
2.7 Next, an index of entrepreneurial activity for each district-sector is constructed to throws light on how the entrepreneurial capabilities for that sector are distributed across districts. For any specific sector, this index is estimated as a district’s share of new firms in that sector, divided by that district’s share of all new firms across all sectors. For example, a district responsible for 20 per cent of new firms in the agricultural sector, but only 10 per cent of all new firms, scores 2 on

an index of relative entrepreneurial activity in agriculture, suggesting relative strength in that sector. Figures 5a to 5d show the relative distribution of the index across districts for agriculture, manufacturing, services and infrastructure respectively.
2.8 Figure 5a suggests that relative to entrepreneurial capabilities in Manufacturing, Services and Infrastructure, entrepreneurial capabilities in the Agriculture sector are not geographically localized and seem to be distributed evenly across most districts in India. States in the highest quintile of relative entrepreneurial activity in the Agriculture sector are Manipur, Meghalaya, Madhya Pradesh, Assam, Tripura and Orissa. Establishments in the North East are more likely to be private enterprises in the food business such as organic produce farms and tea plantations while a majority of the establishments in Madhya Pradesh and Orissa are farmer producer companies, designed as hybrids between cooperative societies and private limited companies that organize farmers into a collective to improve their bargaining strength in markets.
2.9 Figure 5b suggests that entrepreneurial activity in the Manufacturing sector is highest in the regions of Gujarat, Meghalaya, Puducherry, Punjab and Rajasthan. Within Gujarat, the most entrepreneurially active districts in the Manufacturing sector are Surendranagar, Rajkot, Bhavnagar and Surat. Establishments in these regions are focused on textiles, chemicals, metals, plastics, and pharmaceuticals manufacturing. The nature of establishments in each of these regions attests to agglomeration economies documented by prior research in the Indian manufacturing sector (Ghani et al. 2011). That is, incumbent industrial structures for input and output markets and specialized labour in a region are strongly linked to higher entrepreneurial activity in that industry-region.
2.10 Spatial heterogeneity in the Manufacturing sector emphasizes the need for policy reforms that improve the ease of doing business, which is discussed in chapter 6 of the survey. It is noteworthy that three of the regions in the highest quintile of entrepreneurial activity in this sector – Gujarat, Punjab and Rajasthan – were classified in a prior economic survey as states with flexible labour laws. Further, states classified in the Economic survey 2018-19 as states with inflexible labour laws such as West Bengal, Assam, Jharkhand, Kerala and Bihar were classified in the lowest quintiles of entrepreneurial activity. While Gujarat’s labour reforms are viewed as pro-worker, the state has also passed other regulations that improve ease of doing business, including reduction in compliance burden, transparent and timely processing of approval and renewal of applications, and reduction in stipulated timelines for granting and renewal of manufacturing sale licences, amongst others. Rajasthan too has introduced several reforms that are viewed as pro-employer. For example, to reduce the influence of trade unions, the state has increased the costs of union formation by increasing the minimum membership requirement to form a union to 30 per cent of the total workforce at an establishment, up from 15 per cent earlier. Similarly, the state has said that no prior approval is required for retrenchment or shutting down units in companies employing up to 300 people, up from the earlier limit of 100 workers. A worker can also object to wrongful termination only within a period of three years. Differences in the mean number of new firms per year and the mean number of new manufacturing firms per year between the states with flexible labour laws and those
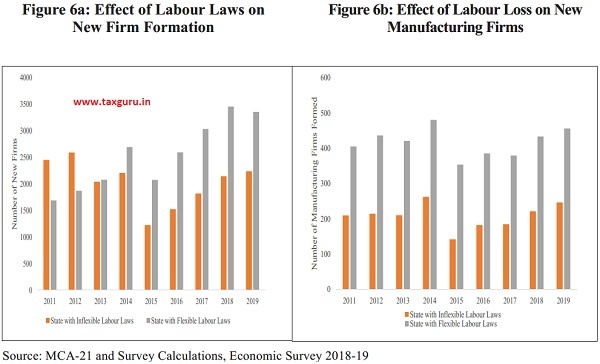
with inflexible laws are presented in Figures 6a and 6b respectively.
2.11 Given the relatively higher economic contribution of entrepreneurial activity in the Manufacturing sector, it is important for states to consider these policy levers that enable transition of labour and resources from less productive sectors and subsistence activity in the informal sector to these relatively more productive establishments.
2.12 Figure 5c suggests that entrepreneurial activity in the Services sector is highest in the regions of Delhi, Mizoram, Uttar Pradesh, Kerala, Andaman and Nicobar, and Haryana. Consistent with observations of prior research (Ghani et al. 2011), the nature of establishments in these regions is not reflective of agglomeration economies and spans diverse industries such as trading, financial services, tourism and hospitality services, retailing, and even religious leagues and missions.
2.13 Figure 5d suggests that entrepreneurial activity in the Infrastructure sector is highest in the states of Jharkand, Arunachal Pradesh, Himachal Pradesh, Mizoram, Jammu and Kashmir and Bihar, some of which are characterized by poor levels of extant infrastructure. Not surprisingly, new firms in these states are largely engaged in construction, logistics and transport, utilities generation, transmission and distribution, alternative energy distribution, and Infratech.
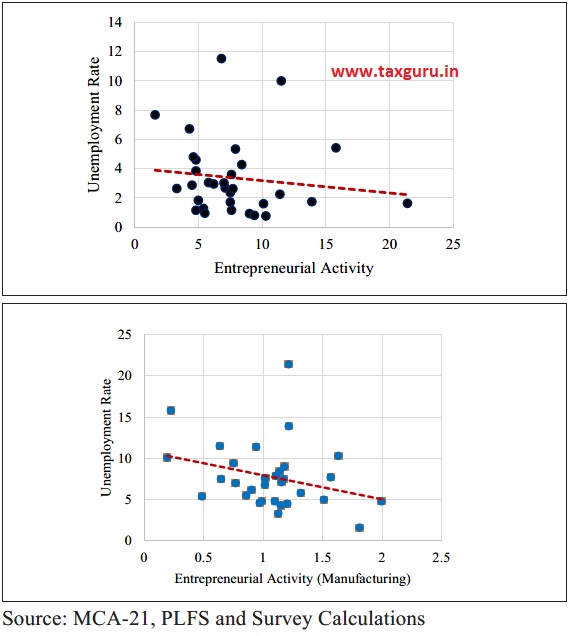
2.14 The nature of entrepreneurial activity in a district is significantly correlated with unemployment in the district, as measured by the Periodic Labour Force Survey (PLFS) data. Entrepreneurial activity in the agriculture and manufacturing sectors shares a negative spatial correlation of (-0.26) and (-0.29) respectively with the unemployment rate across states. In contrast, entrepreneurial activity in the services and infrastructure sectors shares a positive spatial correlation of 0.36 and 0.09 respectively with unemployment rate across states. These estimates are especially salient as the number of active one-person new firms in the services sector (14,475) is over five times that in all the other three sectors combined (2,785). The contribution of this class of entrepreneurial activity to GDP is also insignificant. The correlations between overall entrepreneurial activity and entrepreneurship in manufacturing with unemployment rates are presented in Figure 7 below.
Figure 7: Correlation of entrepreneurial activity in overall and manufacturing with unemployment
DETERMINANTS OF ENTREPRENEURIAL ACTIVITY
2.15 A natural question that follows from the documentation of significant spatial heterogeneity in entrepreneurial activity is what are the factors that drive such heterogeneity. The conclusions of research are summarized thus far (see Box 3) in this context, and subsequently, drivers of new firm entry in India are examined. While prior research implicates local population characteristics, district-level conditions, and agglomeration economies in the birth of new firms, these analyses are limited to district level conditions that represent important policy levers for the government.
2.16 The focus is on two key sets of district-level attributes that drive the level of entrepreneurial activity in the district – social and physical infrastructure. While these attributes do not constitute an exhaustive list of district-level conditions, they are widely featured in prior research on entrepreneurship and economic development in India. These measures of social infrastructure in a district largely relate to the general education levels in the district. Higher education levels in a district enable the development of better human capital that relates to increased supply of ideas and entrepreneurs. Higher education also increases the supply of talent available to entrepreneurs for managing and growing their companies. Therefore, it is expected that districts with better education levels will have higher entrepreneurial activity. The number of colleges in the district and the proportion of the population that is literate in a district are used to measure the education infrastructure in the district.
2.17 The measures of physical infrastructure include access to basic physical infrastructure in the district as well as physical connectivity that captures across-district infrastructure in most cases. The access to physical infrastructure in a district is measured using the proportion of villages in a district that is connected by tar roads. This measure is expected to correlate with access to other public goods like electricity, water/ sanitation facilities, and telecom services that is fundamental to all businesses. Physical connectivity is measured as the mean distance from a population centre that has at least 500,000 people. Proximity to large population centers likely allows the startup to expand markets and scale operations. Therefore, it is expected that both these measures would correlate positively with entrepreneurial activity. Box 4 summarizes the methodology for estimation of the impact of physical and social infrastructure in a district on entrepreneurial activity in that district.
Box 3: Summary of Research on the Drivers of Entrepreneurial Activity
This study focuses on district-level conditions, notably, social and physical infrastructure that promote entrepreneurial activity. However, a rich body of prior work also emphasizes the role of other spatial and industrial factors in driving heterogeneity in entrepreneurial activity. These include population attributes, other district-level conditions, regulatory framework, and agglomeration economies. These factors influence opportunities, skills and resources available to entrepreneurs, driving firm creation and growth (Mittelstädt and Cerri 2008).
The role of local population characteristics such as population size and density is especially salient to new firms, where local markets are assumed the firm’s primary product market and where most entrepreneurs are assumed to start their business in their area of residence (Dahl and Sorenson 2007). In such case, the size of the region reflects local market size and to some degree, the potential supply of entrepreneurs and managers. Population density also impacts other operating parameters such as competition for local resources and higher resource costs (for example wages and land rents) (Ghani et al. 2011). Some studies (Carlino et al. 2007; Arzaghi and Henderson 2008) also link density to stronger knowledge flows, rendering its impact on entrepreneurial activity an empirical question. Researchers (Evans and Leighton 1989; Bönte et al. 2009; Glaeser and Kerr 2009) have also demonstrated an inverted-U relationship between regional age structure and entreprenurship rates that underlies India’s “demographic dividend”, establishing this variable as an important driver of entrepreneurship.
While the district-level investments in physical infrastructure and education are considered, other attributes such as digital literacy and ease of access of entrepreneurs to technology and finance are also salient to fostering entrepreneurship and increasing productivity and competitiveness of new ventures (see Mittelstädt and Cerri 2008 and Ghani et al. 2011 for a review of this literature and case studies). Barriers to finance, especially difficulty in accessing risk capital (versus growth capital), often disproportionately impact small and micro firms (Meki 2019).
Entrepreneurial activity can also be impeded by the regulatory framework in the region that hinder entry and exit, limit competition and increase costs of compliance and administration (see the study, Fostering Entrepreneurship by the OECD (1998) for a review). Key parameters that have been implicated by prior research in this context include regulatory barriers to entry, competition policy, bankruptcy legislation, tax burdens, administrative and compliance costs, and protection of intellectual property rights.
In addition to district-level conditions that homogenously impact all industries, there exist interactions between these conditions and specific industries as explicated in agglomeration theories (Marshall 1920; Glaeser and Kerr 2009). In the Indian context, Ghani et al. (2011) find strong evidence of agglomeration economies in manufacturing that emphasizes the input-output relationships amongst firms.
All of these factors represent key ways in which policy makers can influence spatial distribution of entrepreneurial activity.
Box 4: Estimation of Drivers of Entrepreneurship
To explore the drivers of entrepreneurship in a district, once again using an OLS specification, the number of new firms in district i in year t are regressed on the proportion of villages in that district connected by tar roads (proportion connected), the proportion of population in the district that is literate (proportion literate), the mean distance of the district from the nearest population centre that has at least 500,000 people (mean distance in natural log) and the total number of colleges in the district (colleges in natural log).
All our regressors are based on the most recent census and control for population density in the district, again as per the most recent census (population density in natural log). The specification in Equation (2) below is used to estimate the effect of different aspects of social and physical infrastructure on the number of new firms:
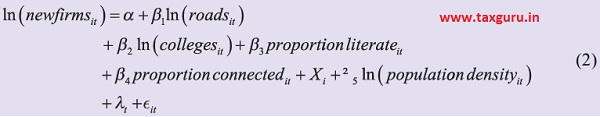
In equation (2), subscript i denotes a district and t denotes a census year. lt denotes census year dummies and standard errors are clustered at the level of a district.
2.18 As expected, an increase in the proportion of literate population in a district increases entrepreneurial activity as measured by the number of new firms in the district. Figure 8a shows that the number of new firms formed increases with an increase in the literacy in the distric. The largest increases appear when literacy rises above 72 per cent. This suggests that small increases in literacy levels matter less. Instead, the largest payoffs to increasing literacy occur when literacy levels are already high, specifically above 72 per cent.
2.19 Similar patterns are visible with the number of colleges as well, albeit with a few differences. In contrast with the proportion of the literate population, the largest increases appear when the number of colleges in a district increase above 26. In sum, the results of figures 8a and 8b suggest that higher literacy levels and better education infrastructure are associated with greater entrepreneurship.

Box 5 – Box plot explained
The boxplot divides independent variable of interest into five categories based on how it is distributed – the lowest quintile, 20th – 40th percentile, 40th – 60th percentile, 60th – 80th percentile, and the highest quintile. Within each category it then explores the value of the dependent variable, in this case, the number of new firms foreach of the following values : (a) the minimum denoted by the lowest horizontal line, (b) first quartile denoted by the bottom line of the rectangle (c) median denoted by the blue line inside the rectangle of a category, (d) third quartile denoted by the top line of the recantagle of a category, and (e) the maximum denoted by the top most horizintal line. The box plots show how moving from one category to another changes the number of new firms for different values of the independent variable within a given category.
2.20 Figures 9a and 9b suggest that superior access to markets is also associated with higher entrepreneurial activity. Figure 9a shows the effect of the proportion of villages that are connected by tar roads in a district, hereafter labelled “connectivity.” The Figure shows that till connectivity increases to 91 per cent, i.e., 91 per cent of the villages in the district are connected by tar roads, the number of new firms increases monotonically. However, after this threshold, the number of new firms decreases. These results are symptomatic of diminishing returns from physical connectivity – when the access to local markets increases beyond a point, competition levels might increase and possibly discourage entrepreneurial activity. On similar lines, beyond a point, increased levels of infrastructure development might also open up potential entrepreneurs to other opportunities and consequently, decrease the incentives to become entrepreneurs.

2.21 Similar patterns are visible in Figure 9b as well. Figure 9b shows the effect of proximity to markets as captured by districts that are the closest to a centre that has a population of least 5 lakhs. As the proximity to markets increases, the number of new firms increases monotonically. The greatest improvement is seen when the distance to a market centre decreases below 42 kms. In sum, Figures 9a and 9b suggest superior physical infrastructure will likely promote entrepreneurial activity. However, there may be limits to how much its improvement may aid entrepreneurship. Beyond a point, increased access to local markets may create hyper-competition and discourage entrepreneurship. On the contrary, no such diminishing returns are apparent with increases in literacy or improving education infrastructure. Increasing literacy levels or the formation of new colleges appear to increase the number of new firms monotonically.
POLICY IMPLICATIONS FOR FAST-TRACKING ENTREPRENEURSHIP AND WEALTH CREATION
2.22 Clear patterns emerge from the analysis. Despite being the 3rd largest ecosystem for entrepreneurship in the world, India appears to have lower rates of formal entrepreneurship on a per-capita basis when compared to other countries. Consistent with the prevailing wisdom, a significant association between the count of new firms born in a district and the GDDP of that district is found – a 10 per cent increase in registration of new firms is associated with a 1.8 per cent increase in GDDP. This contribution of entrepreneurial activity to GDDP is strongest for the Manufacturing and Services sectors. Further, significant heterogeneity in entrepreneurial activity across districts demonstrates the critical role played by social and physical infrastructure in determining such heterogeneity. For instance, the eastern part of India has the lowest literacy rate of about 59.6 per cent according to the census of 2011. This is also the region in which formal entrepreneurial activity is the lowest. The analysis in this chapter, therefore, suggests the following policy implications.
2.23 First, measures to increase the literacy levels rapidly through the institution of more schools and colleges will spur entrepreneurship and consequently local wealth creation. Following the successful contribution of privatization of engineering colleges to India’s software exports (Arora et.al., 2011), governments could also explore the privatization of education to augment education capacity at all levels of education.
2.24 Second, better connectivity of villages through tar roads will likely improve access to local markets and improve entrepreneurial activity. However, in terms of prioritization, this may not be as crucial as investments in education. Moreover, increasing the access to local markets might create other types of opportunities which might discourage entrepreneurship. Hence investments in infrastructure especially those undertaken to increase entrepreneurial activity should be weighed against how improved infrastructure creates other kinds of opportunities that might be consequential to a district’s GDDP.
2.25 Third, policies that foster ease of doing business and flexible labour regulation foster entrepreneurial activity, especially in the manufacturing sector. As the manufacturing sector has the potential to create the maximum jobs, states must focus on enabling ease of doing business and flexible labour regulation to foster job creation.
CHAPTER AT A GLANCE
> This chapter examines the content and drivers of entrepreneurial activity at the bottom of the administrative pyramid – over 500 districts in India. The analysis employs comprehensive data on new firm creation in the formal sector across all these districts from the Ministry of Corporate Affairs (MCA)-21 database.
> First, using the World Bank’s Data on Entrepreneurship, this chapter confirms that India ranks third in number of new firms created. The same data shows that new firm creation has gone up dramatically in India since 2014. While the number of new firms in the formal sector grew at a cumulative annual growth rate of 3.8 per cent from 2006-2014, the growth rate from 2014 to 2018 has been 12.2 per cent. As a result, from about 70,000 new firms created in 2014, the number has grown by about 80 per cent to about 1,24,000 new firms in 2018.
> Second, reflecting India’s new economic structure, i.e. comparative advantage in the Services sector, new firm creation in services is significantly higher than that in manufacturing, infrastructure or agriculture.
> Third, grassroots entrepreneurship is not just driven by necessity as a 10 percent increase in registration of new firms in a district yields a 1.8 percent increase in GDDP. Thus, entrepreneurship at the bottom of the administrative pyramid – a district – has a significant impact on wealth creation at the grassroot level. This impact of entrepreneurial activity on GDDP is maximal for the manufacturing and services sectors.
> Fourth, birth of new firms is very heterogeneous across Indian districts and across sectors. Moreover, it is dispersed across India and is not restricted to just a few cities.
> Fifth, literacy and education in the district foster local entrepreneurship significantly. For instance, the eastern part of India has the lowest literacy rate of about 59.6 per cent according to the census of 2011. This is also the region in which new firm formation is the lowest. In fact, the impact of literacy on entrepreneurship is most pronounced when it is above 70 per cent.
> Sixth, the level of local education and the quality of physical infrastructure in the district influence new firm creation significantly.
> Finally, policies that enable ease of doing business and flexible labour regulation enable new firm creation, especially in the manufacturing sector. As the manufacturing sector has the greatest potential to create jobs for our youth, enhancing ease of doing business and implementing flexible labour laws can create the maximum jobs in districts and thereby in the states.
> Literacy, education and physical infrastructure are the other policy levers that district and state administrations must focus on foster entrepreneurship
REFERENCES
Arora, A. and Bagde, S., Advantage, R. R. C., & Based, K. 2011. “Private investment in human caoital and industrial development: the case of the Indian software industry. Dimensions of Economic THEORY and Policy: Essays for Anjan Mukherji.
Arzaghi, M. and Henderson, J.V., 2008. “Networking off madison avenue.”. The Review of Economic Studies, 75(4), pp.1011-1038.
Bönte, W., Falck, O. and Heblich, S., 2009. “The impact of regional age structure on entrepreneurship.”. Economic Geography, 85(3), pp.269-287.
Carlino, G.A., Chatterjee, S. and Hunt, R.M., 2007. “Urban density and the rate of invention”. Journal of Urban Economics, 61(3), pp.389-419.
Dahl, M. and Sorenson, O., 2007. “Home sweet home: Social capital and location choice.”. Social Science, pp.1-22.
Evans, D.S. and Leighton, L.S., 1989. “The determinants of changes in US self-employment, 1968–1987.”. Small Business Economics, 1(2), pp.111-119.
Ghani, E., Kerr, W. and O’Connell, S., 2011. “Promoting entrepreneurship, growth, and job creation.”. Reshaping Tomorrow, pp.168-201.
Glaeser, E.L. and Kerr, W.R., 2009. “Local industrial conditions and entrepreneurship: how much of the spatial distribution can we explain?”. Journal of Economics & Management Strategy, 18(3), pp.623-663.
Meki, M., 2019, September. “Microequity For Microenterprises: Evidence From An Artefactual Field Experiment And Survey.”. In Economic Research Forum Working Papers (No. 1348).
Mittelstädt, A. and Cerri, F., 2008. “Fostering entrepreneurship for innovation.
OECD, 1998. Fostering entrepreneurship.”. Industries Services and Trade, 16(1), p.277.
APPENDIX
Table A1: OLS regressions of natural log of GDDP on natural log of new firms.
| VARIABLES | (1) Log of GDDP | (2) Log of GDDP | (4) Log of GDDP |
| Log of New Firms Formed 3 years back | 0.18***
(0.01) |
||
| Log of New Firms Formed in Agriculture 3 years back | 0.03***
(0.00) |
||
| Log of New Firms Formed in Manufacturing 3 years back | 0.07***
(0.00) |
||
| Log of New Firms Formed in Services 3 years back | 0.07***
(0.00) |
||
| Log of New Firms Formed in Infrastructure 3 years back | 0.05***
(0.00) |
||
| Log of New Firms Formed in Other Sectors 3 years back | 0.04***
(0.01) |
||
| South India | 10.96***
(0.05) |
||
| North India | -0.39***
(0.06) |
||
| East India | -0.68***
(0.07) |
||
| West India | -0.24***
(0.06) |
||
| South India x Log of New Firms Formed 3 years back | 0.22***
(0.02) |
||
| North India x Log of New Firms Formed 3 years back | -0.06***
(0.02) |
||
| East India x Log of New Firms Formed 3 years back | 0.03
(0.02) |
||
| West India x Log of New Firms Formed 3 years back | 0.02
(0.03) |
||
| Constant | 10.66***
(0.02) |
11.21***
(0.04) |
|
| Observations | 5,591 | 5,591 | 5,591 |
| R-squared | 0.85 | 0.87 | 0.77 |
| State Fixed Effects | Yes | Yes | No |
| Year Fixed Effects | Yes | Yes | Yes |
| Errors Clustered at District Level | Yes | Yes | Yes |
*p<0.10, **p<0.05, ***p<0.01
Table A2: OLS regressions of natural log of new firms on measures of physical and social infrastructure
| VARIABLES | (1) Natural Log of New Firms Formed |
(2) Natural Log of New Firms Formed – Agriculture |
(3) Natural Log of New Firms Formed – Manufacturing |
(4) Natural Log of New Firms Formed – Services |
| Natural Log of Population Density per last Census | 0.18***
(0.04) |
0.09**
(0.03) |
0.16***
(0.04) |
0.24***
(0.04) |
| Natural Log of Total Colleges per last Census | 0.74***
(0.09) |
0.45***
(0.08) |
0.69***
(0.10) |
0.72***
(0.09) |
| Percentage of Population Literate per last Census | 0.07***
(0.01) |
0.03***
(0.01) |
0.06***
(0.01) |
0.08***
(0.01) |
| Percentage Villages
Connected by Tar Roads per last Census |
0.02***
(0.00) |
0.01***
(0.00) |
0.02***
(0.01) |
0.02***
(0.00) |
| Percentage Villages Having Access to Power per last Census | 0.00
(0.00) |
0.00
(0.00) |
0.01
(0.00) |
0.00
(0.00) |
| Natural Log of Mean Distance from 500K Population Centre |
-0.15***
(0.05) |
-0.16***
(0.03) |
-0.18***
(0.05) |
-0.16***
(0.05) |
| Constant | -6.11***
(0.67) |
-5.96***
(0.51) |
-7.47***
(0.72) |
-7.92***
(0.67) |
| Observations | 5,337 | 5,337 | 5,337 | 5,337 |
| R-squared | 0.53 | 0.44 | 0.43 | 0.56 |
| State Fixed Effects | Yes | Yes | Yes | Yes |
| Census Fixed Effects | Yes | Yes | Yes | Yes |
| Errors Clustered at District Level | Yes | Yes | Yes | Yes |
*p<0.10, **p<0.05, ***p<0.01


