Suril Mehta
 With Excel 2010, Microsoft has introduced a cool feature called the Microsoft BI – Business Intelligence tools. One of the tools, PowerView, enables you make some amazing dashboard within a few minutes!
Prerequisites:
Excel 2010 or Excel 2013, PowerPivot addin (for Excel 2010), a decent PC since this process (although simple) is processor-intensive.
Now lets get started..
Getting Started (Excel 2013)
Although Power BI tools are available in Excel 2010, this post has been written considering excel 2013 users. If you haven’t installed PowerView, check this link to get you started:
http://office.microsoft.com/en-in/excel-help/create-a-power-view-sheet-in-excel-2013-HA102899553.aspx#_Toc358035966
Once you have added the PowerPivot and PowerView tabs, its time to get started….
Data!
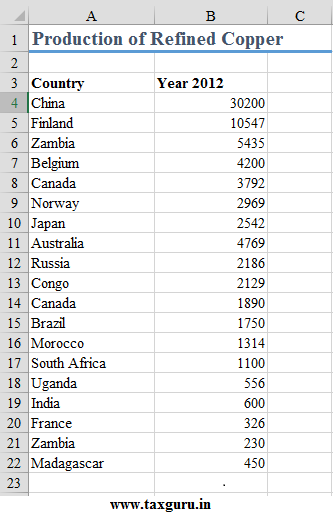
I prepared a simple list of name of countries alongwith the refined copper produced by each of the country in the year 2012.
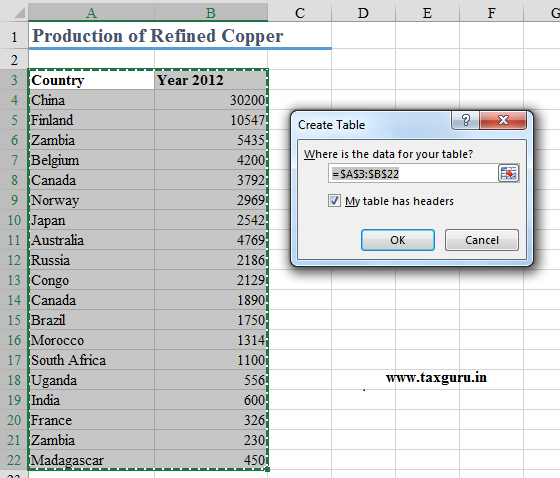
 Now I need to convert this data into a ‘Table’ (this is an awesome feature of excel; for more info kindly visit http://chandoo.org/wp/excel-tutorial/using-tables/).
To convert to a table, just select the data and press Ctrl + T. A dialog box appears – tick on ‘My table has headers’ and proceed.
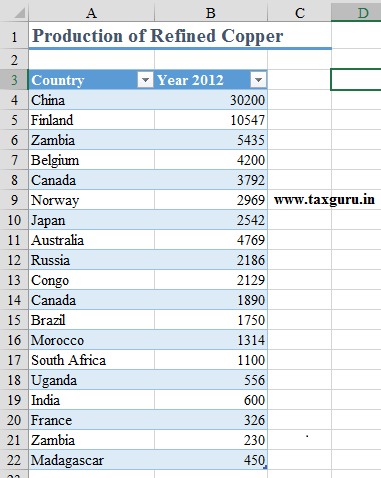
This is how you table will look like if you convert this into….well…..a table!
Now go to PowerPivot – ‘Add to Data Model’ (in the ‘Tables’ Tab)
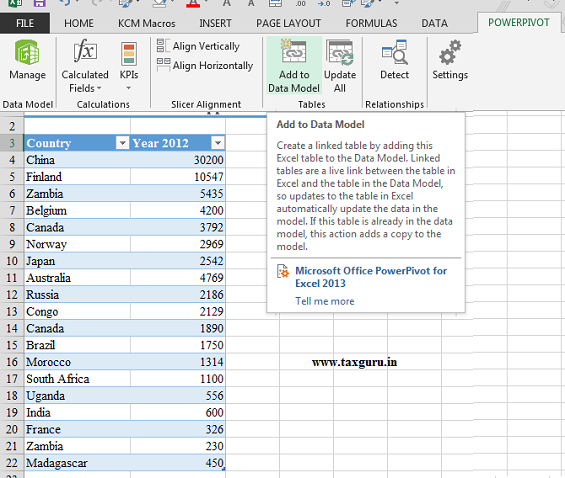
This may take a while. It will ultimately open the PowerPivot window in which you can see your excel table. Now click on any cell of the column containing the numbers and choose the appropriate data type. This is to ensure that excel considers your numbers as…well….numbers!! (and not text!!!). To choose, goto the Home tab – Data Type: Whole Number (Choose ‘Decimal number’ if your data has decimals).

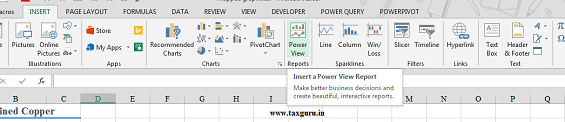
Now close the PowerPivot window (this is done like any other excel file – click on the ‘X’). In your excel sheet, goto Insert – PowerView (in the Reports tab).
This will open your PowerView sheet! If excel has created any table in it by default, just select it and press delete.
Working with your PowerView Sheet
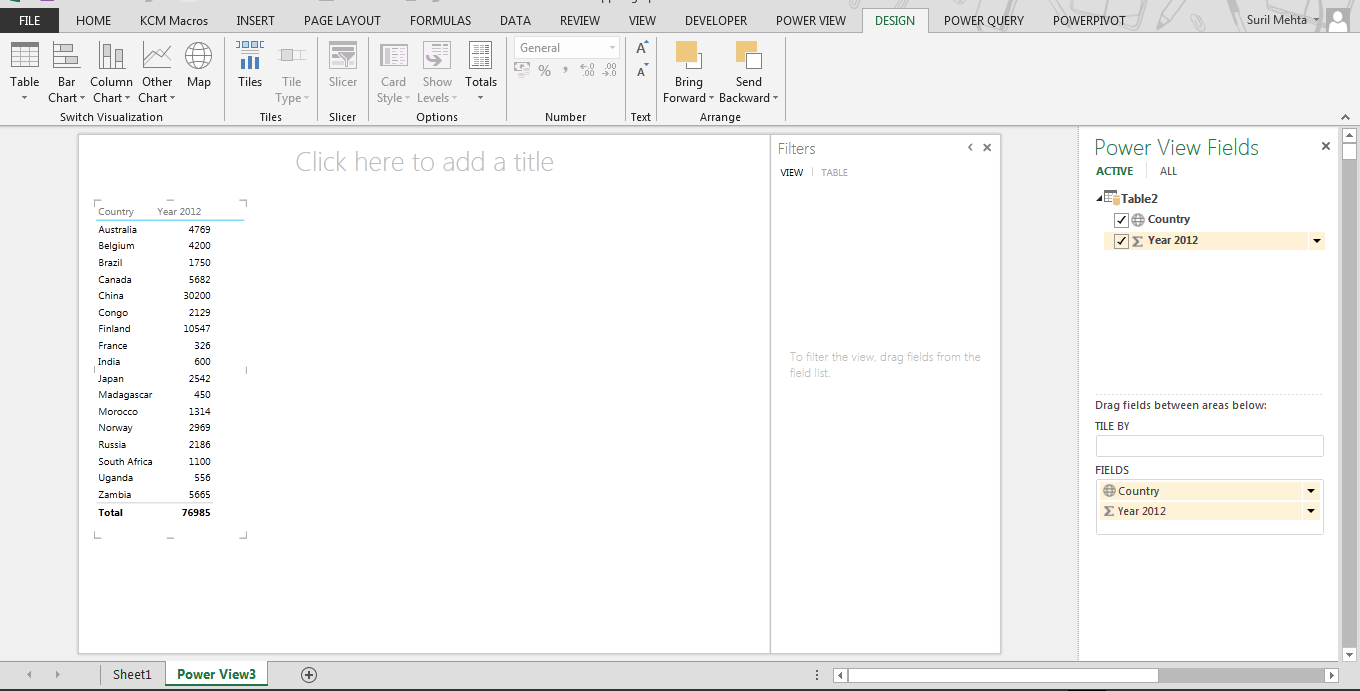
There is a box on the right hand side showing the ‘Power View Fields’ (if you cant see it, goto powerview – field list). Click the checkbox besides country and then the checkbox besides Year 2012. You have created a scrollable table (just one more step now before you get you map).
The Map
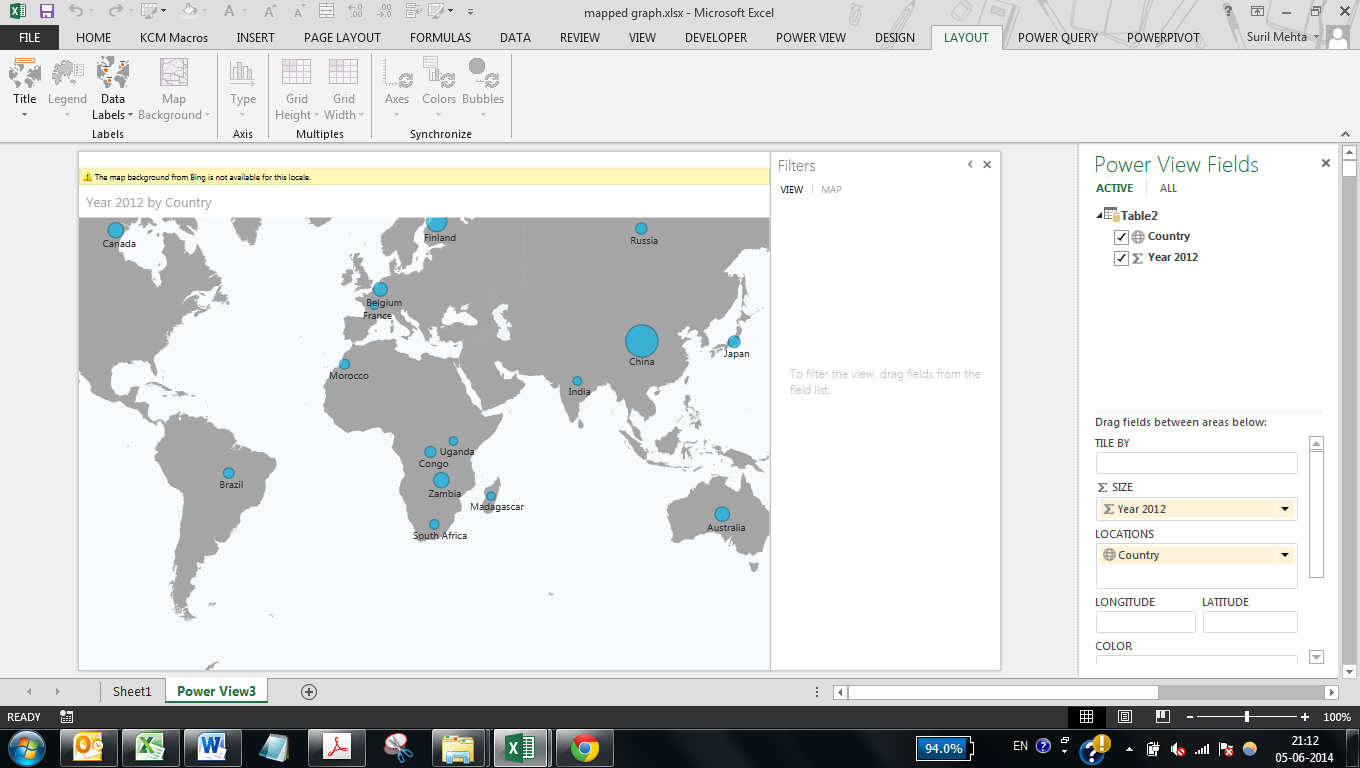
Keeping your table selected, Click Design – Map (in the Switch Visualization tab). Voila! you have plotted your excel data in a Map!!! You can expand this by pressing the pop out key in the top right hand side of your map.

You can add the name of the countries by selecting Layout – Data Labels.
Note: Power BI tools are feature rich set of awesome stuff that Microsoft has introduced. Please exploit them. The PowerView sheet discussed above can have many charts and data in a single sheet and each data set would be automatically linked with the rest. While this may be gibberish to you right now, once you get a hang of it, it would change your perception of excel.


Yes it is possible. Map data is captured from bing maps so anything appearing there can be plotted in excel. Interestingly, you can also plot data address wise – i.e. within even a single city!
Very helpful indeed!
Thank you Suril. One Question though. Can this feature be used to plot data for a regional map say for example- a karnataka map wherein data is to be plotted for different districts of karnataka.
Super Cool