The industrial sector based on Index of Industrial Production (IIP) registered a growth of 0.6 per cent for 2019-20 (April-November) as compared to 5.0 per cent during 2018-19 (April-November). Growth of manufacturing sector was 0.9 per cent during 2019-20 (April-November) as compared to 4.9 per cent during 2018-19 (April-November). Growth of refinery products sector stood at (-) 1.1 per cent during 2019-20 (April-November) as compared to 5.3 per cent during 2018-19 (April-November). Steel sector achieved a growth of 5.2 per cent during 2019-20 (April-November) as compared to 3.6 per cent during 2018-19 (April-November). Government has initiated several policies in various infrastructure sectors to enhance their capacity and output. Report of the Task Force on National Infrastructure Pipeline released on 31.12.2019 has projected total infrastructure investment of Rs. 102 lakh crore during the period FY 2020 to 2025 in India.
INTRODUCTION
8.1 Industrial sector performance is critical to achieving the ambitious goal of making India a five-trillion economy. The sector plays a decisive role in determining the overall growth of national output and employment through its backward and forward linkages with the other two sectors of the economy. It contributes close to 30 per cent of total gross value added (GVA). The sector is, however, vulnerable to several internal and external economic challenges which affect its overall performance.
TRENDS IN INDUSTRIAL SECTOR
8.2 Industrial sector performance in terms of its contribution in GVA improved in 2018-19 over 2017-18. However, as per the estimates of Gross Domestic Product by National Statistical Office (NSO), the real GVA of industrial sector grew by 1.6 per cent in first half (H1) (April-September) of 2019-20, as compared to 8.2 per cent in H1 of 2018-19. The low growth in industrial sector is primarily due to manufacturing sector which registered a negative growth of 0.2 per cent in 2019-20 H1. Growth of real GVA at basic prices for industrial sector is given in Table 1.
Index of Industrial Production (IIP)
8.3 The IIP is a measure of industrial performance. It assigns a weight of 77.6 per cent to manufacturing followed by 14.4 per cent to mining and 8.0 per cent to electricity. Overall, IIP growth has moderated to 3.8 per cent in 2018-19 compared to 4.4 per cent in 2017-18. During the current year 2019-20 (April-November), it grew at 0.6 per cent as compared to 5.0 per cent in the corresponding period of previous year (Table 2). The moderation in growth is mainly arising from subdued manufacturing activities due to slower credit flow to medium and small industries, reduced lending by NBFCs owing to liquidity crunch, tapering of domestic demand for key sectors such as automotive sector, pharmaceuticals, and machinery and equipment, volatility in international crude oil prices, prevailing trade related uncertainties, etc. Exports of key labour intensive sectors, such as gems & jewellery, basic metals, leather products and textile products under-performed during the current financial year.
Table 1: Growth rate of Gross Value Added (GVA) in Industry at Constant Prices (in per cent)
| Share in GVA* | 2017-18 | 2018-19 (PE) | 2019-20 Q1 Q2 | 2019-20 (1st AE) | ||
| Mining & Quarrying | 2.4 | 5.1 | 1.3 | 2.7 | 0.1 | 1.5 |
| Manufacturing | 16.4 | 5.9 | 6.9 | 0.6 | -1.0 | 2.0 |
| Electricity, Gas, Water Supply & other Utility Services | 2.8 | 8.6 | 7.0 | 8.6 | 3.6 | 5.4 |
| Construction | 8.0 | 5.6 | 8.7 | 5.7 | 3.3 | 3.2 |
| Industry | 29.6 | 5.9 | 6.9 | 2.7 | 0.5 | 2.5 |
Source: NSO
Note: * – Share in GVA is at current prices (2018-19), AE – Advance Estimate, PE- Provisional Estimate.
Table 2: Index of Industrial Production (IIP) Growth Rates (in per cent)
| Weight | 2015-16 | 2016-17 | 2017-18 | 2018-19 | 2018-19 (April-November) | 2019-20 (April-November) | |
| General Index | 100.0 | 3.3 | 4.6 | 4.4 | 3.8 | 5.0 | 0.6 |
| Sectoral Classification | |||||||
| Mining | 14.4 | 4.3 | 5.3 | 2.3 | 2.9 | 3.7 | -0.1 |
| Manufacturing | 77.6 | 2.8 | 4.4 | 4.6 | 3.9 | 4.9 | 0.9 |
| Electricity | 8.0 | 5.7 | 5.8 | 5.4 | 5.2 | 6.6 | 0.8 |
| Use Based Classification | |||||||
| Primary goods | 34.0 | 5.0 | 4.9 | 3.7 | 3.5 | 4.8 | 0.1 |
| Capital goods | 8.2 | 3.0 | 3.2 | 4.0 | 2.7 | 7.2 | -11.6 |
| Intermediate goods | 17.2 | 1.5 | 3.3 | 2.3 | 0.9 | 0.7 | 12.2 |
| Infrastructure/ construction goods | 12.3 | 2.8 | 3.9 | 5.6 | 7.3 | 8.3 | -2.7 |
| Consumer durables | 12.8 | 3.4 | 2.9 | 0.8 | 5.5 | 7.8 | -6.5 |
| Consumer non- durables | 15.3 | 2.6 | 7.9 | 10.6 | 4.0 | 4.0 | 3.9 |
Source: NSO.
8.4 As per the use-based classification of IIP, the growth of capital goods and consumer durables declined by 11.6 per cent and 6.5 per cent respectively during the current financial year 2019-20 (April-November). Consumer durables segment was hit mainly due to lack of demand from the household sector especially in Automobile industry.
The growth of infrastructure/ construction goods declined by 2.7 per cent in the current financial year 2019-20 (April-November). However, intermediate goods, consumer non-durable and primary goods registered a growth of 12.2 per cent, 3.9 per cent and 0.1 per cent, respectively, during 2019-20 (April-November) (Table 2). Figure 1 shows the monthly growth of IIP by use-based classification. Intermediate goods and consumer non-durable registered positive growth in November 2019, however, primary goods, capital goods, infrastructure/ construction goods and consumer durables reported negative growth in November 2019.
Figure 1: Monthly growth (in per cent) of IIP (Use based classification)

Eight Core Industries
8.5 The Index of Eight Core Industries measures the performance of eight core industries i.e., Coal, Crude Oil, Natural Gas, Refinery Products, Fertilizers, Steel, Cement and Electricity. The industries included in the Index of Eight Core Industries comprise 40.27 per cent weight in the Index of Industrial Production (IIP).
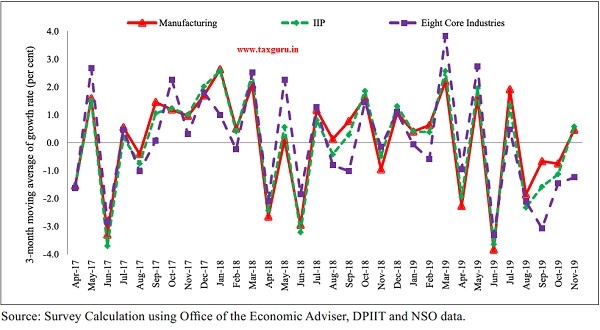
8.6 Growth of Eight Core Industries stood flat during the current financial year (April-November, 2019). During the corresponding period of the previous year, these industries grew at 5.1 per cent. While fertilizers, steel and electricity have seen expansion in their production, procuction of coal, crude oil, natural gas and refinery products have contracted during the current financial year (Table 3). Excessive rainfall during monsoon, law and order problem prevailing in mining areas and strike during September 2019 impacted the coal sector. Crude oil industry continued to show contractionary trend with a growth rate of (-) 5.9 per cent in 2019-20 (April-November) owing to operational issues like power shutdowns, electrical faults due to rains/winds/ thunderstorms, etc. Growth rate of 3 Months Moving Average Month-on-Month (M-o-M) of IIP, Eight Core Industries and Manufacturing sector from 2017-18 to 2019-20 shows that the three indicators move in tandem with some occasional deviation (Figure 2).
Table 3: Growth in the production of Eight Core Industries (in per cent)
| Sector | Weight | 2016-17 | 2017-18 | 2018-19 | 2018-19 (April- November) |
2019-20 (April- November) |
| Coal | 10.3 | 3.2 | 2.6 | 7.4 | 9.0 | -5.3 |
| Crude Oil | 9.0 | -2.5 | -0.9 | -4.1 | -3.6 | -5.9 |
| Natural Gas | 6.9 | -1.0 | 2.9 | 0.8 | -0.7 | -3.1 |
| Refinery Products | 28.0 | 4.9 | 4.6 | 3.1 | 5.3 | -1.1 |
| Fertilizers | 2.6 | 0.2 | 0.0 | 0.3 | -1.3 | 4.0 |
| Steel | 17.9 | 10.7 | 5.6 | 5.1 | 3.6 | 5.2 |
| Cement | 5.4 | -1.2 | 6.3 | 13.3 | 14.2 | 0.0 |
| Electricity | 19.9 | 5.8 | 5.3 | 5.2 | 6.6 | 0.7 |
| Overall Index | 100 | 4.8 | 4.3 | 4.4 | 5.1 | 0.0 |
Source: Office of the Economic Adviser, DPIIT
Note: The industry-wise weights indicated above are individual industry weight derived from IIP and blown up on pro-rata basis to a combined weight of Index of Eight Core Industries equal to 100.
Figure 2: Growth rate of 3 Months Moving Average Month-on-Month (M-o-M) of IIP, Eight Core Industries and Manufacturing sector from 2017-18 to 2019-20 (in per cent)
Performance of Central Public Sector Enterprises (CPSEs)
8.7 As per the Department of Public Enterprises, there are 348 CPSEs as on 31.03.2019, of this, 249 are in operation, 86 CPSEs are yet to start commercial operations and 13 CPSEs are under closure/liquidation. Out of 249 operating CPSEs, as many as 178 CPSEs showed profit during 2018-19, 70 CPSEs incurred losses during the year and 1 CPSE has shown neither profit nor loss. The total profit of profit making CPSEs (178) was ` 1.75 lakh crores in 2018-19. The total loss of loss making enterprises (70) stood at ` 31,635 crore during the year. The overall net profit of the 249 operating CPSEs went up by 15.52 per cent to ` 1.43 lakh crores in 2018-19 from ` 1.24 lakh crores in 201718. The contribution of CPSEs to the Central Exchequer increased by 4.67 per cent to ` 3.69 lakh crores in 2018-19 as against previous year of ` 3.52 lakh crores.
8.8 The cumulative investment (paid up capital plus long terms loans), which was ` 29 crores in 5 enterprises as on March 31, 1951, has gone up to ` 16.41 lakh crores in 335 CPSEs as on March 31, 2019. The increase in investment in all the CPSEs was 14.65 per cent in 2018-19 over 2017-18, and capital employed went up by 11.71 per cent over the same period.
Corporate Sector Performance
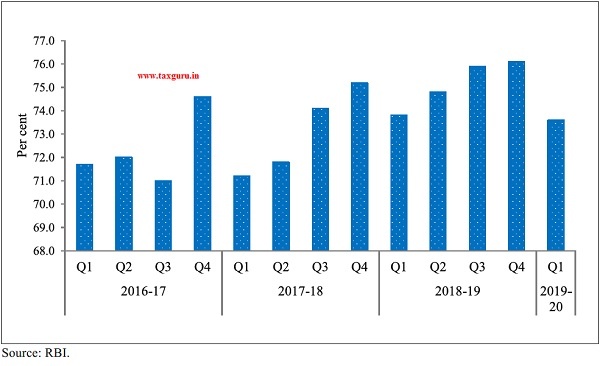
8.9 As per Reserve Bank of India (RBI) Studies on Corporate Performance, demand conditions for the manufacturing sector weakened in Q2 of 2019-20, with a contraction (y-o-y) in nominal sales. Petroleum products, iron and steel, motor vehicles and other transport equipment companies were the major contributors to slowdown. Sales growth (y-o-y) of over 1,700 listed private manufacturing companies contracted by 7.7 per cent in Q2 of 2019-20, after remaining in expansionary zone since Q2 of 2016-17. Net profit for the manufacturing sector contracted in Q1 of 2019-20, mainly due to a production slowdown. Net profit of corporate sector recovered in Q2 of 2019-20 and was 17.4 per cent (Figure 3). The capacity utilisation of India’s manufacturing sector remains stable at 73.6 per cent in Q1 of 2019-20 as compared to 73.8 per cent in Q1 of 2018-19 (Figure 4).
Figure 3: Growth in sales and net profit of listed Manufacturing Companies in the Private Corporate Sector (in per cent)
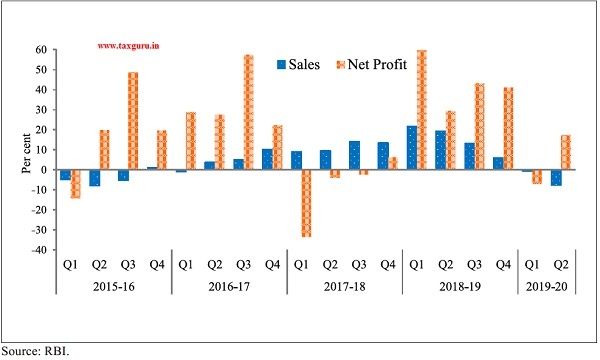
Figure 4: Capacity utilisation of India’s manufacturing sector (in per cent)
Gross Capital Formation in Industrial Sector
8.10 As per the data on national income, consumption expenditure, saving and capital formation released by NSO on January 31, 2019, the rate of growth of Gross Capital Formation (GCF) in industry has registered a sharp rise from (-) 0.7 per cent in 2016-17 to 7.6 per cent in 2017-18, showing upward momentum of investment in industry. Mining & Quarrying, Manufacturing, Electricity, Gas, Water Supply & Other Utility Services and Construction had registered a growth rate of 7.1 per cent, 8.0 per cent, 6.1 per cent and 8.4 per cent respectively in 2017-18 (Table 4).
Table 4: Growth rate of GCF by Industry (at 2011-12 constant prices) (in Per cent)
| 2015-16* | 2016-17# | 2017-18@ | |
| Industry | 11.1 | -0.7 | 7.6 |
| Mining & Quarrying | -19.6 | 16.4 | 7.1 |
| Manufacturing | 11.4 | 1.3 | 8.0 |
| Electricity, Gas, Water Supply & Other Utility Services | 22.4 | -12.9 | 6.1 |
| Construction | 2.6 | 10.1 | 8.4 |
| Source: NSO. |
Note:* – Third Revised Estimates, # – Second Revised Estimates, @ – First Revised Estimates.
Credit Flow to the Industrial sector
8.11 Growth in gross bank credit flow to the industrial sector, on a year-on-year (y-o-y) basis, rose to 2.7 per cent in September 2019 as compared to 2.3 per cent in September 2018. Credit flow to industries like wood & wood products, all engineering, cement & cement products, construction and infrastructure increased in September 2019 as compared to September 2018, while credit flow to mining & quarrying, textiles, petroleum, coal products & nuclear fuel, glass & glassware and basic metal & metal products contracted in the same period. Credit flow to industries like food processing, chemicals & chemical products, vehicles, vehicles parts & transport equipment registered lower growth in September 2019 as compared to September 2018 (Table 5).
Table 5: Growth of Industry-wise deployment of Gross Bank Credit (in Per cent) (Year-on-Year)
| March 2018 | September 2018 | March 2019 | September 2019 | |
| Industry | 0.7 | 2.3 | 6.9 | 2.7 |
| Mining & Quarrying (incl. Coal) | 19.7 | 29.8 | 1.1 | -3.0 |
| Food Processing | 6.8 | 2.2 | 1.1 | 0.6 |
| Textiles | 6.9 | 1.3 | -3.0 | -5.7 |
| Petroleum, Coal Products & Nuclear Fuels | 9.4 | 18.5 | -3.1 | -4.2 |
| Wood & Wood Products | 3.3 | 6.4 | 10.2 | 7.1 |
| Chemicals & Chemical Products | -5.5 | 11.7 | 17.5 | 2.6 |
| Glass & Glassware | 6.5 | 30.3 | 17.0 | -8.0 |
| All Engineering | 3.8 | 3.8 | 8.6 | 4.4 |
| Cement & Cement Products | -3.1 | -10.4 | 5.9 | 17.5 |
| Basic Metal & Metal Product | -1.2 | -7.9 | -10.7 | -7.9 |
| Vehicles, Vehicle Parts & Transport Equipment | 7.0 | 9.1 | 1.4 | 6.9 |
| Construction | 9.5 | 8.7 | 10.4 | 10.5 |
| Infrastructure | -1.7 | 4.7 | 18.5 | 7.2 |
| Other Industries | 4.2 | -1.8 | 6.8 | 7.4 |
Source: RBI.
Ease of Doing Business
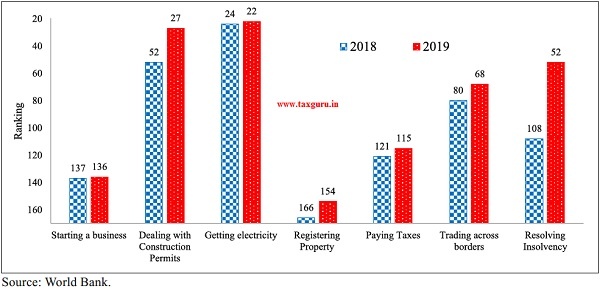
8.12 Government of India has taken several industry specific reform initiatives since 2014 that have significantly improved the overall business environment. In order to improve ease of doing business, the emphasis has been on simplification and rationalization of the existing rules and introduction of information technology to make governance more efficient and effective. The improvement in the business environment as a result of these reforms is reflected in India’s considerably improved ranking to 63rd position among the 190 countries in the World Bank’s Doing Business 2020 Report. This is a jump of 14 ranks over its previous rank of 77 (Figure 5). The ranking is based on 10 indicators which span the life-cycle of a business. India has improved its rank in 7 out of 10 indicators and has moved closer to international best practices (Figure 6).
Figure 5: India’s ranking in World Bank Ease of Doing Business Reports
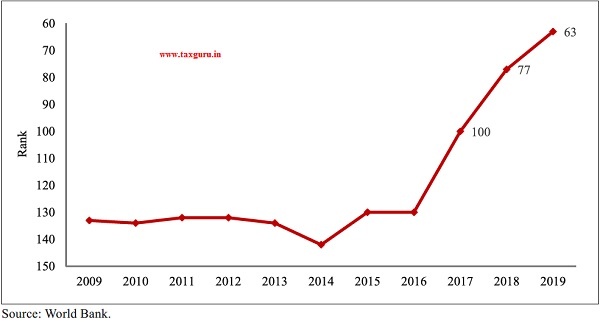
Figure 6: India’s Progress in Ease of Doing Business Reports Rankings
Start-up India
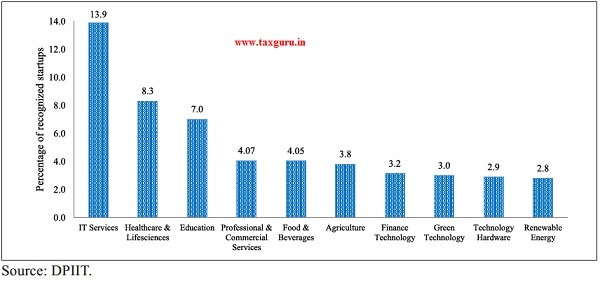
8.13 Startups drive economic growth, create employment and foster a culture of innovation. In order to promote innovation and entrepreneurship among enterprising youth, the Hon’ble Prime Minister of India had announced the “Startup India, Stand-up India” initiative on August 15, 2015. The initiative aims to create an ecosystem that is conductive for the growth of startups. A plan comprising 19 action points was unveiled on January 16, 2016. As on January 8, 2020, 27,084 startups were recognized across 551 districts, 55 per cent of which are from Tier I cities , 45 per cent from Tier II and Tier III cities. 43 per cent of recognized startups have at least one woman director. Steps have been taken for easing regulations such as exemptions from Income tax on investments raised by startups; implementation of 32 regulatory reforms to improve Ease of Doing Business for startups; self-certification regime for six labour laws and three environmental laws; and Startup India Hub as ‘One Stop Shop’ for the startup ecosystem in which 3,67,773 users have availed free Startup India learning Program to build business plans, etc. Maharashtra, Karnataka and Delhi are the top three performers in terms of State-wise distribution of recognized startups in India (Figure 7). As per industry-wise distribution of recognized startups, IT Services accounted for 13.9 per cent followed by Healthcare and Life Sciences (8.3 per cent) and education (7.0 per cent) (Figure 8).
Figure 7: Major State-wise distribution of recognized startups in India (in per cent)
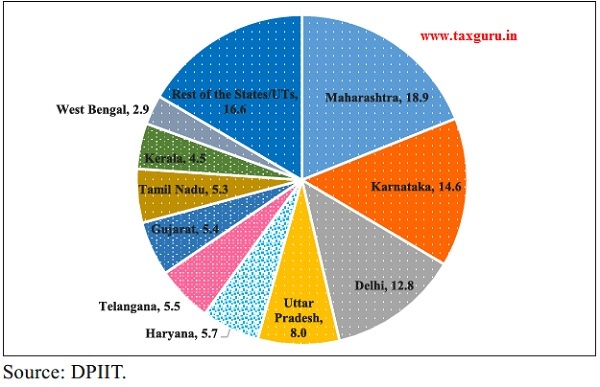
Figure 8: Major Industry-wise distribution of recognized startups in India (in per cent)
Foreign Direct Investment (FDI)
8.14 FDI is a major driver of economic growth as it enhances productivity by bringing capital, skills and technology to the host country. The Government is playing a proactive role in investment promotion through a liberal FDI policy. During 201920 (up to September, 2019), total FDI Equity inflows were US$26.10 billion as compared to US$22.66 billion during 2018-19 (up to September, 2019). Out of FDI Equity inflows of US$26.10 billion during 2019-20 (up to September, 2019), nearly 80 per cent have come mainly from Singapore, Mauritius, Netherlands, USA and Japan.
SECTOR WISE ISSUES AND INITIATIVES
Steel
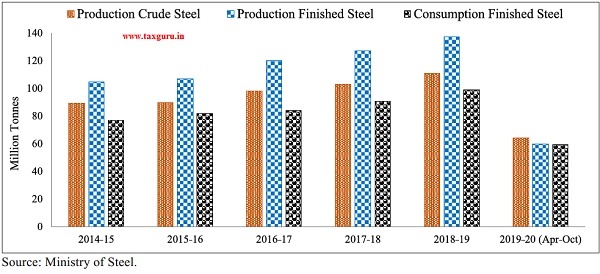
8.15 India stood at second position in the production of crude steel (Figure 9). It is also the third largest consumer of the finished steel after China and USA (Figure 10). However, its per capita consumption was only 74.1 kg during 2018-19 (Figure 11). During 201819, India produced 109.2 MT of crude steel and in the current financial year (FY) till October 2019, crude steel production was 64.3 MT, displaying a growth of 1.5 per cent over corresponding period of last year with utilisation capacity of 77.4 per cent. Similarly production of finished steel was 137.2 MT in 2018-19 and 59.73 MT during April-October 2019 (Figure 12).
Figure 9: Country wise share of Crude steel production for 2019 (January-November) (in per cent)
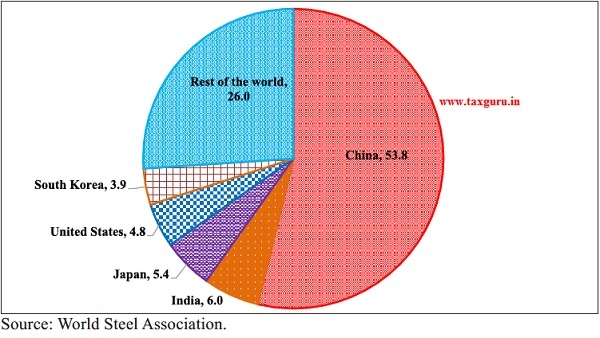
Figure 10: Consumption of finished steel (in per cent) for 2018
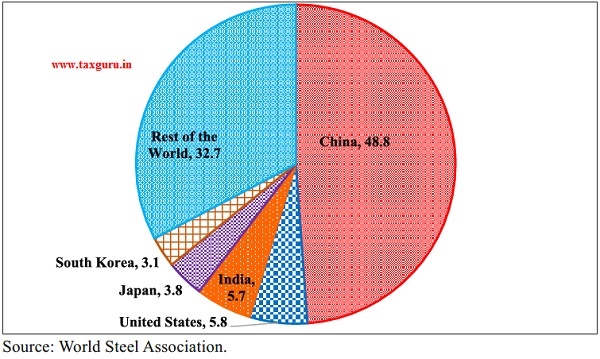
Figure 11: Per capita consumption of total finished steel (Kg) for India
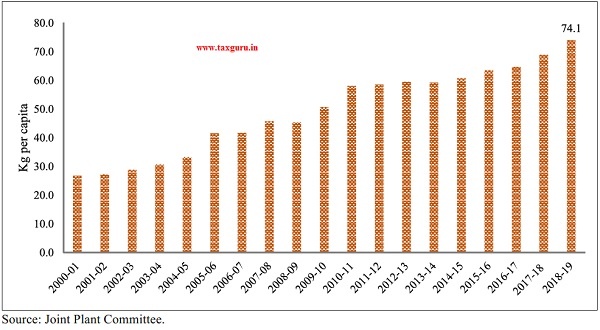
Figure 12: Production & Consumption of finished steel (Million Tonnes)
Coal
8.16 Overall production of raw coal in India during the year 2018-19 was 730.4 million tonnes (MT) displaying a growth of 8.1 per cent. In the current year 2019-20 (April-November), all India coal production was 410.5 MT with a growth rate of (-) 5.3 per cent which is attributable to heavy and unseasonal rains. It is notable that during the first quarter coal production registered a positive growth and then took a dip when the rains set in. The gap between demand and supply of coal in the country is currently being met through coal imports by consuming sectors. As per available data (from Directorate General of Commercial Intelligence and Statistics), 126.20 MT of coal was imported during April 2019 to September 2019 (Figure 13).
Figure 13: Production and import of Coal in India (in million tonnes)

Micro, Small & Medium Enterprises (MSME)
8.17 Micro, Small & Medium Enterprises (MSMEs) contribute significantly in the economic and social development of the country by fostering entrepreneurship and generating largest employment opportunities at comparatively lower capital cost, next only to agriculture. Government is committed to supporting this critically important sector for better credit flow, technology upgradation, ease of doing business and market access. On 2nd November 2018, Hon’ble Prime Minister made 12 key announcements for faster growth of this sector and for promoting ease of doing business. These initiatives alongwith their status are given in Table 6.
Table 6: Status of key initiatives for faster growth of MSMEs and promoting ease of doing business.
| S.N. | Initiative | Status |
| 1 | In-principle approval for loans up to ` 1 crore within 59 minutes through online portal. | 1,59,422 number of loans, involving Rs. 49,330 crore have been sanctioned and 1,38,646 number of loans, involving ` 37,106 crore have been disbursed (up to October 2019). |
| 2 | Interest subvention of 2 per cent for all GST registered MSMEs on incremental credit up to ` 1 crore. | SIDBI has received and settled the claims of ` 18 crore from 43 Banks/NBFCs for the period (02.11.2018 – 31.03.2019). |
| 3 | All companies with a turnover of more than ` 500 crore to be mandatorily on TReDS platform to enable entrepreneurs to access credit from banks, based on their upcoming receivables. | There were 1881 non-compliant Companies, out of these 1881 non-compliant Companies identified by Ministry of Corporate Affairs for taking action, so far 329 companies have registered themselves on the TReDS portal. |
| 4 | All CPSUs to compulsorily procure at least 25 per cent from MSEs instead of 20 per cent of their total purchases. | During 2019-20 (up to October 2019), CPSUs have procured goods and services worth ` 15,936.39 crore from 59,903 MSEs and that is 28.26 per cent of the total procurement by CPSUs during the same period. |
| 5 | Out of the 25 per cent procurement mandated from MSEs, 3 per cent reserved for women entrepreneurs. | During 2019-20 (up to October 2019) procurement from 1471 women MSEs is of ` 242.12 crore and that is 0.43 per cent of the total procurement. |
| 6 | All CPSUs to compulsorily procure through GeM portal. | 258 CPSUs/CPSBs have been on boarded/ registered on GeM portal post 02.11.2018. Total 57,351 MSE Sellers & Service providers registered on GeM portal and 50.30 per cent of orders value on GeM portal is from MSEs. |
| 7 | 20 Technology Centers (TCs) and 100 Extension Centers (ECs) to be established at the cost of ` 6,000 crore. | Till date, six locations have been identified for TCs, RFP issued for PMC for 20 TCs, DPRs of 20 ECs approved and ` 99.30 crore are released. 10 more ECs planned in FY 2019-20. |
| 8 | Government of India to bear 70 per cent of the cost for establishing Pharma clusters. | Four districts viz. Solan (Baddi), Indore, Aurangabad and Pune were selected for assisting pharma clusters for developing common facilities. In principle approval was granted for the proposal from Pune on 31.01.2019. |
| 9 | Returns under 8 labour laws and 10 Union regulations to be filed once in a year. | All regional Heads were advised to vigorously reach out to the employers in their region to make them aware about the facility of filing Online Unified Annual Return on Shram Suvidha Portal under 8 Labour Laws and 10 Central Rules. |
| 10 | Establishments to be visited by an Inspector will be decided through a computerized random allotment. | Total 3080 inspections have been conducted which were assigned through computerized random allotment system and all inspection reports have been uploaded on Shram Suvidha Portal. |
| 11 | Single consent under air and water pollution laws. Returns will be accepted through self- certification and only 10 percent MSME units to be inspected. | All the operations were stayed by Hon’ble High court of Delhi. As of now the matter is sub-judice. |
| 12 | For minor violations under the Companies Act, entrepreneurs no longer have to approach court but can correct them through simple procedures. | So far action has been taken against two companies which fall in the category of MSME by imposition of penalty instead of filing case in the court as per Ordinance/Amendment Act. |
Source: Ministry of Micro, Small and Medium Enterprises
Textile and Apparels
8.18 Textiles contributed 18.0 per cent of manufacturing and 2.0 per cent of GDP in 2017-18. The share of textiles and clothing in India’s total exports was 12 per cent in 2018-
19. The sector is the biggest employer after agriculture and it employs 4.5 crore people directly and 6 crore people in allied sectors. Estimated man-made fibre and filament yarn production increased by 4 per cent and 8 per cent, respectively, during April-August Estimated cloth production by mill sector declined by about 4 per cent during April-August 2019 (Table 7). Exports of textile and clothing products including handicrafts from India have increased to US$40.4 billion in 2018-19 from US$ 39.2 billion in 2017-18 registering a growth of 3 per cent (Table 8).
Table 7: Estimated Production of man-made fibre, filament yarn, spun yarn and cloth
| Period | Man- made fibre | Man- made filament yarn | Cotton yarn | Blended & 100% Non- cotton yarn | Total Spun Yarn | Cloth | ||
| Mill sector * | Decen- tralized sector** | Grand Total (Excluding Khadi, Wool & Silk) | ||||||
| Kg | Kg | Kg | Kg | Kg | Sq. mtr | Sq. mtr | Sq. mtr | |
| 2015-16 | 1347 | 1164 | 4138 | 1527 | 5665 | 2315 | 62269 | 64584 |
| 2016-17 | 1364 | 1159 | 4055 | 1604 | 5659 | 2264 | 61216 | 63480 |
| 2017-18 | 1319 | 1187 | 4064 | 1616 | 5680 | 2157 | 64688 | 66845 |
| 2018-19 | 1443 | 1159 | 4182 | 1680 | 5862 | 2012 | 68034 | 70046 |
| 2018-19# | 603 | 476 | 1758 | 695 | 2453 | 873 | 27938 | 28811 |
| 2019-20 (P)# | 629 | 512 | 1677 | 710 | 2387 | 837 | 28209 | 29046 |
| Variation 2019-20 Over 2018-19 (percent)# | 4.3 | 7.6 | -4.6 | 2.2 | -2.7 | -4.1 | 1.0 | 0.8 |
Source: Ministry of Textiles.
Note: (P) – Provisional, *- Based on statistical data received from units, ** – Based on set of conversion ratio of yarn to fabric, #- (April-August).
Table 8: Exports of textile and clothing products including handicrafts from India (Million US$)
| 2015-16 | 2016-17 | 2017-18 | 2018-19 | |
| Textile & Apparel | 35,995 | 35,372 | 35,666 | 36,627 |
| Handicrafts | 3,293 | 3,639 | 3,573 | 3,804 |
| Total textile & clothing including Handicrafts | 39,288 | 39,011 | 39,239 | 40,431 |
| India’s overall exports | 2,62,290 | 2,75,852 | 3,03,376 | 3,29,536 |
| Share of textile & clothing exports in overall exports (in per cent) | 15 | 14 | 13 | 12 |
Source: Ministry of Textiles.
INFRASTRUCTURE
8.19 It is well-accepted that investment in infrastructure is necessary for growth. Power shortages lead to dependence on expensive captive power, which in turn impels high costs and lack of competitiveness for the economy. Inadequate transport infrastructure leads to bottlenecks both in the supply of raw materials as well as movement of finished goods to the marketplace. The price that farmers get for their produce is depressed if there is no connectivity through good quality rural roads, which in turn keeps rural incomes depressed negating the fruits of high overall growth performance. For all these reasons, provision of adequate infrastructure is essential for growth and for making growth inclusive. India recently launched the National Infrastructure Pipeline for the period FY 2020-2025 (Box 1).
Box 1: National Infrastructure Pipeline 2020-2025
Investment in Infrastructure is necessary for growth. To achieve the GDP of $5 trillion by 2024-25, India needs to spend about $1.4 trillion (` 100 lakh crore) over these years on infrastructure. The challenge is to step-up annual infrastructure investment so that lack of infrastructure does not become a binding constraint to the growth of the Indian economy. To implement an infrastructure program of this scale, it is important that projects are adequately prepared and launched.
To draw up the National Infrastructure Pipeline (NIP) for each of the years from FY 2019-20 to FY 2024-25, an inter-ministerial Task Force was set up in September 2019 under the chairmanship of Secretary (DEA), Ministry of Finance.
NIP is expected to enable well-prepared infrastructure projects which will create jobs, improve ease of living, and provide equitable access to infrastructure for all, thereby making growth more inclusive. NIP also intends to facilitate supply side interventions in infrastructure development to boost short-term as well as the potential GDP growth. Improved infrastructure capacities will also drive competitiveness of the Indian economy.
The Finance Minister released the Report of the Task Force on National Infrastructure Pipeline (abridged version) on 31.12.2019. The NIP has projected total infrastructure investment of ` 102 lakh crore during the period FY 2020 to 2025 in India. Energy (24 per cent), Roads (19 per cent), Urban (16 per cent), and Railways (13 per cent) amount to over 70 per cent of the projected capital expenditure during the said period.
As per the NIP, Central Government (39 per cent) and State Government (39 per cent) are expected to have equal share in funding of the projects followed by the Private Sector (22 per cent). It is expected that private sector share may increase to 30 per cent by 2025. Out of the total expected capital expenditure of ` 102 lakh crore, projects worth ` 42.7 lakh crore (42 per cent) are under implementation, projects worth ` 32.7 lakh crore (32 per cent) are in conceptualization stage and rest are under development. Hence about two-thirds of the pipeline is already firmed up. It is also expected that projects of certain states would be added to the pipeline in due course. The sector wise break-up of NIP projects is as follows:
| Ministry/ Department FY 20-25 (Amount in Rs. Crore) | FY 20-25 (Amount in Rs. Crore) |
| Power | 11,75,995 |
| Renewable Energy | 9,29,500 |
| Atomic Energy | 1,54,088 |
| Petroleum and Natural Gas | 1,94,666 |
| Total Energy | 2,454,249 |
| Roads | 19,63,943 |
| Railways | 13,68,523 |
| Ports | 1,00,923 |
| Airports | 1,43,398 |
| Urban (AMRUT, SMART Cities, MRTS, Affordable Housing, Jal Jeevan Mission) | 16,29,012 |
| Telecommunication | 3,20,498 |
| Irrigation | 7,72,678 |
| Rural Infrastructure | |
| Rural Infrastructure | 4,10,955 |
| Water and Sanitation | 3,61,810 |
| Total Rural Infrastructure | 7,72,765 |
| Agriculture Infrastructure | 54,298 |
| Food Processing Industries | 1,255 |
| Food and Public Distribution | 5,000 |
| Total Agriculture & Food Processing Infrastructure | 60,553 |
| Higher Education | 1,18,348 |
| School Education | 37,791 |
| Health and Family Welfare | 1,68,622 |
| Sports | 7618 |
| Tourism | 24,321 |
| Total Social Infrastructure | 3,56,701 |
| Industries and Internal Trade | 2,99,237 |
| Steel | 8,2-25 |
| Total Industrial Infrastructure | 3,07,462 |
| Total (Rs.crore) | 102,50,704# |
Note: #- As on 31.12.2019. Subject to change as more data becomes available.
The Task Force has given its recommendations on required changes to several key sectoral policies and other reform initiatives by the Central and State Governments such as developing a robust bond market for infrastructure companies, speedy resolution of infrastructure disputes, optimal risk sharing through better and balanced PPP contracts, and sanctity and enforceability of contracts.
The NIP captures the infrastructure vision of the country for the period FY20-25. This is the first-ever exercise undertaken in the country. However, it is recognized that financing of the National Infrastructure Pipeline would be a challenge. It is hoped that a bouquet of well-prepared projects would attract investment from Central and State Governments, Urban Local Bodies, Banks and Financial Institution, PE funds, and private investors, both local and foreign.
SECTORAL DEVELOPMENTS Road Sector
8.20 Road transport is the dominant mode of transportation in terms of its contribution to Gross Value Added (GVA) and traffic share. The share of transport sector in the GVA for 2017-18 was about 4.77 per cent of which the share of road transport is the largest at 3.06 per cent, followed by the share of the Railways (0.75 per cent), air transport (0.15 per cent) and water transport (0.06 per cent). Similarly, as per the National Transport Development Policy Committee Report, as of 2011-12, road transport is estimated to handle 69 per cent and 90 per cent of the countrywide freight and passenger traffic, respectively. The Ministry of Road Transport & Highways (MoRTH) is mandated with the development and maintenance of road networks especially the National Highways as well as the implementation of the Motor Vehicle Act under which it formulates broad policies relating to road transport.
8.21 Road Network in the Country: A good road network is an essential requirement for the rapid growth of the economy. Roads provide connectivity to remote areas, open up backward regions and facilitate access to markets, trade and investment. Roads should not be looked at in isolation, but as part of an integrated multi-modal transport system, which provides crucial links with airports, railway stations, ports and other logistical hubs. As on 31.3.2018, India had a road network of about 59.64 lakh km. The total length of National Highways was 1.32 lakh km as on March 1, 2019. Its State-wise density is given in Map 1. The pace at which roads
Map 1: State/ UT-wise density of National Highways (NH) as on 01.03.2019
(in Kms per 1,000 SQ Km of Area)
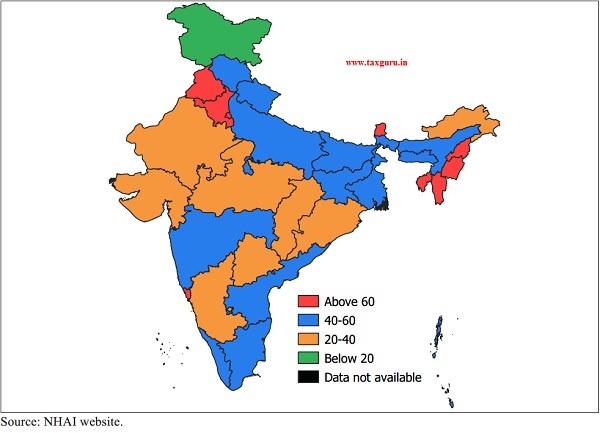
have been constructed has grown significantly from 17 kms per day in 2015-16 to 29.7 kms per day in 2018-19. However, the pace seems to have moderated in 2019-20 (Table 9).
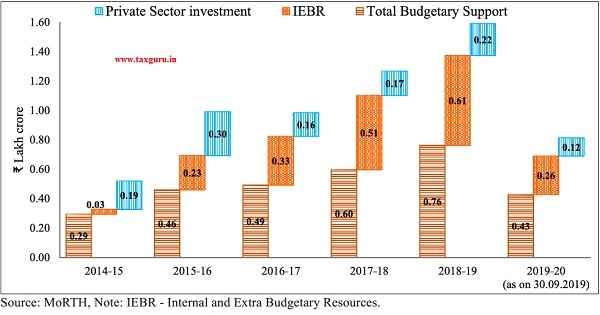
8.22 Total investment in the Roads and Highway sector has gone up more than three times in five year period of 2014-15 to 2018-19 (Figure 14).
Table 9: Road Length Awarded & Constructed (Length in km)
| 2015-16 | 2016-17 | 2017-18 | 2018-19 | 2019-20 # | |
| Award of NHs/Road projects | 10,098 | 15,948 | 17,054 | 5,494 | 2,103 |
| Construction of NHs/Roads | 6,061 | 8,231 | 9,829 | 10,855 | 4,622 |
| Road construction per day | 17 | 23 | 27 | 29.65 | 12.7 |
Source: MoRTH.
Note: # – As on 30.09.2019.
Figure 14: Investment in Road Sector (in Rs. Lakh crore)
Railways
8.23 Indian Railways (IR) with over 68,000 route kms is the third largest network in the world under single management. During the year 2018-19, Indian Railways carried 120 crore tonnes of freight and 840 crore passengers making it the world’s largest passenger carrier and 4th largest freight carrier. Revenue Earning Freight loading by IR during 2018-19 was 12,215 lakh tonnes as against 11,596 lakh tonnes during 2017-18, registering an increase of 5.34 per cent (Figure 15). Passengers originating was 84,390 lakh in 2018-19 as compared to 82,858 lakh in 2017-18, registering an increase of 1.85 per cent in 2018-19 over the previous year (Figure 16).
8.24 Rail Safety: Safety is accorded the highest priority by Indian Railways and steps are being undertaken on a continuous basis to prevent accidents and to enhance safety of the passengers. During 2018-19, consequential train accidents decreased from 73 to 59 in comparison to the corresponding period of the previous year. In the year 2019-20 (April – October 2019), 41 consequential train accidents have occurred (Table 10).
Figure 15: Revenue Earning Freight loading Originating traffic (lakh tonnes)
(excluding loading by Konkan Railways)
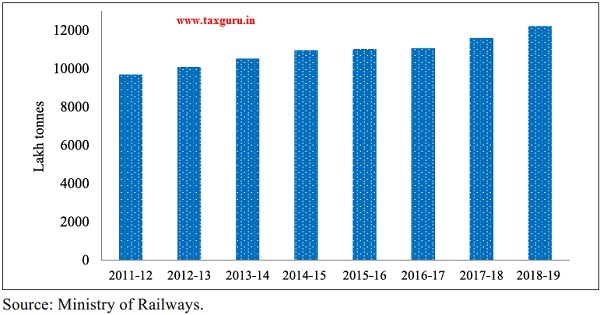
Figure 16: Passengers originating (in lakh) and Passengers Earnings ` Crores)
(includes Metro Railway/ Kolkata)
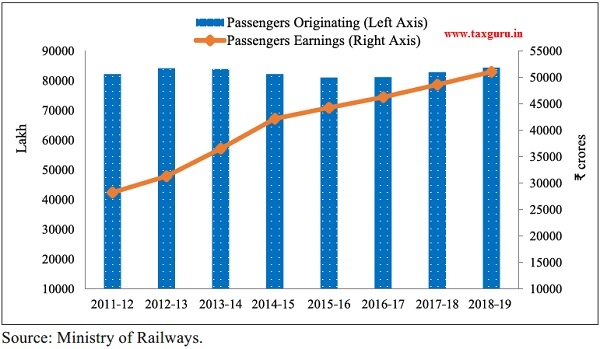
Table 10: Rate of occurrence of rail accidents
| Type of Accident | 2016-17 | 2017-18 | 2018-19 | 2019-20 (April to October) |
| Collision | 5 | 3 | 0 | 3 |
| Derailments | 78 | 54 | 46 | 29 |
| Manned Level Crossing Accidents | 0 | 3 | 3 | 1 |
| Unmanned Level Crossing Accidents | 20 | 10 | 3 | 0 |
| Fire in Trains | 1 | 3 | 6 | 7 |
| Miscellaneous | 0 | 0 | 1 | 1 |
| Total | 104 | 73 | 59 | 41 |
Source: Ministry of Railways.
8.25 Cleanliness and environmental Initiatives by Indian Railway: Indian Railways cover over 8,700 stations and carry around 230 lakh passengers daily with clientele of varied socio-economic backgrounds. Cleanliness is a continuous process and every endeavour is made to keep the stations and coaches in properly maintained and clean condition. Special Cleanliness Campaigns under Swachh Bharat Abhiyan were launched by Indian Railways on October 2, 2014. Regular intensive campaigns/drives have been organized since then by the Indian Railways with the sole objective to achieve significant and sustainable improvements in cleanliness standards. Progress made under Swachh Rail, Swachh Bharat is given in Table 11.
Table 11: Progress of Swachh Rail, Swachh Bharat
| Activity | Status as on 31.03.2015 | Status as on 31.03.2019 | Status as on 31.10.2019 |
| Bio-toilets in passenger Coaches (Numbers) | 19,746 | 1,95,917 | 2,26,000 |
| Mechanized cleaning contracts at Stations | 584 stations | 890 stations | 940 stations |
| Plastic bottle crushing machines | Nil | 128 stations | 215 stations |
| Rag picking contracts | 877 stations | 1,280 stations |
1,300 stations |
| Dustbins | Provided at some stations only |
Provided at all major stations |
Provided (separate for dry/wet waste) at all major stations |
| EMS(Environment Management System) (ISO: 14001) certification of Railway Stations | Nil | 8 stations | 75 stations |
| Funds allocated for station sanitation (` crore.) | 294 | 643 | 643 |
Source: Ministry of Railways.
8.26 Modernization of stations: Modernization/upgradation of Railway stations in Indian Railways is a continuous and on-going process. 1,253 stations have been identified for development under Adarsh Station Scheme and are planned to be developed by 2019-20. A dedicated SPV, Indian Railway Station Development Corporation (IRSDC) Limited has been set up to carry out modernization of railway stations. IRSDC is working on modernization of many stations on PPP mode.
Civil Aviation
8.27 India is the third largest domestic market for civil aviation in the world. India has 136 commercially-managed airports by Airports Authority of India (AAI) and 6 under Public-Private Partnerships (PPP) for Operation, Maintenance and Development of airports. The airline operators in India have scaled up their aircraft seat capacity from an estimated 0.07 annual seats per capita in 2013 to 0.12 in 2018. The comparable estimates for China, the second largest domestic market in the world, over this period were 0.33 in 2013 and 0.49 in 2018, while those of the United States of America, the largest domestic market, were 2.59 in 2013 and 2.95 in 2018.
8.28 Indian aviation re-established its resilience in the year 2019-20. Despite a large airline suspending operations on April 17, 2019, the sector swiftly sprung back to fill the void created in passenger and air cargo capacity (Figure 17). The trends in total passenger (domestic and international) and air cargo handled at airports are depicted in Figure 18 and 19, respectively. Capacity utilization is also being augmented by way of automation at airports. Overall objective is to meet the growing demand and set global best practices and performance quality standards. A total of 43 airports have been operationalized since the scheme for operationalizing unserved airports (Udan) was taken up, of which 4 were done in FY 2019-20. On airport connectivity, India stood first along with 7 others (USA, China, Japan, UK, etc.) in the Global Competitiveness Report 2019 of World Economic Forum.
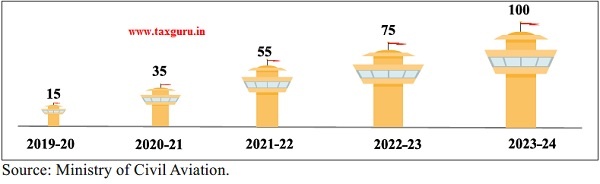
8.29 To ease the strain on existing airport capacities, 100 more airports are to be made operational by FY 2023-24 (Figure 20). Besides using 46 idle airstrips, 16 private greenfield airports, 15 AAI airports, 31 heliports, and 12 waterdromes would be developed. To bring in efficiency and resources, six airports (Ahmedabad, Guwahati, Jaipur, Lucknow, Mangalore, and Thiruvananthapuram) have been taken up for development under PPP mode. Five new greenfield airports [Durgapur (West Bengal), Shirdi (Maharashtra), Pakyong (Sikkim), and Kannur (Kerala) and Kalaburagi/ Gulbarga (Karnataka)] were successfully operationalized this year. To continue with the high growth trajectory, the Government has been providing a congenial environment so that the Indian carriers double their fleet from about 680 aircraft (number of aircrafts endorsed on Scheduled Airlines) at the close of November 2019 to over 1,200 by FY 2023-24. This would be achieved by easing leasing and financing from Indian shores in conformance with the provisions of the Cape Town Convention and Protocol on Aircraft Equipment, efficient use of air traffic rights, encouraging domestic and international passenger and goods transfers, and rationalizing the tax regime.
Figure 17: India’s Scheduled Operational Commercial Fleet (in Numbers)
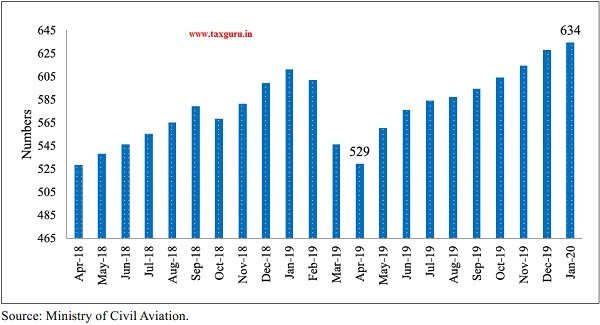
Figure 18: Passengers handled by Indian Airports (in lakh)

Figure 19: Cargo handled by Indian Airports (in thousand tonnes)
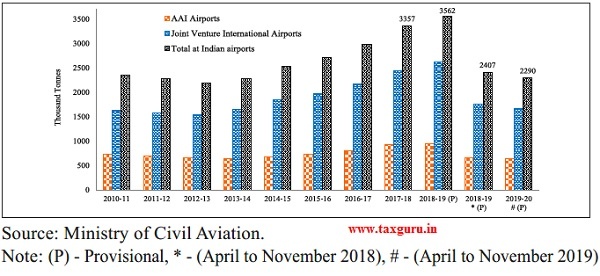
Figure 20: Additional Airport Capacity to be Developed (cumulative number of airports)
Shipping
8.30 Shipping is essential to both commodity and services trade of any country. Around 95 per cent of India’s trade by volume and 68 per cent in terms of value is transported by sea. The performance of the global shipping industry is generally mirrored by Indian shipping. India’s shipping tonnage was only 1.92 lakh Gross Tonnage (GT) on the eve of independence. It increased gradually thereafter, but was practically stagnant at around 70 lakh GT till the beginning of 2004-05. However, the tonnage tax regime introduced by the Government of India in that year boosted the growth of the Indian fleet as well as its tonnage. However, it is an undeniable fact that the after-effects of the global economic downturn are still having negative effect on the global shipping industry in general and Indian Shipping industry in particular.
8.31 As on 30th September, 2019, India had a fleet strength of 1,419 ships (Figure 21). Despite one of the largest merchant shipping fleet among developing countries, India’s share in total world dead weight tonnage (DWT) is only 0.9 per cent as on January 1, 2019 according to Institute of Shipping Economics and Logistics. The existing Indian fleet is also aging, with the average age increasing from 15 years in 1999 to 19.71 years as on October 1, 2019 (42.06 per cent of the fleet is 21 years and above and 12.49 per cent is in the 16 to 20 year age group).
Figure 21: Fleet strength of ships (in number)

8.32 Ports Sector: The Major Ports in the country have an installed capacity of 1,514.09 MTPA as in March, 2019 and handled traffic of 699.09 MT during 2018-19. While increasing the capacity of major ports, Ministry of Shipping has been striving to improve the operational efficiencies through mechanization, digitization and process simplification. As a result key efficiency parameters have improved considerably. The Average Turnaround Time in 2018-19 improved to 59.51 Hrs as against 64.43 Hrs in 2017-18. The Average Output Per Ship Berthday has increased from 15,333 Tonnes in 2017-18 to 16541 Tonnes in 2018-19 (Table 12).
Table 12: Performance Indicators of Major Ports in India
| Indicators | 2012-13 | 2013-14 | 2014-15 | 2015-16 | 2016-17 | 2017-18 | 2018-19 | 2019-20 (upto September, 2019) |
| Traffic Handled (in MMT) | 545.79 | 555.49 | 581.34 | 606.47 | 648.4 | 679.37 | 699.09 | 348.45 |
| Average Turn Around Time (in Hrs) | 101.76 | 93.6 | 96 | 87.36 | 82.32 | 64.32 | 59.51 | 64.69 |
| Average Output per-ship per berth day (in tonnes) | 11800 | 12468 | 12458 | 13156 | 14576 | 15333 | 16541 | 16014 |
| Operating surplus ` Crore) | 1807.43 | 2518.9 | 3599.4 | 4296.56 | 4979.58 | 5856.33 | 6424.36 | Not Available |
Source: Ministry of Shipping.
Telecom Sector
8.33 Total telephone connections in India grew by 18.8 per cent from 9,961 lakh in 2014-2015 to 11,834 lakh in 2018-19. As on 30 September 2019, the total subscription stood at 11,943 lakh (Figure 22) of which 5,147 lakh connections were in the rural areas and 6,796 lakh in the urban areas. Landline telephone connections were at 206 lakh while the number of wireless telephone connections stood at 11,736 lakh at the end of September The wireless telephony now constitutes 98.27 per cent of all subscriptions whereas share of landline telephones now stands at only 1.73 per cent. The overall tele-density in India stands at 90.45 per cent, the rural tele-density being 57.35 per cent and urban teledensity being 160.71 per cent at the end of September 2019. The private sector dominates with a share of 88.81 per cent (10,606 lakh connections) at the end of September, 2019 while the share of public sector was 11.19 per cent (1,336 lakh connections).
Figure 22: Total telephone connections from 2014-15 to 2019-20 (April-September) (in lakh)

8.34 Internet and broadband penetration in India has kept a rapid pace. The number of internet subscribers (both broadband and narrowband put together) stood at 6,653 lakh at the end of June 2019 as compared to 2,516 lakh in 2014. The number of mobile internet subscribers was 6,436 lakh at the end of June 2019 while the number of wireline internet subscribers was 217 lakh. Total broadband connections increased by about ten times, from 610 lakh in 2014 to 5,946 lakh in June 2019. This has accelerated the growth in internet traffic, with data usage touching the highest ever level of 462 lakh terabytes in the year 2018. India is now the global leader in monthly data consumption, with average consumption per subscriber per month increasing 157 times from 62 MB in 2014 to 9.8 GB in June 2019. The cost of data has also reduced substantially, enabling affordable internet access for millions of citizens.
8.35 Challenges: There are 4 major players in the sector – 3 in the private sector and BSNL & MTNL in the public sector, operating in mutually exclusive zones. Since 2016, the sector has witnessed substantial competition and price cutting by the Telecom Service Providers (TSPs) creating financial stress in the sector. As a result, the sector is experiencing consolidation. While some operators have filed for bankruptcy, others have merged, in their quest to improve viability. The price of data in the country is among the lowest in the world. For the quarter ending June 2019, the price of data was ` 7.7 per GB as compared to ` 200 per GB in June 2016. The Average Revenue Per User (ARPU) for GSM based mobile services has also gone down substantially from ` 126 in June 2016 to ` 74.30 in June 2019.
8.36 BSNL and MTNL are also affected by the tariff war that has impacted their cash flow resulting in mounting losses. The Government has drawn up a plan to revive these PSUs. The revival plan consists of several measures including reduction of staff cost through Voluntary Retirement Scheme, allotment of spectrum for 4G services, monetization of land/building, tower and fiber assets of BSNL/MTNL, debt restructuring through sovereign guarantee bonds and ‘in-principle’ approval for merger of BSNL and MTNL.
Telecom Infrastructure and Connectivity
8.37 (i) BharatNet: For achieving the goal of developing broadband highways as part of the Digital India campaign, the Government is implementing the flagship BharatNet Programme in a phased manner for providing broadband connectivity to all the 2.5 lakh Gram Panchayats (GPs) in the country. The project envisages an optimal mix of optical fibre, radio and satellite media. The broadband infrastructures created under the project would be available to all categories of service providers on non-discriminatory basis. (ii) Public Wi-Fi Access: Public Wi-Fi hotspots ensure last-mile delivery of broadband to users and are much easier to scale than adding new mobile towers. (iii) Towers and BTS: The number of Mobile Base Transceiver Stations (BTS) has seen a rise from 7.9 lakh in 2014 to 21.8 lakh (in July 2019) while Optical Fibre Cable has increased from 7 lakh km to around 14 lakh km during the period. (iv) Project for Left Wing Extremism (LWE) Areas and North East Region: The Department of Telecom executed a project for providing Mobile Services in 2,335 locations in Andhra Pradesh, Bihar, Chhattisgarh, Jharkhand, Maharashtra, Madhya Pradesh, Odisha, Telangana, Uttar Pradesh and West Bengal, which are affected by Left Wing Extremism (LWE) with an outlay of ` 4,781 crores.
Petroleum and Natural Gas
8.38 India is the third largest energy consumer in the world after USA and China (Figure 23). With a share of 5.8 per cent of the world’s primary energy consumption, India’s energy requirement is fulfilled primarily by Coal,
Figure 23: Top 10 Oil consumers of World in 2017
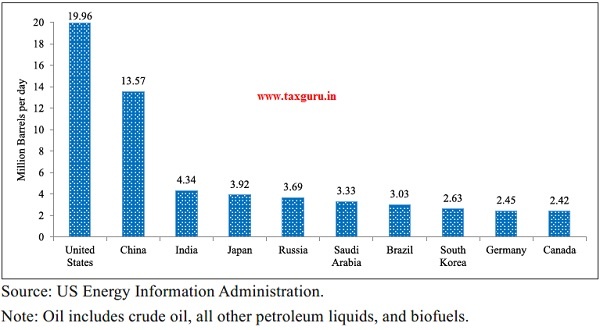
Figure 24: Trends of Oil Production of Major Economies
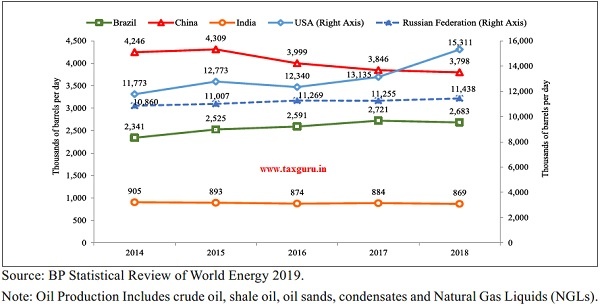
Crude Oil, Renewable Energy and Natural Gas. However, India’s oil production is one of the lowest among the major economies of the world and has been declining over a period of time (Figure 24).
8.39 During 2019-20, the domestic crude oil production is estimated to be 32.6 MMT (Economic Survey calculations). Figure 25(a) shows the trends in crude oil production that has witnessed a secular decline since 2014-15 with corresponding fall in onshore as well as offshore crude oil production. The reduction in crude oil production may be attributed to natural decline in ageing and matured fields and no major discoveries. It is worthwhile to note that the proven reserves of crude oil have decreased concurrently since 2014, with the steeper fall in onshore reserves (Figure 25(b)). However, the decline in reserves till 2018 has seen a reversal in 2019, with reserves rising from 594 MMT in 2018 to 619 MMT in 2019.
Figure 25: Onshore and Offshore Production and Reserves$ of Crude Oil
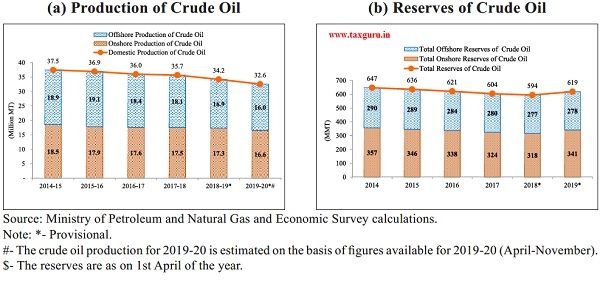
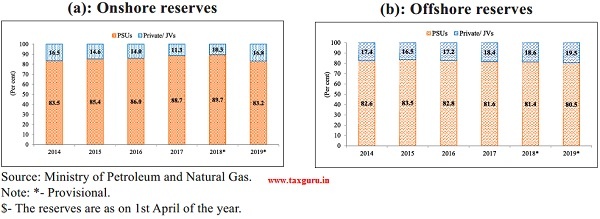
8.40 The surge in reserves of crude oil in 2019 is accompanied by corresponding increase in onshore and offshore reserves, with onshore reserves rising at a steeper rate. This may be the result of the major reforms undertaken by Ministry of Petroleum and Natural Gas in exploration and licensing policy to enhance exploration activities, attract domestic and foreign investment and accelerate domestic production of oil and gas from existing fields. It can be seen from Figure 26(a) that the share of private/ joint ventures in onshore crude oil reserves were falling till 2018, but has seen an uptick in 2019. In case of offshore reserves of crude oil, the participation of private sector is steadily rising, with the share of private/ JVs reaching to 19.5 per cent in 2019 (Figure 26(b)).
Figure 26: Share of PSUs and Private/ Joint Ventures (JVs) in Reserves$ of Crude Oil
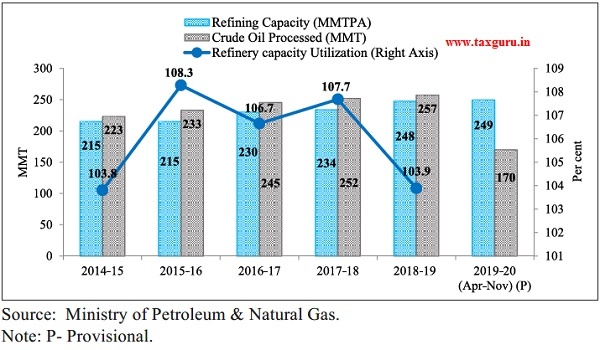
8.41 India with a refining capacity of 249.4 MMTPA is the fourth largest in the world after the United States, China and Russia. Refinery capacity increased from 234.0 MMT in 201718 to 247.6 MMT in 2018-19, while Crude Oil processed rose to 257.2 MMT in 2018-19 as against 251.9 MMT in 2017-18. However, refinery capacity utilisation fell to 103.9 per cent in 2018-19, compared to 107.7 per cent in 2017-18 (Figure 27). There is a need to augment refining capacity to meet growing demand for petroleum fuels and petrochemicals.
Figure 27: Refinery capacity and Crude Oil Processed (Quantity in Million Metric Tonnes) and Refinery Capacity Utilization (Per cent)
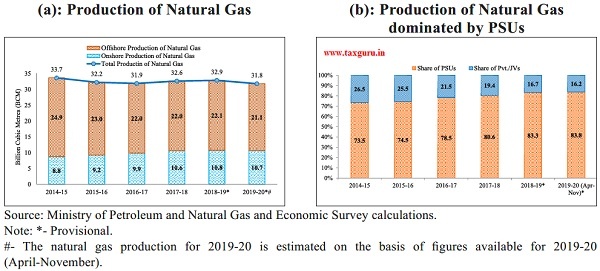
8.42 During 2019-20, the domestic production of natural gas is estimated to be 31.8 billion cubic metres (BCM) (Economic Survey calculations). Figure 28(a) shows that the declining trend in domestic production of natural gas till 2016-17 was arrested in 2017-18 and it rose further in 2018-19. The similar trend can be observed for offshore production of natural gas, while onshore production increased continuously since 2014-15. Figure 28(b) depicts that the production of natural gas is dominated by PSUs, with its share increasing over the period.
Figure 28: Total domestic Production of Natural Gas- Onshore and Offshore wise and PSUs and Private/ Joint Ventures-wise
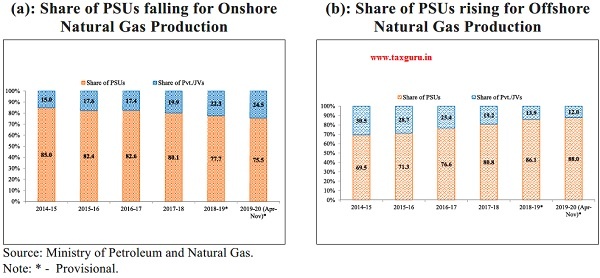
8.43 Further, Figure 29 clearly brings out that the presence of Private/ Joint Ventures has increased in onshore natural gas production over time (Figure 29(a)), while the opposite is true for offshore natural gas production, with the share of PSUs rising steadily (Figure 29(b)).
Figure 29: Share of PSUs and Private/ Joint Ventures (JVs) in Onshore and Offshore Natural Gas Production
8.44 In order to encourage the participation of private entities in oil and natural gas sector, Government has undertaken several reform measures which, inter-alia, include simplified fiscal and contractual terms, bidding of exploration blocks under Category II and III sedimentary basins without any production or revenue sharing to Government, early monetization of discoveries by extending fiscal incentives, incentivizing gas production including marketing and pricing freedom, induction of latest technology and capital, more functional freedom to National Oil Companies for collaboration and private sector participation for production enhancement methods in nomination fields, etc.
Power
8.45 Power sector in India has witnessed a paradigm shift over the years due to the constant efforts of Government to foster investment in the sector. As a result, lndia has improved its ranking to 76th position in the Energy Transition Index published by the World Economic Forum (WEF). Fostering Effective Energy Transition, 2019 Report of WEF states, “India, Indonesia and Bangladesh have made fast progress towards universal electrification due to strong political commitment, a stable policy regime, use of grid expansion, and decentralized generation sources, and a supportive environment for investment in infrastructure.”
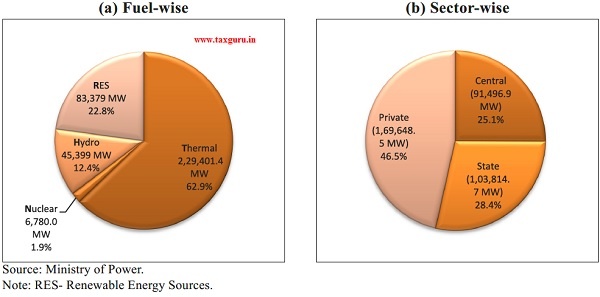
8.46 Along with universal electrification, commendable progress has been made in generation and transmission of electricity. The installed capacity has increased from 3,56,100 MW in March 2019 to 3,64,960 MW as on 31.10.2019. The fuel-wise and sector-wise distribution shows that thermal power accounts for about 63 per cent of total installed capacity (Figure 30(a)) and roughly half of the generation capacity is in the private sector (Figure 30(b)). Total generation of energy (including imports and renewable sources of energy) was 659 BU (as on 30.09.2019). In addition, the peak deficit i.e. the percentage shortfall in peak power supply vis-a-vis peak hour demand has declined from around 9 per cent in 2012-13 to 0.7 per cent during 2019-20 (October 2019).
Figure 30: Total Power Generation Capacity as on October 2019 (Fuel-wise and Sector-wise)
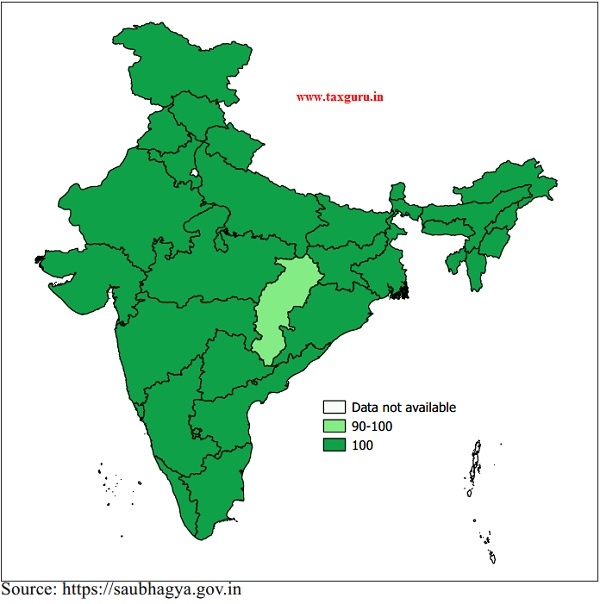
8.47 Access to electricity is necessary for making growth inclusive and for promoting ease of living. Pradhan Mantri Sahaj Bijli Har Ghar Yojana (Saubhagya) was launched on September 25, 2017 with an outlay of ` 16,320 crores to achieve universal household electrification by providing last mile connectivity by 31.03.2019. All the States have reported electrification of all households on Saubhagya portal, as on 31.03.2019, except few households in LWE affected Bastar region of Chhattisgarh (Map 2).
8.48 Supply of electricity to the rural domestic consumers is a good indicator of inclusive growth. As a result of various initiatives taken by Government of India along with the State governments, 18 States have reported supply of more than 20 hours of electricity supply while remaining states have reported about 15 or more hours. This is a major achievement compared to yester years when there were regular power cuts.
Map 2: Electrification Status
Mining Sector
8.49 As per available information, India produces as many as 95 minerals which include 4 hydrocarbon energy minerals (coal, lignite, petroleum & natural gas), 5 atomic minerals (ilmenite, rutile, zircon, uranium, and monazite), 10 metallic, 21 non-metallic and 55 minor minerals. It provides basic raw materials to many important industries. Mining and quarrying sector contribution (at current price) to GVA accounted for about 2.38 per cent during 2018-19 as per provisional estimates of Annual National Income 2018-19 published by NSO. Based on the overall trend, the Index of Mineral Production (base 2011-12 = 100) for the year 2018-19 is estimated to be 107.9 as compared to 104.9 of previous year.
8.50 There has been a notable turnaround in mineral production because of policy reforms. The production of major minerals during the year 2018-19 has recorded a growth of 25 per cent when compared to last year in terms of value (Table 13).
Table 13: Production of Major Minerals specified under MCDR Act for the years 2016-17 to 2018-19 (Value in ` ‘000)
| Minerals | Unit | 2016-17 | 2017-18 (P) | 2018-19 (P) | |||
| Quantity | Value | Quantity | Value | Quantity | Value | ||
| Bauxite | T | 24745487 | 14865504 | 22312681 | 15020673 | 23687679 | 17168251 |
| Chromite | T | 3727780 | 31937475 | 3480928 | 32109182 | 3970688 | 35836112 |
| Copper Concentrate | T | 134787 | 6506133 | 141863 | 7742763 | 155435 | 9395244 |
| Gold | Kg | 1595 | 4362410 | 1648 | 4763056 | 1664 | 5241705 |
| Iron Ore | ‘000t | 194584 | 252291800 | 200955 | 342628915 | 206446 | 451854804 |
| Lead Conc. | T | 268047 | 9669267 | 306399 | 11429378 | 358371 | 16316814 |
| Zinc Conc. | T | 1484244 | 43385599 | 1539655 | 49799283 | 1457171 | 56083774 |
| Manganese Ore | T | 2395134 | 16248429 | 2589271 | 19717530 | 2820227 | 22702512 |
| Silver | Kg | 460811 | 18320758 | 557691 | 21179042 | 679376 | 25824746 |
| Tin Conc. | Kg | 12121 | 8736 | 16758 | 10139 | 21211 | 13839 |
| Phosphorite | T | 1124440 | 2996711 | 1534269 | 3771584 | 1284580 | 3547584 |
| Diamond | Crt | 36491 | 639562 | 39699 | 410737 | 38437 | 581058 |
| Garnet (abrasive) |
T | 85413 | 787302 | 158154 | 1636667 | 123404 | 1568237 |
| Graphite (r.o.m.) |
T | 122438 | 94158 | 33558 | 25656 | 39370 | 37712 |
| Kyanite | T | 3253 | 13458 | 7818 | 23002 | 4889 | 15228 |
| Sillimanite | T | 68131 | 535949 | 81638 | 669340 | 69033 | 559792 |
| Limestone | ‘000t | 314669 | 73878426 | 338552 | 74407420 | 379049 | 84841855 |
| Limeshell | T | 12344 | 34774 | 10893 | 39593 | 7534 | 27786 |
| Magnesite | T | 299149 | 749297 | 195033 | 503919 | 146581 | 396564 |
| Marl | T | 2203700 | 317886 | 1822514 | 285095 | 1890309 | 325122 |
| Moulding Sand | T | 27685 | 6623 | 7097 | 1793 | 14423 | 3889 |
| Siliceous Earth | T | 77270 | 55340 | 58875 | 57457 | 77739 | 51897 |
| Selenite | T | 4328 | 8656 | 469 | 939 | 2906 | 5812 |
| Sulphur | T | 560825 | – | 825173 | – | 890400 | – |
| Vermiculite | T | 9042 | 8162 | 6055 | 7078 | 3161 | 3807 |
| Wollastonite | T | 166186 | 158823 |
153049 |
126700 | 184063 | 173972 |
Source: MCDR Returns, IBM.
Note: (P)- Provisional, t- Tonne, Kg- Kilogram, ‘000t- Thousand Tonnes, crt- Carats.
Housing and Urban Infrastructure
8.51 India is one of the fastest growing countries in the world with rapid urbanization. There were about 37.7 crore people residing in the urban habitats of India (Census 2011), comprising about 31 per cent of the total population which is expected to reach 60.6 crore by 2030 (2015:UN).
8.52 The Pradhan Mantri Awas Yojana-Urban (PMAY-U) was launched in June, 2015 to provide pucca house with basic amenities to all eligible urban poor. The States/UTs were mandated to conduct demand survey to estimate the housing demand in their respective cities/towns. So far, a validated demand of 1.12 crore houses has been registered. Urban habitats and cities are the epicentres of economic growth which has contributed significantly to the Indian economy. Over 60 per cent of India’s current GDP comes from the cities and towns. The construction sector accounts for 8.2 per cent of GDP which includes housing and employs about 12 per cent of the workforce1. Therefore, the investment made under PMAY (U) not only provides pucca houses to the eligible families to achieve the goal of ‘Housing for All’ but also triggers multiplier effect on the overall economy. PMAY-U is one of the largest housing schemes of the world covering complete urban India. PMAY (U) is being implemented through four verticals (Figure 31).
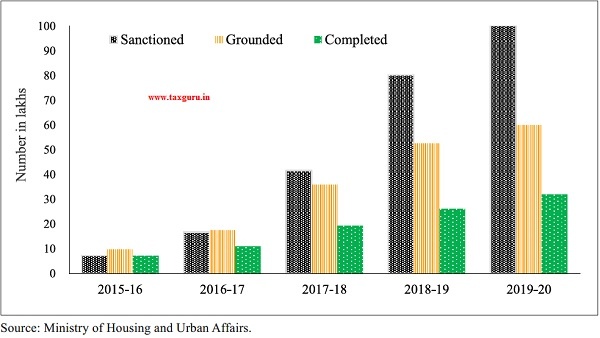
8.53 The scheme of PMAY (U) is rapidly moving towards achieving the vision for providing a pucca house to every household by 2022. Out of 1.03 crore houses approved, 60 lakhs have been grounded for construction, of which 32 lakh houses have been completed and delivered (Figure 32).
Figure 31: Different verticals of PMAY(U)
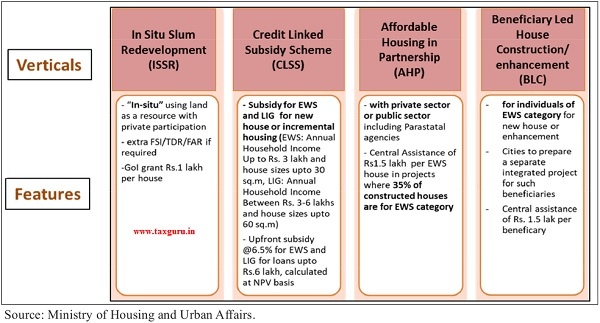
Figure 32: Physical progress of PMAY (U) (Number of Houses in lakhs) (As on 01.01.2020)
8.54 The significant progress of PMAY (U) with regard to earlier schemes is an outcome of comprehensive strategy of inclusion, scheme architecture, use of digital/space technology, funding mechanism etc. As a principle, the scheme adopts demand driven approach carrying forward the ethos of cooperative federalism. Unlike the earlier schemes, the States/UTs have been authorised to prepare and approve the projects based on city wise demand survey to meet the requirement of their housing demand. A State Level Appraisal Committee (SLAC) for Technical Appraisal of the Projects and a State Level Sanctioning and Monitoring Committee (SLSMC) under the chairmanship of Chief Secretary of the States/UTs for approval of the projects have been constituted in each State/UT. As land and colonisation is the State subject, the function of beneficiary identification based on eligibility criteria has also been entrusted to States/UTs. Such flexibility has resulted in greater participation of the States/UTs and the citizens. The scheme has mandated ownership of the house in the name of female of household or in the joint name along with male member of the household to enable women’s empowerment.
8.55 Given the large number of houses sanctioned under the Mission, arrangement for regular funding for project is vital for grounding and completion of projects. Over and above the year-on-year budgetary provisions, a separate mechanism through creation of National Urban Housing Funds (NUHF) has been approved by Union Cabinet to mobilise resources through Extra Budgetary Resources (EBR) to the tune of ` 60,000 crore for funding PMAY(U). Such arrangement has enabled the Ministry to provide Central assistance in a time bound manner for uninterrupted progress of projects with States/UTs and Central Nodal Agencies (CNAs). Government has also created an Affordable Housing Fund (AHF) in the National Housing Bank (NHB) with an initial corpus of ` 10,000 crore using priority sector lending shortfall of banks/financial institutions. The fund is used for micro financing of the HFCs and NBFCs which provide loans at reduced interest rate to the individual borrowers for promoting home ownership.
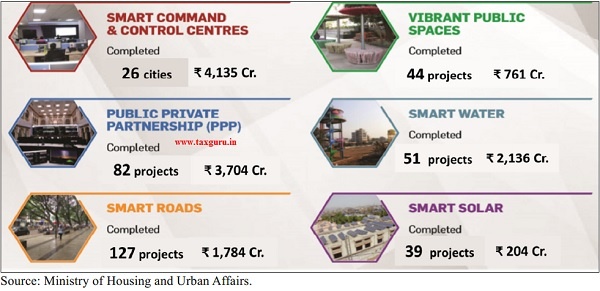
8.56 Current Implementation Status of Smart Cities Mission (SCM): All 100 cities under Smart City Mission have incorporated Special Purpose Vehicles (SPVs), City Level Advisory Forums (CLAFs) and appointed Project Management Consultants (PMCs). Since the launch of the mission, 5,151 projects worth more than ` 2 lakh crores are at various stages of implementation in the 100 cities. As on November 14, 2019, 4,154 SCM projects worth ` 1.49 lakh crores (72 per cent of the total proposals) have been tendered, of which 3,359 projects worth ` 1.05 lakh crores (51 per cent of total proposals) have been issued work orders. 1,290 projects worth ` 22,569 crores have been completed and are operational. Major achievements of Smart Cities Mission are given in Figure 33.
Figure 33: Smart Cities Mission: Major achievements (As on 14.11.2019)
WAY FORWARD
8.57 In a fast moving world to maintain growth momentum, India has to develop its industry and infrastructure. As an emerging economy, the scope for Industry 4.0 and Next generation infrastructure are enormous. To experience the potential of the perfect blend of Industry 4.0 and next generation infrastructure, it is necessary to clear the decks which are obstructing the way forward. Industry 4.0 encompasses automation in industrial sectors whereas next generation infrastructure brings physical infrastructure and technology like internet of things, automation together to maximize the efficiency of physical infrastructure. For a smooth and fast development, India needs adequate and timely investment in quality infrastructure.
8.58 To achieve the GDP of $5 trillion by 2024-25, India needs to spend about $1.4 trillion on infrastructure. The challenge is to step-up annual infrastructure investment so that lack of infrastructure does not become a binding constraint on the growth of the Indian economy. The National Infrastructure Pipeline (NIP) captures the infrastructure vision of the country for the period FY20-25. Report of the Task Force on NIP released on 31.12.2019 has projected total infrastructure investment of ` 102 lakh crore during the period FY 2020 to 2025 in India.
CHAPTER AT A GLANCE
> The industrial sector as per Index of Industrial Production (IIP) registered a growth of 0.6 per cent in 2019-20 (April-November) as compared to 5.0 per cent during 2018-19 (April-November).
> Fertilizer sector achieved a growth of 4.0 per cent during 2019-20 (April-November) as compared to (-)1.3 per cent during 2018-19 (April-November).
> India has considerably improved its ranking in Ease of Doing Business to 63rd position in 2019 compared to 77th position in 2018.
> Crude steel production witnessed growth of 1.5 per cent during 2019-20 (April-October).
> The installed capacity of power generation has increased to 3,64,960 MW as on 31 October 2019.
> Report of the Task Force on National Infrastructure Pipeline released on 31.12.2019 has projected total infrastructure investment of ` 102 lakh crore during the period FY 2020 to 2025 in India.
Note:
1. Source: Study Report on “Impact of Investments in the Housing Sector on GDP and Employment of Indian Economy” (2014), by National Council of Applied Economic Research (NCAER).


Indian MSME contibution to GDP 2011 to 2020