Every man lives by exchanging.
Adam Smith
The current environment for international trade presents India an unprecedented opportunity to chart a China-like, labour-intensive, export trajectory and thereby create unparalleled job opportunities for our burgeoning youth. By integrating ‘Assemble in India for the world’ into Make in India, India can create 4 crore well-paid jobs by 2025 and 8 crore by 2030. Exports of network products, which is expected to equal $7 trillion worldwide in 2025, can contribute a quarter of the increase in value-added for the $5 trillion economy by 2025. This chapter, therefore, articulates a clear-headed strategy to grab this opportunity. China’s remarkable export performance vis-à-vis India is driven primarily by deliberate specialization at large scale in labour-intensive activities, especially “network products”, where production occurs across Global Value Chains (GVCs) operated by multi-national corporations. Laser-like focus must be placed on enabling assembling operations at mammoth scale in network products. As an India that harbours misplaced insecurity on the trade front is unlikely to grab this opportunity, our trade policy must be an enabler. In fact, contrary to recent fears, careful analysis that controls for all confounding factors shows that India has gained from trade agreements: a 0.7 per cent increase per year in trade surplus with partner countries for manufactured products and 2.3 per cent per year for total merchandise.
5.1 Growth in exports provides a much needed pathway for job creation in India. For instance, in just the five year period 2001-2006, labour-intensive exports enabled China to create 70 million jobs for workers with primary education (Los et al. 2015). In India, increased exports explain the conversion of about 800,000 jobs from informal to formal between 1999 and 2011, representing 0.8 percent of the labour force (ILO report 2019).
5.2 The US–China trade war is causing major adjustments in Global Value Chains (GVCs) and firms are now looking for alternative locations for their operations. Even before the trade war began, China’s image as a low-cost location for final assembly of industrial products was rapidly changing due to labour shortages and increases in wages. These developments present India an unprecedented opportunity to chart a similar export trajectory as that pursued by China and create unparalleled job opportunities for its youth. As no other country can match China in the abundance of its labour, we must grab the space getting vacated in labour-intensive sectors. This chapter focuses on articulating a clear-headed strategy for the same.
5.3 Post the 1991 reforms, India’s share in merchandise (goods) exports has grown at 13.2 per cent per annum and our share in world exports has increased from 0.6 percent in 1991 to 1.7 per cent in 2018. Yet, even by 2018, India’s world market share remains paltry compared to 12.8 per cent for China. Further, merchandise exports as a percentage of GDP remained consistently lower for India compared to the world average by a significant margin (Figure 1(a)). Imports of merchandise have grown faster (at the rate of 14.9 percent per annum during 1993-2018) than exports, resulting in increasing trade deficits (Figure 1(b)). On the other hand, exports of services generally grew faster than imports, providing some cushion to current account deficit.
Figure 1(a): Share of exports in GDP, India versus World
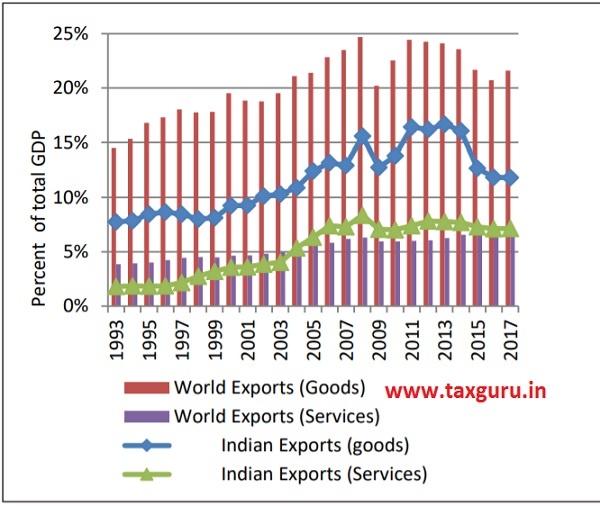
Source: UNCTAD Statistics and Survey Calculations
Figure 1(b): Share of exports in GDP, India versus World
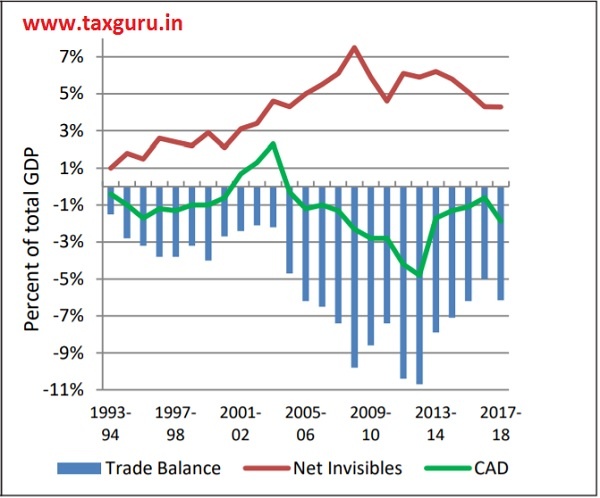
Source: Reserve Bank of India and Survey Calculations
5.4 Key questions that arise in this context are: (i) what type of policy interventions would help achieve faster export growth? (ii) should policies target export growth through specialization (intensive margin) or diversification (extensive margin)?; (iii) is it in our interest to promote strong local linkages for domestic industries or to participate in GVCs wherein linkages are globally dispersed?; (iv) which are the industries that hold the greatest potential for export growth and employment generation?; and (vi) are free trade agreements beneficial to India?
5.5 By addressing these questions, this chapter lays out the policy map to achieve sustained and faster export growth and thereby well-paid jobs. India must focus on a group of industries, referred to as “network products”, where production processes are globally fragmented and controlled by leading Multi-National Enterprises (MNEs) within their “producer driven” global production networks. Examples of network products include computers, electronic and electrical equipment, telecommunication equipment, road vehicles etc. China’s remarkable export performance vis-à-vis India is driven primarily by deliberate specialization at large scale in labour-intensive activities, especially “network products”, where production occurs across GVCs operated by multi-national corporations. By importing components and assembling them in China for the world, China created jobs at an unprecedented scale. Similarly, by integrating “Assemble in India for the world” into Make in India, India can raise its export market share to about 3.5 percent by 2025 and 6 per cent by 2030, which is highly feasible. In the process, India would create about 4 crore well-paid jobs by 2025 and about 8 crore by 2030. The incremental value added in the economy from the target level of exports of network products, which is expected to equal $248 billion in 2025, would make up about one-quarter of the increase required for making India a $5 trillion economy by 2025.
INDIA’S EXPORT UNDER PERFORMANCE VIS-À-VIS CHINA
5.6 Before outlining the potential strategies for the immediate future, the Survey examines the reasons for India’s under-performance in exports vis-à-vis China.
Specialization versus Diversification
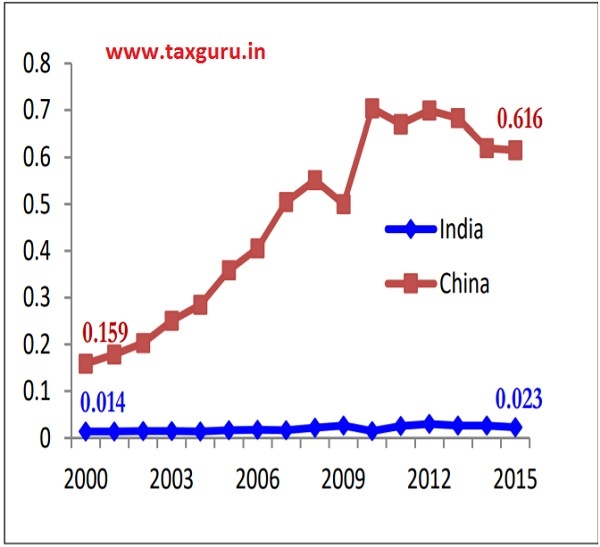
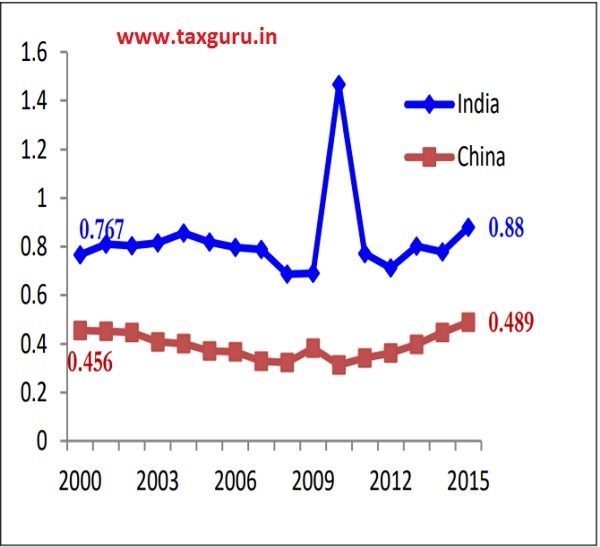
5.7 Is India’s lacklustre export performance caused by a lack of diversification in its export basket (extensive margin) or is it because of a lack of specialization (intensive margin)? This question is examined by comparing India and China on these two dimensions (see Box 1). Each country’s share of world exports of manufactured products is decomposed into the effects of diversification versus concentration (see Figure 2). It can be seen that Panel (a), which depicts the world market shares of the two countries, is a mirror image of Panel (b), which shows the contribution of specialization. Thus, China India gap in world market share is almost fully driven by the effect of specialization.
On the other hand, India is clearly catching up with China in terms of diversification across products and markets (Panel (c)). Overall,
high diversification combined with low specialization implies that India is spreading its exports thinly over many products and partners, leading to its lacklustre performance compared to China.
Figure 2: Decomposition of World Export Market Shares of India and China into Specialization and Diversification Effects, Manufactured Products, 2000 to 2015
Panel (a): World Export Share
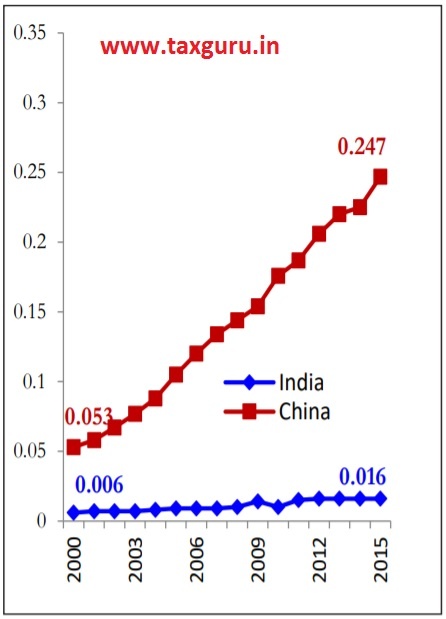
Panel (b): Specialization Effect
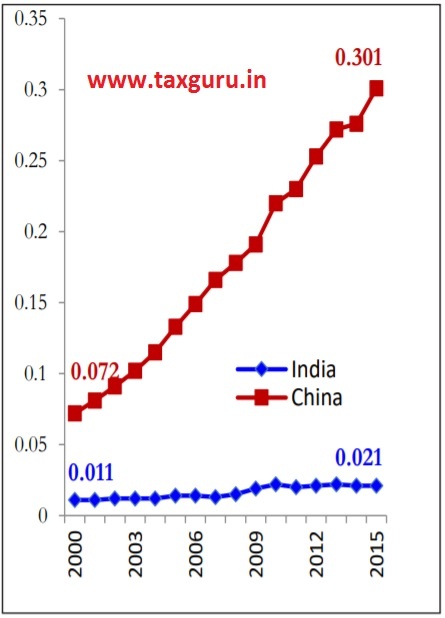
Panel (c): Diversification Effect
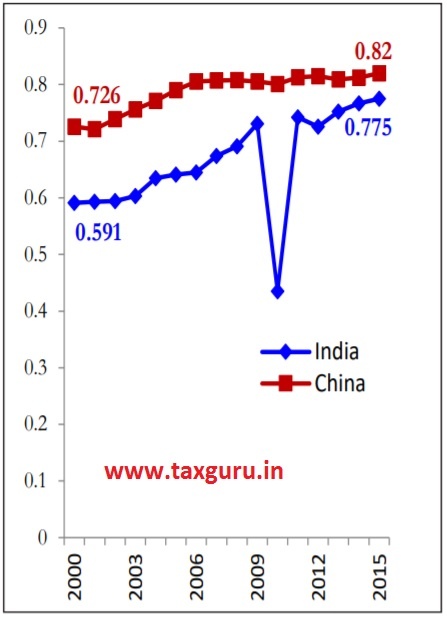
Source: Veeramani, Aerath and Gupta (2018) based on UN-Comtrade (WITS) database
Note: Following Hummels and Klenow (2005), world market shares of India and China in Panel (a) are decomposed into specialization effect in Panel (b) and diversification effect in Panel (c). For a given country and year, the world market share is obtained by multiplying the corresponding values of specialization and diversification effects.
5.8 The specialization effect can change, over the years, due to changes in the quantity and/or the prices of exported commodities.
Therefore, it is of interest to further decompose the specialization effect into quantity and price effects. Figure 3 shows that the ChinaIndia gap with respect to specialization has been fully driven by the quantity effect. The bottom line is that if India wants to become a major exporter, it should specialize more in the areas of its comparative advantage and achieve significant quantity expansion.
Figure 3: Decomposition of Specialization Effect into Quantity and Price Effects, India and China, 2000-2015
Panel (a): Quantity Effect
Panel (b): Price Effect
Source: Veeramani, Aerath and Gupta (2018) based on UN-Comtrade (WITS) database
Note: Following Hummels and Klenow (2005), specialization effect shown in Figure 2, Panel (b) is decomposed above into quantity effect in Panel (a) and price effect in Panel (b). For a given country and year, the specialization effect is obtained by multiplying the corresponding values of quantity and price effects.
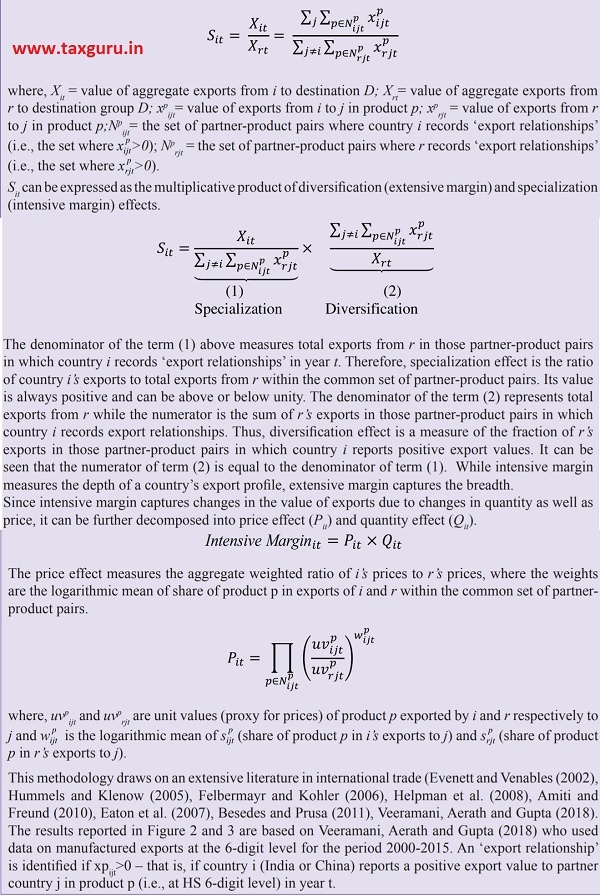
Box 1: Methodology for Decomposition into Specialization and Diversification Effects
Following Hummels and Klenow (2005), the world export market share of a given country i (India and China, in our case) in year t to a destination group D (which consists of several partner countries j) can be decomposed as follows. Let Sit stand for the export market penetration of country i relative to ‘rest of the world’ (r) in destination market D.
Low Level of Participation in Global Value Chains
5.9 Despite being abundant in labour, the share of traditional unskilled labour intensive industries in India’s non-oil merchandise exports declined by almost one half from 30.7 per cent in 2000 to 16.3 per cent in 2018 (Figure 4(a)). The fast growing commodities in India’s export basket are capital and skill intensive (see also Kochhar et al., 2006; Panagariya, 2007, Veeramani, 2012 a, Veeramani and Aerath, 2020). In fact, India’s participation in GVCs has been low compared to the major exporting nations in East and Southeast Asia (Athukorala, 2014; Veeramani and Dhir, 2017; Veeramani, 2019).
Figure 4(a): Composition of India’s Non-oil Merchandise Exports
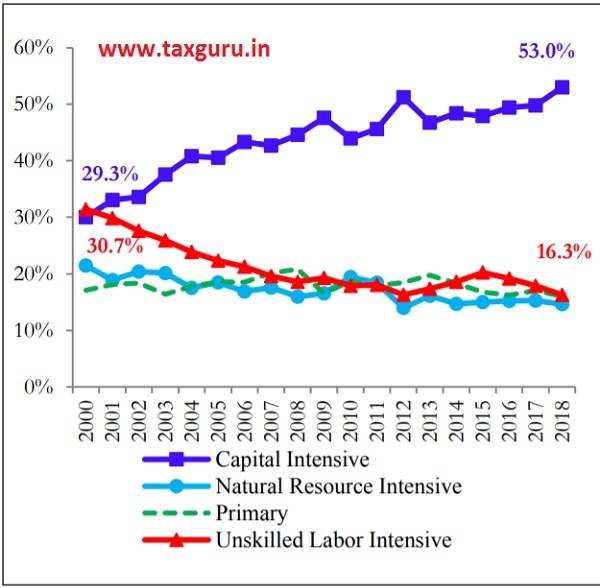
Figure 4(b): Composition of China’s Non-oil Merchandise Exports

Source: UN-Comtrade (WITS) database and Survey Calculations
Note: See Box 2 for details regarding the classification of traded products into the four categories
5.10 In contrast, China’s export composition shows a strong bias towards traditional labour intensive industries and labour-intensive
stages of production processes within capital intensive industries (in particular, assembly of electronics and electrical machinery). Notwithstanding its decline over the years, unskilled labour-intensive products account for a higher share in China’s export basket compared to India’s (Figure 4(b)). During the first decade of its trade liberalization (1980-1990) China’s export growth was mainly based on its specialisation in unskilled labour intensive products; its share in China’s export basked increased from 27.8 per cent in 1980 to 46.5 per cent in 1990. On the other hand, the share of unskilled labour intensive products in India’s export basket remained around 30 per cent during 1980-2000, before experiencing a premature decline since 2000 (Veeramani, 2012b).
5.11 While capital-intensive products account for a higher share in China’s export basket than that of India’s, it is important to emphasize two contrasting patterns. First, exports of capital-intensive products from China expanded since 2000 after the country recorded a major export expansion, for nearly two decades (1980-2000), of traditional unskilled labour intensive products. By contrast, India had not undergone a similar transition. Second, in contrast to India, export growth of capital-intensive products from China has been driven by its high level of participation in GVCs within these industries. China’s export promotion policies since the 1990s have relied heavily on a strategy of integrating its domestic industries within the GVCs. Making use of imported parts and components, China emerged as a major assembly hub for several capital-intensive products.
Box 2: Factor Intensity Classification of Traded Products
The values reported in Figure 4(a) are estimated using the factor intensity classification of the International Trade Centre (ITC), adapted by Hinloopen and van Marrewijk (2008), which distinguishes between five broad factor-intensity categories at the 3-digit level of Standard International Trade Classification (SITC). A total number of 240 products, at the 3-digit level, have been grouped into five categories: primary (83 products), natural resource-intensive (21 products), unskilled labourintensive (26 products), human capital-intensive (43 products), technology-intensive (62 products), and unclassified (5 products). The detailed classification is available at:(http://www2.econ.uu.nl/users/marrewijk/eta/intensity.htm). The capital-intensive category consists of human capital-intensive plus technology-intensive products.
Export of “refined petroleum products” (SITC 334) is not included in any of the four factor intensity categories shown in Figure 4a and 4b. Note that, as per the ITC classification, SITC 334 is part of “primary” category. Since the early 2000s, India’s exports of refined petroleum products recorded significant growth with its share in total merchandise exports increasing from 3.3 per cent in 2000 to 14.6 per cent in 2018. The export surge has been driven mainly by India’s private sector oil refineries. India imports crude oil and specializes in the refining stage of the value chain in this industry. Since petroleum refining is a highly capital-intensive process, it is appropriate to include this product in the capital-intensive, rather than primary, category (Veeramani, 2012a). Thus, if SITC 334 is treated as capital-intensive, the share of capital intensive products in India’s total merchandise exports almost doubled from 31.6 per cent in 2000 to 59.9 per cent in 2018. For China, it does not make much difference as SITC 334 accounts for a small share (about 1 per cent) in its export basket.
Low Market Penetration in High Income Countries
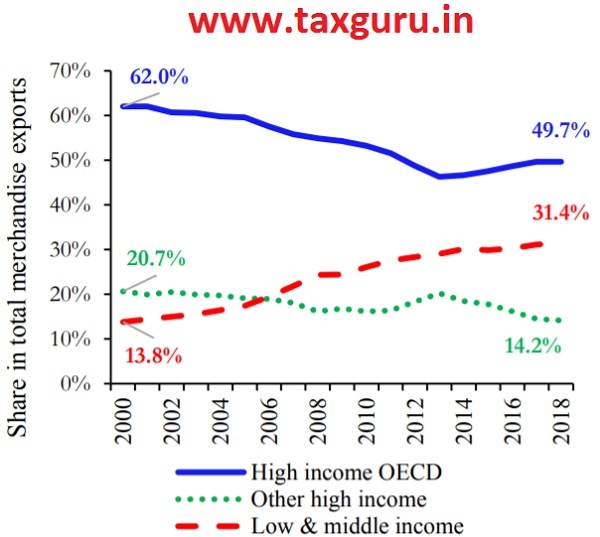
5.12 The dominance of capital intensive products in the export basket along with a low level of participation in GVCs have resulted in a disproportionate shift in India’s geographical direction of exports from traditional rich country markets to other destinations (Veeramani, 2012a, Veeramani and Aerath, 2020). The high-income OECD markets accounted for 49.7 per cent of China’s exports in 2018 (Figure 5b) while the corresponding figure for India was 40.2 per cent (Figure 5a); similarly, high-income OECD and other highincome countries together accounted for 63.9 per cent of China’s exports while that of India was 56.7 per cent.
Figure 5(a): Trading partners by income level, India
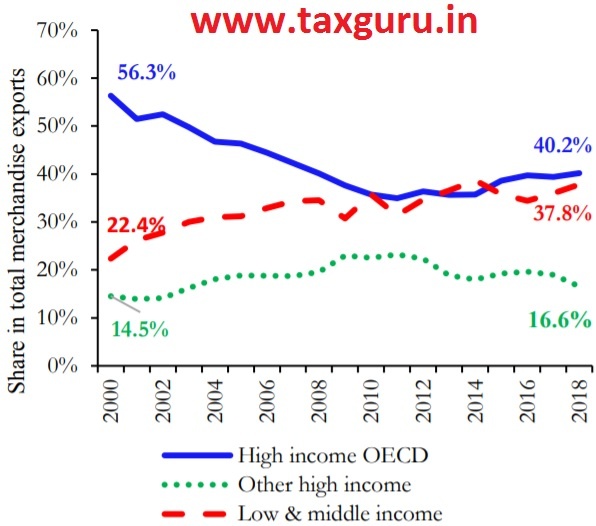
Figure 5(b): Trading partners by income level, China
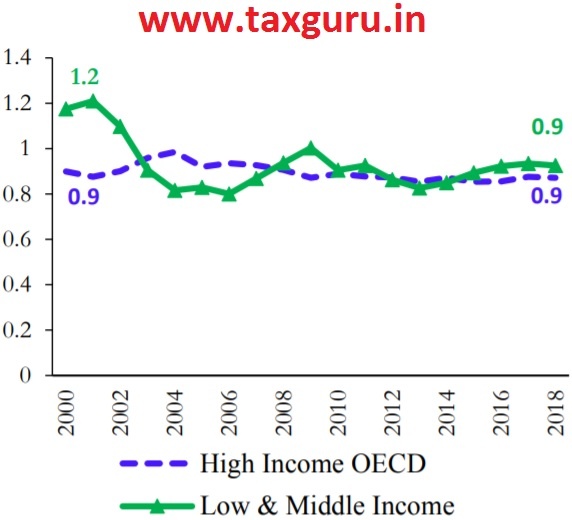
5.13 That India’s market penetration in high-income countries is perceptibly low, and has declined disproportionately during the recent decades, is not difficult to understand given the distorted pattern of its specialization. Developing countries, especially those with low level of participation in GVCs, find it extremely difficult to export capital intensive products to the quality/brand conscious markets in richer countries. In contrast to capital-intensive products, high-income countries generally provide relatively a larger market for India’s unskilled labour-intensive products (Figure 6, panel (a)). On the other hand, Chinese products, irrespective of whether they are capital intensive or unskilled labour-intensive, are able to penetrate equally both in high income and low & middle income countries (Figure 6, panel (b)). For China, this pattern is expected as it is an assembly entre for the world market, irrespective of who the buyer is.
Figure 6: Share of capital intensive exports as a ratio of the share of labour-intensive products across partner country groups
Panel (a): India
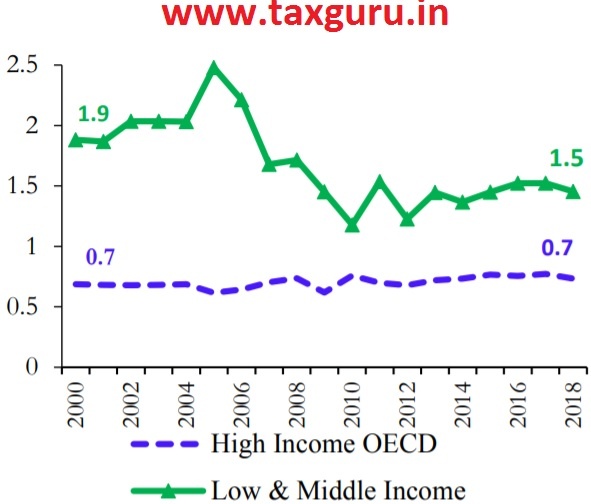
Panel (b): China
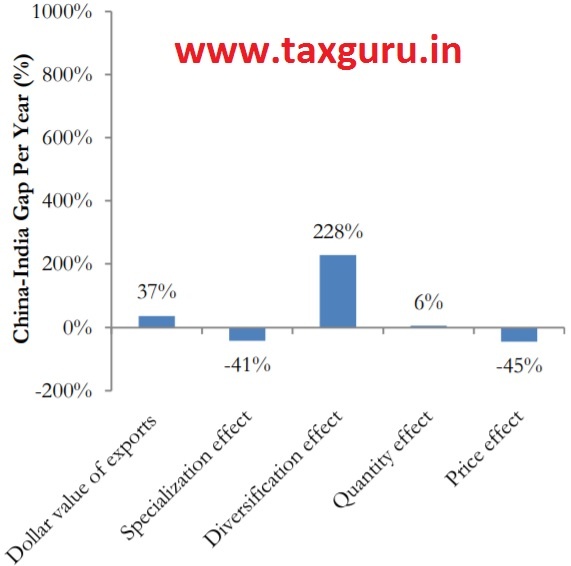
5.14 The extent of China-India gap in terms of dollar value of total exports, specialization effect, diversification effect, quantity effect and price effect is shown in Figure 7(a). These estimates are obtained from a regression analysis which controls for the effects of various factors that affect bilateral trade flows of each of the two countries. On an average, China’s export value in dollar terms exceeds that of India by about 743 per cent per year during the period 2000-2015. The bulk of this gap is accounted by specialization and quantity effects. Interestingly, however, China-India gap almost fully disappears once the effect of China’s high trade orientation with richer trading partners is taken into account (Figure 7(b)).
5.15 A general perception is that China’s exchange rate policy mainly contributed to its export success. However, as seen in Figure 2 and the subsequent ones, India’s export under-performance persists over two decades when India’s exchange rate depreciated significantly. In fact, multivariate analysis using regressions, which are omitted for brevity, shows that exchange rate does not significantly explain China-India gap. It can be concluded that China’s remarkable export performance, compared to India, is driven by a set of interrelated factors including a high level of participation in GVCs, a high degree of specialization in labour intensive production activities, large scale in the chosen sectors of specialisation, and a high level of export penetration in traditional rich country markets.
Figure 7(a): Estimates of China-India Gap (Per cent)
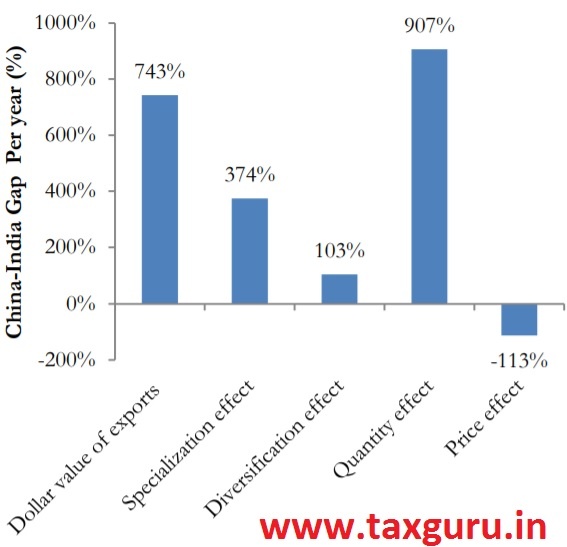
Figure 7(b): China-India Gap after controlling for China’s exports to high-income partner countries
Source: Based on regression results in Veeramani, Aerath and Gupta (2018)
Note: The regression is based on pooled bilateral export data for India and China for the period 2000-2015. The variables on the x axis are the dependent variables. Independent variables include real GDP of partner countries, real per capita GDP of trading partners, real bilateral exchange rate, real inward FDI from trading partners, dummy variables for trade agreements, China dummy (taking value 1 if exporter is China and 0 if India), partner fixed effects and year fixed effects. Estimates of China-India gap is based on the coefficient of China dummy.
5.16 In a nutshell, driven by the nature of its specialization, India has gained a competitive advantage in relatively low and middle income country markets but at the cost of losing the much bigger markets in richer countries1. Though India can benefit significantly from utilising the potential opportunities from greater trade with high income markets, this requires a reorientation of our trade specialization towards labour intensive product lines. This can be achieved both via selective focus on (i) traditional labour-intensive sectors such as textiles, especially man-made fibres, (ii) increased participation in GVCs.
REAPING GAINS FROM PARTICIPATION IN GLOBAL VALUE CHAINS
5.17 Is it desirable to promote strong local linkages for domestic industries by sourcing intermediate inputs domestically or to participate in GVCs wherein linkages are globally dispersed? The answer to this question depends on which of these strategies would result in higher levels of aggregate value added and employment within the country. A higher level of participation in GVCs implies that, for any given country, the share of foreign value added in gross exports is higher than when most inputs are sourced locally. However, owing to scale and productivity effects of selling in the world markets, participation in GVCs can lead to higher absolute levels of domestic value added and domestic job creation (Grossman and Rossi-Hansberg, 2008). See Figure 8 for the conceptual framework explaining this phenomenon. Chinese dominance of assembly in iPod and iPhone illustrates this phenomenon (Box 3). The scale effect creates millions of jobs and is therefore particularly suited for implementation in a labour-intensive economy such as India.
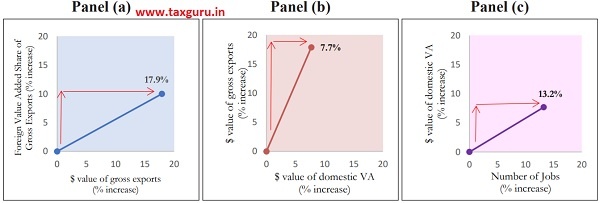
5.18 Multivariate analysis using regressions confirms that participation in GVCs, as measured by the sectoral ratio of foreign value added to gross exports, leads to higher absolute levels of gross exports, domestic value added and employment (Figure 9). It can be seen that a 10 per cent increase in foreign value added share of gross exports leads to 17.9 per cent increase in the dollar value of gross exports [panel (a) in Figure 9], which in turn, causes domestic value added (from exports) to increase by 7.7 per cent [panel (b) in Figure 9]. Finally, 7.7 per cent increase in domestic value added increases employment by 13.2 per cent. These relationships are robust to different model specifications with full set of control variables. The bottom line is that India can reap rich dividends by adopting policies aimed at strengthening its participation in GVCs.
Box 3: Example of Gain from Assembly: Apple iPod and iPhone 7 Assembly in China
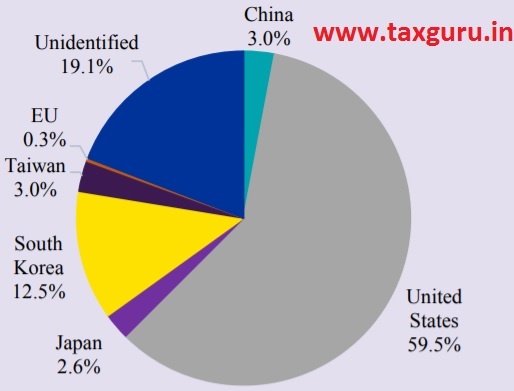
Within the iPod value chain, China specializes in assembly while parts & components are imported. The factory-gate price of an assembled iPod was estimated to be $144 in 2008, but only $4 of this constituted Chinese value added (3 per cent of factory gate price). However, China assembled almost all of the 54.83 million iPods that Apple sold, which led to aggregate domestic value added of $219 million.
Distribution of value added in Apple iPod
China makes only US$8.46 from the assembly of an iPhone 7. However, total Chinese value added is very high ($8.46 × number of iPhones sold in the world). iPod and iPhone are just two examples. There are thousands of such products, where China has emerged as an assembly centre.
Distribution of value added in iPhone 7
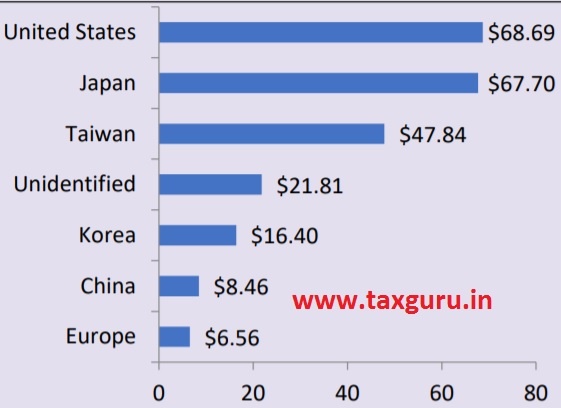
Figure 8: The Conceptual Framework for Gains from “Assembling in India” as part of “Make in India”
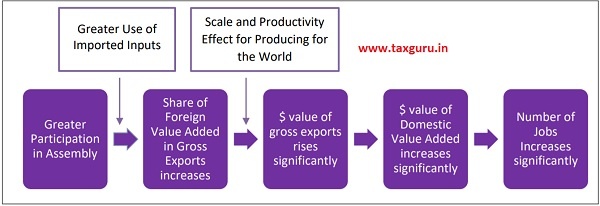
Figure 9: Gains from participation in GVCs, Empirical Evidence for India’s Manufacturing Industries
Panel (a) Panel (b) Panel (c)
Source: Based on regression results in Veeramani and Dhir (2019a) and Survey Calculations
Note: The arrows in the figure show percentage increase in the y-axis variable leading to a corresponding percentage increase in the x-axis variable. The three graphs are interlinked such that the variable in the x-axis of panel (a) is the same as that on the y-axis of panel (b) and variable in the in the x-axis of panel (b) is the same as that on the y-axis of panel (c). The estimates reported here are based on a simultaneous equation model (3SLS regressions run on a panel data set of 56 Indian manufacturing industries for the period 1999-00 to 2012-13. The regression specifications include full set of control variables, including industry and year fixed effects.
WHICH INDUSTRIES SHOULD INDIA SPECIALIZE IN FOR JOB CREATION?
5.19 Which industries should India focus on? Given our comparative advantage in labour-intensive activities and the imperative of creating employment for a growing labour force, there are two groups of industries that hold the greatest potential for export growth and job creation.
5.20 First, there exists a significant unexploited export potential in India’s traditional unskilled labour-intensive industries such as textiles, clothing, footwear and toys (Veeramani and Dhir, 2016). The GVCs in these industries are controlled by “buyer driven” networks wherein the lead firms that are based in developed countries concentrate in higher value added activities such as design, branding and marketing.
Physical production is carried out, through sub-contracting arrangements, by firms in developing countries. Examples include the production networks of Wal-mart, Nike, Adidas etc.
5.21 Second, India has huge potential to emerge as a major hub for final assembly in a range of products, referred to as “network products” (NP) (Athukorala, 2014; Veeramani and Dhir, 2017). The GVCs in these industries are controlled by leading MNEs such as Apple, Samsung, Sony etc. within “producer driven” networks. In general, these products are not produced from start to finish within a given country; instead, countries specialize in particular tasks or stages of the good’s production sequence. Within the production network, each country specializes in a particular fragment of the production process; this specialization is based on the country’s comparative advantage. Labour abundant countries, like China, specialize in low skilled labour-intensive stages of production such as assembly while the richer countries specialise in capital and skill-intensive stages such as R&D. Thus, the lead firms retain skill and knowledge-intensive stages of production in high-income headquarters (e.g., the U.S.A, E.U and Japan) but locate assembly related activities in low wage countries (e.g., China and Vietnam). The rest of the discussion in this Chapter focuses on India’s growth potential in NP.
5.22 Athukorala (2011) identified six groups of NP, based on Standard International Trade Classification (SITC) nomenclature, where global production sharing is most prevalent (Table 1). Together, NPs accounted for nearly 30 per cent of world exports in 2018, with the share of Electrical Machinery (SITC 77) being the highest at 10.4 per cent. Using trade data at a detailed level of disaggregation and the UN-Broad Economic Categories (BEC) system, it is possible to disentangle total trade in these NP into its two main sub-categories – parts & components (P&C) and assembled end products (AEP).
Table 1: World Exports of Network Products, 2018
| SITC Code | SITC Description | World Exports, 2018 (trillion US$) | Share in Total World Exports, 2018 (per cent) |
| 75 | Office machines and automatic data processing machines | 0.83 | 4.37 |
| 76 | Telecommunication and sound recording equipment | 0.65 | 3.42 |
| 77 | Electrical Machinery | 1.97 | 10.44 |
| 78 | Road Vehicles | 1.55 | 8.23 |
| 87 | Professional and scientific equipment | 0.48 | 2.53 |
| 88 | Photographic Apparatus | 0.12 | 0.66 |
| Total Network Products | 5.59 | 29.6 |
Source: UN Comtrade (WITS) Database
Note: Based on import data reported by all countries in 2018.
World Exports of Network Products: Trends and Patterns
5.23 The world exports of NP increased steadily from US$ 2.01 Trillion in 2000 to US$ 5.41 Trillion in 2018 (Figure 10(a)). The increase was mainly driven by AEP whose value rose from US$ 1.11 Trillion to US$ 3.93 Trillion. On an average, NP accounts for about 42 per cent of world manufactured exports. The average share of AEP exports in total NP exports increased from about 59 per cent during 2000-2016 to about 72 percent during the last two years (2017-2018).Asia’s share in world exports of NP increased phenomenally from about 37 per cent in 2000 to 51 per cent in 2018 while the shares of both Europe and America declined (Figure 10(b)). East Asia accounted for the bulk of total Asian exports followed by Southeast Asia (Figure 10(c)). Rest of Asia (including South, Central and Western Asia) accounted for just 3 per cent of the total Asian exports.
Figure 10: Trends and Geographic Distribution of Network Product Exports, 2000 to 2018
Figure 10(a): Trends in world exports
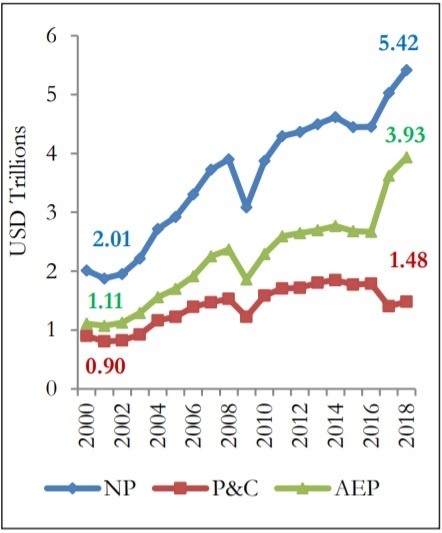
Figure 10(b): Geographical Distribution of NP World Exports
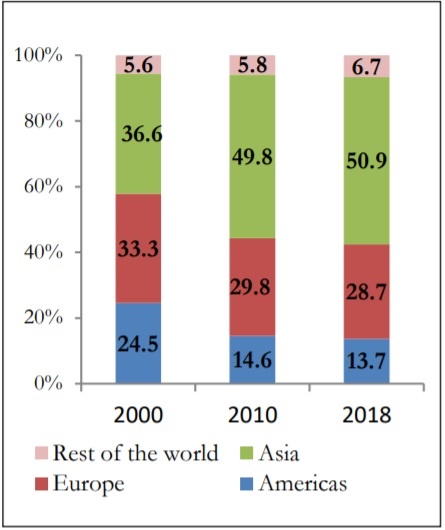
Figure 10(c): Distribution of Asian NP Exports
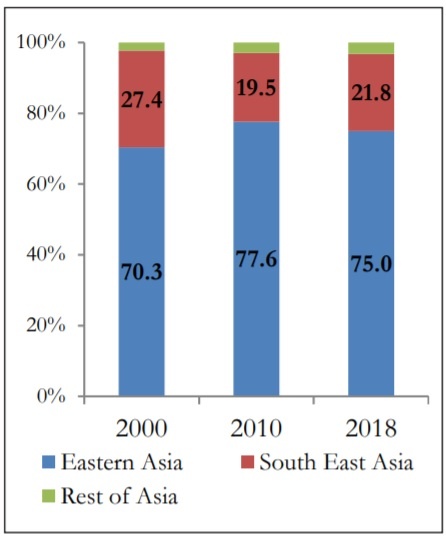
Source: UN Comtrade (WITS) database and Survey Calculations
Note: NP stands for Network Product, P&C and AEP stand for Parts & Components and Assembled End Products respectively within the group of Network Products. Estimates are based on mirror statistics (imports reported by trading partners) for a fixed set of 118 countries that have reported import data for every year during 2000-2018. In 2018, these 118 countries accounted for 96.8 per cent of total world trade in NP.
India in Comparison to East and Southeast Asia
5.24 Even as India’s export of NP increased from about US$2 billion in 2000 to US$32 billion in 2018, its participation in this market remains miniscule compared to that of other Asian countries (Figure 11). The share of NP exports in total national merchandise exports by each country is shown in Figure 12(a). It is evident that, despite some increase, NP exports accounts for a very small share (10 per cent in 2018) in India’s export basket. In contrast, these products account for about one half of the total national exports of China, Japan and Korea. Between 2000 and 2018, the share of NP in the export basket has increased by 41 percentage points for Vietnam and by 18 percentage points for China.
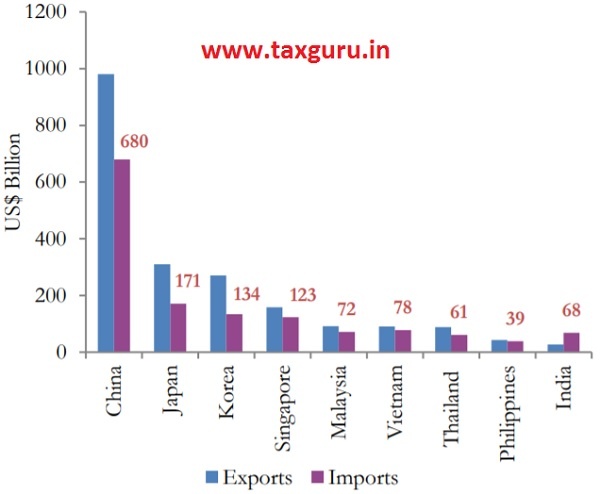
5.25 Among the major Asian countries, India and Indonesia are the only ones with a trade deficit in NP (Figure 12(b). India’s import value of $68 billion in 2017 is higher than that of Thailand ($61billion) and Philippines ($39 billion) even as the latter two countries record significantly higher level of exports than India. India’s import basket mostly consists of electronics and electrical machinery, primarily meant for domestic final use (Tewari and Veeramani, 2016).
Figure 11: Exports of NP by Asian Countries, USD Billions, 2000 to 2018
Panel (a): Early entrants
Panel (b): Late entrants and laggards
Source: UN Comtrade (WITS) Database and Survey Calculations
Notes: China’s export values are in secondary axis in Panel(b). Estimates are based on export data reported by each country. Vietnam has not reported data for the year 2018.
Figure 12(a): Share of NP in India’s merchandise export basket is very low
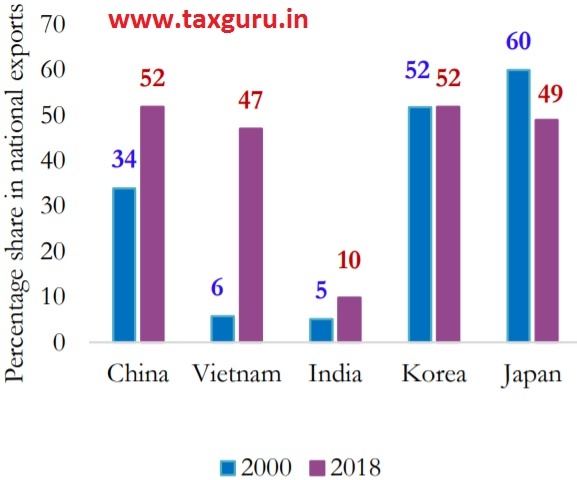
Figure 12(b): Among the major Asian countries, India is the only one with trade deficit in NP
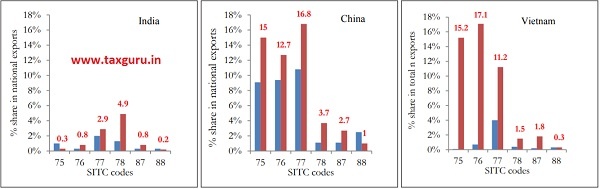
5.26 Turning to the product group composition of India’s NP exports, the percentage shares of four product groups recorded an increase in 2018 as compared to 2000 (Figure 13). These are: Road vehicles (SITC 78), Electrical machinery (SITC 77), Telecommunication and sound recording equipment (SITC 76), and Professional and scientific equipment (SITC 87). The main category of NP exported by India is Road vehicles with a share of 4.9 per cent in its total exports in 2018 (up from 1.3 per cent in 2000). In contrast, Electrical machinery, which accounts for the largest share in the export baskets of China (16.8 per cent) and Korea (30.5 percent), accounts for less than 3 per cent of India’s total exports. Apart from electrical machinery, other two sub-categories where India can achieve significant export growth are:(i) Office machines and automatic data processing machines (SITC 75) and (ii) Telecommunication and sound recording equipment (SITC 76).
Figure 13: Shares of NP sub-categories in National Export Basket
Source: UN Comtrade (WITS) database and Survey Calculations
Note: The description of the SITC codes are: Office machines and automatic data processing machines (SITC 75); Telecommunication and Sound Recording Equipment (SITC 76); Electrical Machinery (SITC 77); Road Vehicles (SITC 78), Professional and scientific equipment (SITC 87); Photographic Apparatus (SITC 88).
5.27 Several leading automobile companies have established assembly plants in India and some of them have begun to use India as an export base within their production networks (see the discussion in Box 4). Since the early 2000s, India’s exports of assembled cars (completely built units) have increased at a much faster rate than automobile parts (Athukorala and Veeramani, 2019). The case of mobile phone assembly is another recent success story for India (see Box 5). In contrast to auto industry, the MNEs that have set up production bases in India’s electronics and electrical goods industries have been mainly involved in production for the domestic market (Athukorala, 2014, Tewari and Veeramani, 2016).
Box 4: Learnings from Integration into GVCs by Indian Automobile Industry
After Government of India established Maruti Udyog Limited (MUL) in 1981, MUL entered into a license and joint venture agreement with Suzuki Motor Co Ltd in 1982. Suzuki acquired 26 per cent stake in MUL in return for providing latest technologies and management practices. The company started its operation with the import of totally assembled cars in Japan, followed first by assembly of semi- knocked down (SKD) packs and then by completely- knocked down (CKD) packs supplied by Suzuki. During the early stage, assembly of cars in India involved fitting low-technology and low-value components and equipment into the imported car (Hamaguchi, 1985). During 1985-89 the import value of auto components shot up rapidly (D’Costa, 1995). India’s imports of auto parts from Japan increased from US$4 million in 1980 to US$155 million in 1986, accounting for 77 per cent of India’s total auto parts imports. However, with the development of domestic auto ancillary industry, imports of auto parts declined sharply since the late 1980s. In the meanwhile, the success of the joint venture led Suzuki to increase its equity from 26 per cent to 40 per cent in 1987, to 50 per cent in 1992, and further to 56.21 per cent in 2013. Indian government sold the remaining 18 per cent of its shares in 2007.
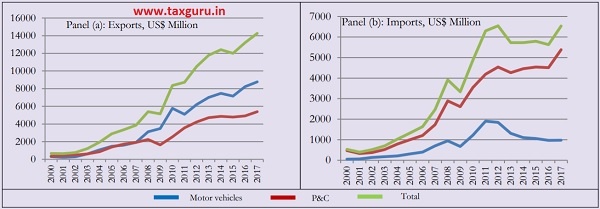
Following the entry of Suzuki, other major Japanese automobile manufacturers (Toyota, Mitsubishi,Nissan, and Mazda) arrived (Athukorala and Veeramani, 2019). Several Tier 1 automobile parts suppliers (such as Denso, Aisin Seiki, and Toyota Boshoku) and global automobile parts producers arrived (such as Robert Bosch, Delphi, Magna, Eaton, Visteon, and Hyundai Mobil). Hyundai was the first automobile MNE to establish a 100 per cent subsidiary in the country. Volkswagen, Nissan, BMW, and Isuzu Motors followed suit. Companies that first entered as joint ventures, such as Honda, Ford, Fiat, and Renault severed links with their local partners and established 100 per cent subsidiaries. From about the early 2000s, the Indian automobile industry has undergone a remarkable transformation from production for the domestic market, which remained its modus operandi for over a half century, to global integration. The country has emerged as a major assembly centre for compact cars (Athukorala and Veeramani, 2019). India’s exports of completely built units (CBUs) increased from about US$225 million in 2001 to US$8.8 billion in 2017, while exports of parts and accessories increased from US$408 million to US$5.5 billion between these two years (see panel (a) in the figure below). The pattern is quite different on the import side with parts and accessories growing significantly faster than assembled vehicles during the same period (see panel (b) in the figure below). In 2017, the import value of assembled vehicles stood below US$1 billion compared to about US$5.4 billion worth of imports of parts and accessories. While assembled motor vehicles constitute the bulk of India’s automobile exports, parts and accessories account for the lion’s share of total automobile imports. This pattern is consistent with the emergence of India as an assembly centre for automobiles. The key learning from the successful case study of the Indian Automobiles sector is that domestic firms graduate up the production value chain by first starting with low-technology operations such as assembly and then moving to manufacturing of components. In the process, imports of components increase in the short run. Following a policy of import substitution right from the outset does not enable the process of graduation up the production value chain.
Exports and imports of motor vehicles versus and parts & components (P&C)
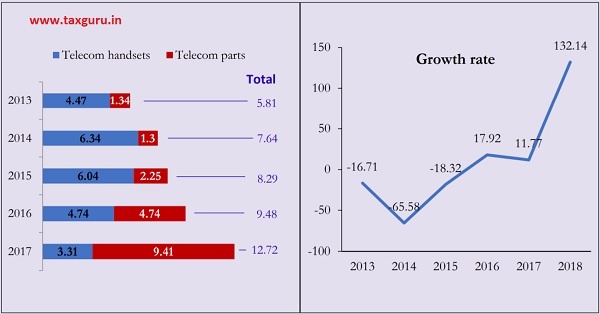
Box 5: Assembly of mobile phones in India
India toppled Vietnam to become the second largest manufacturer of mobile phones globally following China in 2018 with a world share of 11 per cent. India could manufacture around 1.25 billion handsets across various segments by 2025, firing up an industry worth around $230 billion (ICEA-McKinsey report, 2018). Between 2013 and 2017, while India’s import of telecom handsets declined from US$4.47 billion to US$3.31 billion that of telecom parts increased steadily from US$1.34 billion to US$9.41 billion. At the same time exports of telecom handset increased significantly during the last three years. This pattern is consistent with the emergence of India as an assembly centre for telecom handsets.
Imports, US$ Billion and Exports of telecom handsets
PATTERN OF ENTRY
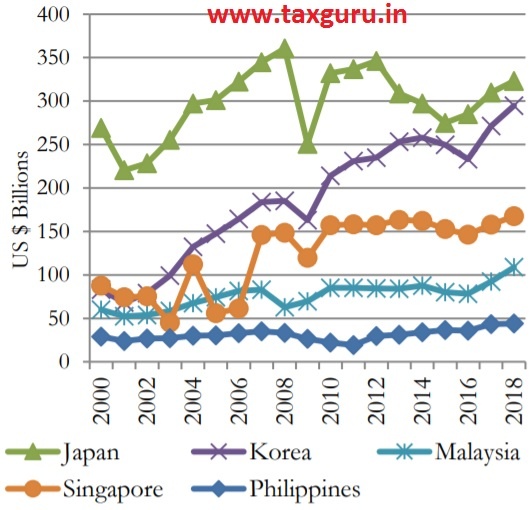
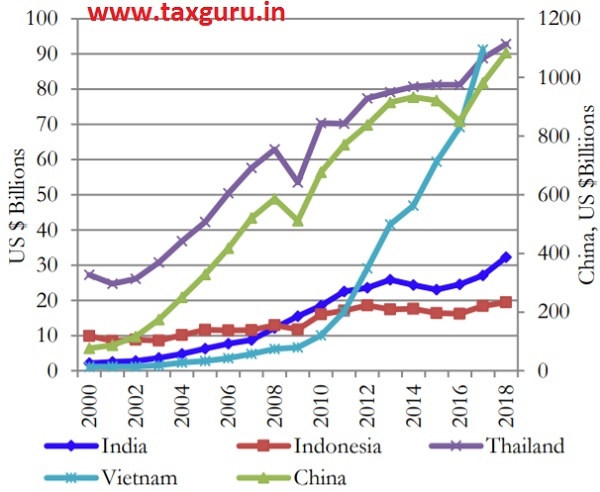
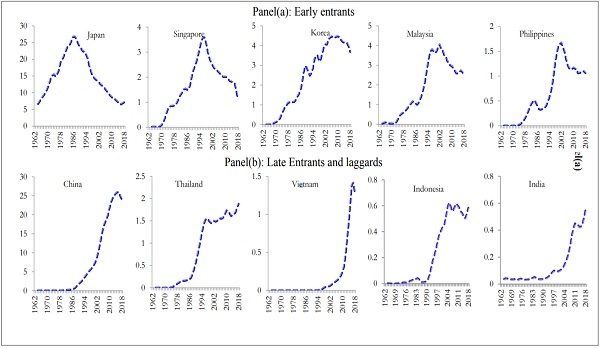
5.28 The pattern of entry, rise, survival, and relative decline of countries in the export market for NP is consistent with the “wildgeese flying model” formulated by Japanese economist Kaname Akamatsu during the 1960s. The first Asian country to enter the export market for NP was Japan followed by a number of East and Southeast Asian countries. Japan, the lead goose, provided capital, technology and managerial knowhow to “follower geese” countries in East and Southeast Asia. “Wild geese fly in orderly ranks forming an inverse V, just as airplanes fly in a formation” (Akamatsu, 1962, p.11). The export market participation of several of the Asian countries, over the years, indeed depicts an “inverted V” pattern (see Figure 14). Panel (a) in the figure depicts the pattern for the early entrants – Japan, Korea, Singapore, Malaysia and Philippines. Panel (b) shows the pattern for the late entrants (China, Thailand and Vietnam) and laggards (India and Indonesia). Among the late entrants, China seems to have reached the inflection point of “inverted V” while Thailand and Vietnam are on the rising part of the curve. A comparison of the charts shows that the take-off process in NP exports may be beginning in India.
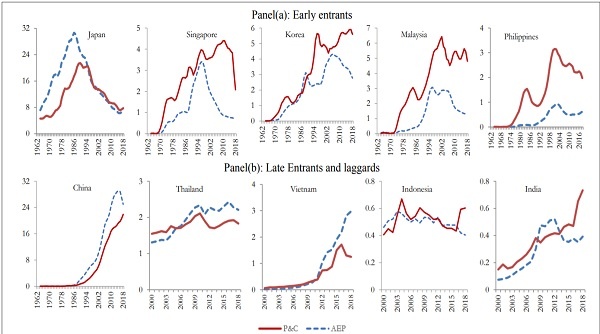
5.29 Larger countries like Japan and China, which have survived in the market for longer periods of time, took off with an expansion of assembled end products (AEP) while parts & components (P&C) followed suit (Figure 15). Japan’s descent on the inverted V-path also began with AEP in 1985 followed by P&C circa 1993. China seems to have reached the inflection point of the inverted V-curve for AEP circa 2015 while its world market share in P&C continues to increase. The most recent entrants, Thailand and Vietnam, have taken off with an expansion of AEP exports while P&C is following suit. For India, P&C has recorded some growth in recent years while AEP, with exceptions such as passenger cars and telecom handsets, has declined.
Figure 14: Wild Geese Flying Pattern of Exports in Network Products, 1962-2018
Source: Veeramani and Dhir (2019b)
Note: Values on the vertical axis are the world export market shares (three year moving averages) of the respective country. Estimates are based on mirror statistics (imports from each of the Asian countries reported by trading partners) for a fixed set of 28 countries that have reported import data for every year during 1962-2018. Share of these 28 countries in world exports was about 55 per cent.
Figure 15: Wild Geese Flying Pattern of NP Exports – Assembled End Products (AEP) versus Parts & Components (P&C)
Source: Veeramani and Dhir (2019b)
Note: Values on the vertical axis are the world export market shares of the respective country. Estimates are based on mirror statistics (imports from each of the Asian countries reported by trading partners). For the group of early entrants and China, the estimates are based on import flows reported by a fixed set of 28 countries that have reported data for every year during 1962-2018. For late entrants and laggards (except China), the estimates are based on mirror statistics for a fixed set of 118 countries that have reported import data for every year during 2000-2018.
POTENTIAL GAINS IN EMPLOYMENT AND GDP
5.30 The policy of focusing on NP can create significant gains both in employment creation and GDP growth. Let’s consider a scenario in which India follows the trajectory similar to that of China’s initial period of export expansion. During the first ten years of its take off, China progressively increased its share in world exports of NP from 0.7 per cent in 1987 to 6.1 in 1998. What would be the impact on India’s GDP and employment if the country mimics China’s initial export growth performance – that is, assuming that India can increase its world export share for NP from the current level of 0.6 per cent to over 6 per cent by 2030? See Box 6 for a detailed discussion of the method and assumptions used for assessing the potential gains from an accelerated growth of NP exports from India.
5.31 Table 2 shows that, under the “business as usual scenario”, the world exports of NP will increase from the current actual value of US$5.6 trillion in 2018 to the projected value of US$6.9 trillion in 2025 and US$ 8.1 trillion in 2030. During this period, India’s exports of NP is projected to increase from the current actual value of US$32.3 billion in 2018 (accounting for 0.6 per cent of world exports) to US$ 248.2 billion in 2025 (3.6 percent of world exports) and US$ 490.7 billion in 2030 (6.1 per cent of world exports).
Table 2: Predicted values of NP exports for World and India, 2020-2030
| Year | World exports of NP (US$ Trillion) | World exports of NP (US$ Trillion) | India’s Share in World Exports (per cent) |
| (1) | (2) | (3) | (4) |
| 2020 | 5.94 | 69.4 | 1.2 |
| 2025 | 6.92 | 248.2 | 3.6 |
| 2030 | 8.06 | 490.7 | 6.1 |
Source: Survey calculations
Note: See Box 6 for the assumptions used for predicting the values.
5.32 Domestic value added (DVA) from India’s predicted exports is estimated at US$ 166.5 billion in 2025 and US$ 304.7 billion in 2030 (Table 3). Total number of jobs attributed to exports (direct employment in NP sector plus employment caused by NP sector’s backward linkages with other sectors supplying inputs to the former) will go up from 4.4 million in 2020 to 14.3 million in 2025 and 25.5 million in 2030. Thus, based on the first-order effects of the scenario under consideration, it is possible to create 10 million additional export related jobs during the next five years and over 20 million jobs during the next ten years.
5.33 However, it is important to take into account the second-order effect of increased consumption by workers. The overall impact on jobs (first order plus second order effect) is much higher (see Table 4). Our estimates suggest that, by raising India’s share in world exports of NP to 3.6 per cent by 2025, it is possible to create 38.5 million additional jobs in the country during the next five years. Further, by raising this share to 6.1 per cent by 2030, it is possible to generate additional 82.2 million jobs during the next ten years. The total domestic value added (in basic prices) is likely to increase from US$168 billion in 2020 to US$1134.3 billion by 2030. Between 2019 and 2025, the incremental value added is US$485.5 billion, which is one-quarter of the increase in GDP (in basic prices) required for making India a $5 trillion economy by 2025.
Table 3: Impact of Accelerated Growth of NP Exports on Employment and GDP in India, First and Second Order Impacts
| First-order impacts | Second-order impacts | |||||
| Year | Domestic value added from exports (US $ Billion) | # of jobs tied to NP exports (Millions) | Wage Income (US $ Billion) | Wage income (US $ Billion) | Domestic value added (US $ Billion) | #of jobs (Millions) |
| (1) | (2) | (3) | (4) | (5) | (6) | |
| 2020 | 50.1 | 4.4 | 24.8 | 82.5 | 117.9 | 25.7 |
| 2025 | 166.5 | 14.3 | 88.4 | 294.4 | 420.4 | 83.0 |
| 2030 | 304.7 | 25.5 | 174.5 | 580.9 | 829.6 | 148.0 |
Source: Survey calculations
Note: See Box 6 for various methods and assumptions used for assessing the impact
Table 4: Overall Impact (First plus Second Order) employment and GDP
| # of Jobs (Millions) | Value added (US$ Billion) | |
| 2020 | 30.1 | 168 |
| 2025 | 97.3 | 586.9 |
| 2030 | 173.5 | 1134.3 |
Source: Survey calculations
Note: See Box 6 for various methods and assumptions used for assessing the impact
Box 6: Methods and Assumptions used for assessing the potential gains on GDP and employment by increasing India’s exports of network products
The forecasted values of world exports in Table 2 is based on the “business as usual” scenario, wherein it is assumed that the trend growth rates of world exports of NP during 2010-2018 (3.1 per cent per year) would continue for the forecast period (2019-2030). India’s export values for 2020-2030 are predicted by assuming that India can mimic China’s export performance in world market share during the first decade (1988-1998) of China’s export market entry in NP.
The domestic value added (DVA) from exports (Column 1, Table 3) is estimated using the ratio of DVA to gross exports for NP. These ratios are estimated using input-output (I-O) tables. The advantage of the I-O framework is that it enables us to disentangle the direct and indirect effects (backward linkages) of exports from any given sector. For the year 2017-18, the DVA (direct plus indirect) share of India’s gross exports of NP was 74.1 per cent. We assume that this share will progressively reduce by 1 percentage points every year (driven by increased use of imported intermediate inputs), so that it will become 67.1 per cent by 2025 and 62.1 per cent by 2030.
Similarly, the number of jobs attributed to NP exports (Column 2, Table 3) is obtained by using available estimates that make of use of I-O methodology. It is estimated that 1 million US$ worth of NP exports from India generated 67.6 jobs in 2017-18. We assume that this number will progressively reduce by 2 per cent every year (driven by labour productivity improvements), so that it will become 57.5 by 2025 and 52 by 2030.
The annual wage income for workers (Column 3, Table 3) is obtained by multiplying the annual wages and salaries (in US$) with total number of jobs created by exports every year. Wages and salaries for workers are obtained from UNIDO’s industrial statistics. For the year 2017, the annual wages and salaries in India’s NP industries was US$5287. We assume that this will progressively increase by 2
per cent every year (driven by labour productivity improvements), so that it becomes US$6194.5 by 2025 and US$6839.3 by 2030.
The first-order impacts are estimated by using the Type-1 multipliers (direct plus backward linkages) in I-O analysis. The second-order impact arises from additional household spending as a result of increased wage income for workers (Type-2 multipliers). The marginal propensity to consume (MPC) for the Indian household is estimated to be about 0.7. Accordingly, the value of income multiplier (1/1-MPC) is estimated as 3.33. Applying this multiplier to the initial wage income (Column 3, Table 5), we obtain the second order impact on wage income (Column 4, Table 3).
The second-order impact on domestic value added is obtained as follows. First, we obtain the difference in wage income (DWage) by subtracting initial wage income (first-order effect) from the final wage income (second-order effect). Second, by dividing DWage by the ratio of aggregate labour income to aggregate value added for Indian economy, we obtain the second-order estimate of domestic value added. Using India KLEMS database, the ratio of labour income to value added for the year 2016 was estimated to be 0.49.
In order to obtain the second order impact on jobs, we first convert the second-order estimate of domestic value added to gross output as follows:
Gross output = domestic value added (second order estimate) / ratio of gross value added (GVA) to gross output for the Indian economy.
The estimated ratio of GVA to output is 0.5 for the year 2015-16 (Source: Supply Use Table, CSO). Survey estimates shows that 1 million US$ worth of output created 116 jobs (direct plus indirect) in India in 2017-18. We assume that this number will progressively reduce by 2 per cent every year, reflecting the improvements in labour productivity.
ARE FREE TRADE AGREEMENTS BENEFICIAL?
5.34 Given the recent debate about India joining the Regional Comprehensive Economic Partnership (RCEP) agreement, questions have been asked about the general efficacy of free trade agreements (FTAs). An apprehension is that most of the FTAs that India had signed in the past had not worked in “India’s favour.” The argument that is put forward is that the agreements led to worsening of India’s trade deficit with the partner countries with which the agreements have been signed. This is the mercantilist way of evaluating the gains from trade. Basic trade theory teaches us that a country’s gains from free trade arise from the fact that it leads to a more efficient allocation of a country’s resources. Yet, does the evidence support the naïve mercantilist’s perspective?
5.35 Table 5 shows India’s trade agreements signed between 1993 and 2018. Figure 16 shows the impact of these agreements on the percentage changes of dollar values of India’s exports and imports. These results are based on regressions specifications that take into
account full set of confounding factors, including GDP and per capita income of trading partners, partner country fixed effects and year fixed effects. A simple before-and-after comparison, without controlling for the confounding factors, could lead to misleading conclusions.
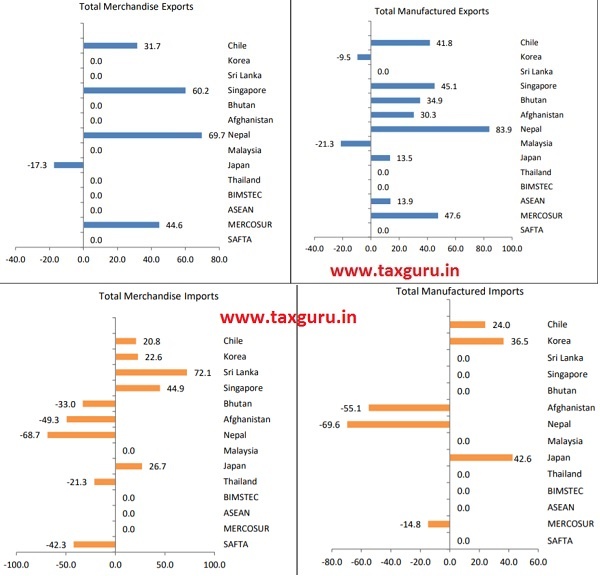
5.36 It can be seen that, manufactured products from India has clearly benefitted from eight out of the fourteen trade agreements considered here. These are: MERCOSUR, ASEAN, Nepal, Singapore, Chile, Bhutan, Afghanistan and Japan. Four of the agreements (SAFTA, BIMSTEC, Thailand and Sri Lanka) had no effect on exports of manufactured products while the bilateral agreements with Korea and Japan exerted a negative effect. Turning to overall merchandise exports, only four trade agreements (MERCOSUR, Nepal, Singapore, and Chile) show a positive impact. The differential effect on overall merchandise exports as compared to the manufacturing subset is not surprising as several primary products are usually included in the negative/sensitive list of the trade agreements. Therefore, a majority of the trade agreements exerted no effect on overall merchandise exports. Compared to manufactured exports, a fewer number of trade agreements exerted a positive impact on India’s manufactured imports. The agreements that exerted a positive effect on India’s imports include Japan, Korea and Chile for manufactured products and Japan, Korea, Chile, Singapore and Sri Lanka for overall merchandise imports. Even as some of the agreements led to increase in imports, for most of the cases, the percentage increase in exports is higher than the percentage increase in imports. The exceptions are the bilateral agreements with Korea, Japan and Sri Lanka, where the percentage increase in imports are higher than that of exports.
5.37 The overall impact on India’s exports to the partners, with which the agreements have been signed, is 13.4 per cent for manufactured products and 10.9 per cent for total merchandise, as shown in Figure 17. The overall impact on imports is found to be lower at 12.7 per cent for manufactured products and 8.6 per cent for total merchandise. Therefore, from the perspective of trade balance, India has clearly “gained” in terms of 0.7 percent increase in trade surplus per year for manufactured products and of 2.3 per cent increase in trade surplus per year for total merchandise.
Figure 16: Impact of Trade Agreements on India’s Exports and Imports, 1993 to 2018 (per cent Changes of US$ Values per Year)
Source: Survey Calculations
Note: The results reported here are based on a gravity model based regression analysis, where the dependent variable is the $ value of India’s exports on bilateral basis for the period 1993-2018. Independent variables include GDP of partner countries, per capita GDP of trading partners, various trade agreement dummies, partner fixed effects and year fixed effects. Estimates of percentage changes in exports and imports (after entering into FTA) are based on the coefficient of the corresponding FTA dummies.
Figure 17: Overall Impact of Trade Agreements on Exports and Imports
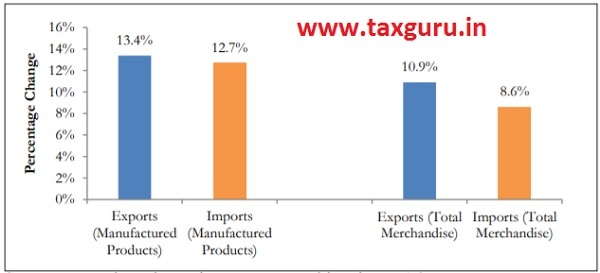
Table 5: India’s Trade Agreements
| Agreements | Year in which India signed the agreement | Countries in the Bloc | Start year | End year |
| BIMSTEC | 1997 | Bangladesh, Bhutan (2004), India, Myanmar, Nepal (2004), Sri Lanka, Thailand | 1997 (except Bhutan 2004, Nepal 2004) | 2018 |
| Sri Lanka | 2001 | India, Sri Lanka | 2001 | 2005 |
| Afghanistan | 2003 | India, Afghanistan | 2003 | 2010 |
| Thailand | 2004 | India, Thailand | 2004 | 2009 |
| Singapore | 2005 | India, Singapore | 2005 | 2009 |
| Bhutan | 2006 | India, Bhutan | 2006 | 2018 |
| SAFTA | 2006 | Afghanistan (2011), Bangladesh, Bhutan, India, Maldives, Nepal, Pakistan, Sri Lanka | 2006 (except Afghanistan 2011) |
2018 |
| Chile | 2007 | India, Chile | 2007 | 2018 |
| MERCOSUR | 2009 | India (2009), Argentina, Brazil, Paraguay, Uruguay | 2009 | 2018 |
| Nepal | 2009 | India, Nepal | 2009 | 2018 |
| Korea | 2010 | India, Korea | 2010 | 2018 |
| ASEAN | 2010 | India (2010), Brunei Darussalam (1984), Cambodia (1999), Indonesia, Lao People’s Democratic Republic (1997), Malaysia, Myanmar (1997), Philippines, Singapore, Thailand, Vietnam (1995) | 2010 | 2018 |
| Malaysia | 2011 | India, Malaysia | 2011 | 2018 |
| Japan | 2011 | India, Japan | 2011 | 2018 |
Source: WTO Regional Trade Agreement Database
WAY FORWARD
5.38 The experience of countries that have achieved rapid and sustained export growth suggests that India can reap rich dividends by adopting policies aimed at strengthening its involvement in the export market for network products (NP). Given our vast manpower with relatively low skill, India’s current strength lies primarily in assembly of NP. While the short to medium term objective is the large scale expansion of assembly activities by making use of imported parts & components, giving a boost to domestic production of parts & components (upgrading within GVCs) should be the long term objective. Assembly is highly labour intensive, which can provide jobs for the masses, while domestic production of parts & components can create high skill jobs.
5.39 A highly feasible target of raising India’s export market share to about 3.5 per cent by 2025 and 6 per cent by 2030 would create about 38.5 million additional jobs in the country by 2025 and about 82 million additional jobs by 2030. The incremental value added in the economy from the target level of exports of network products would make up about one-quarter of the increase required for making India a $5 trillion economy by 2025.
5.40 An important concern is whether participation in GVCs implies that low wage countries would remain perpetually stuck at the lower end of the production processes. As the case studies of India’s automobile sector illustrate, such apprehensions are unwarranted.
5.41 For a country to become an attractive location for assembly activities, it is imperative that import tariff rates for intermediate inputs are zero or negligible. It is also imperative to create an ecosystem that will result in realignment of India’s specialization patterns towards labour-intensive processes and product lines. The ongoing reform measures to provide greater flexibility in the labour market should continue. A pro-active FDI policy is also critical as MNEs are the leading vehicles for the country’s entry into global production ntworks while local firms play a role as subcontractors and suppliers of intermediate inputs to MNEs. Assembly processes require not only trainable low-cost unskilled labour but also a lot of middle-level supervisory manpower. For example, when Apple employed 7,00,000 factory workers in China, it also employed 30,000 engineers on-site to supervise those workers (Isaacson, 2011).
5.42 A low level of service link costs (costs related to transportation, communication, and other tasks involved in coordinating the activity in a given country with what is done in other countries) is a pre-requisite for countries to strengthen their participation in GVCs. Supply disruptions in a given location due to shipping delays, power failure, political disturbances, labour disputes etc could disrupt the entire production chain. Policy measures should focus on reducing input tariffs, implementation of key factor market reforms, providing an enabling environment for the entry of lead firms into the country and reducing the service link costs.
CHAPTER AT A GLANCE
> The current environment for international trade presents India an unprecedented opportunity to chart a China-like, labour-intensive, export trajectory and thereby create unparalleled job opportunities for our burgeoning youth.
> By integrating “Assemble in India for the world” into Make in India, India can raise its export market share to about 3.5 per cent by 2025 and 6 per cent by 2030. This will create 4 crore well-paid jobs by 2025 and 8 crore by 2030.
> One-quarter of the increase in value added required for making India a $5 trillion economy by 2025 can come from exports of network products.
> This chapter, therefore, articulates a clear-headed strategy to grab this opportunity.
> China’s remarkable export performance vis-à-vis India is driven primarily by deliberate specialization at large scale in labour-intensive sectors, especially “network products”, where production occurs across Global Value Chains (GVCs) operated by multi-national corporations. China used this specialised strategy to export primarily to markets in rich countries. Similarly, India must place laser-like focus on enabling assembling operations at mammoth scale in network products.
> As an India that harbours misplaced insecurity on the trade front is unlikely to grab this opportunity, our trade policy must be an enabler. When the impact of India’s trade agreements on overall trade balance is made by accounting for all confounding factors, India’s exports have increased by 13.4 per cent for manufactured products and 10.9 per cent for total merchandise while imports increased by 12.7 per cent for manufactured products and 8.6 per cent for total merchandise. Thus, India has clearly gained 0.7 per cent increase in trade surplus per year for manufactured products and 2.3 per cent per year for total merchandise.
REFERENCES
Akamatsu, K. 1962. “Historical Pattern of Economic Growth in Developing Countries”. The Developing Economies, 1, 3–25.
Amiti, M., Freund, C. 2010. “An Anatomy of China’s Export Growth”, in Feenstra, R. C. and Wei, S., (eds.), China’s Growing Role in World Trade, The University of Chicago Press.
Athukorala, Prema-Chandra. 2011. “Production Networks and Trade Patterns in East Asia: Regionalization or Globalization?” Asian Economic Papers, 10(1): 65–95.
Athukorala, Prema-Chandra. 2014. “How India Fits into Global Production Sharing: Experience, Prospects and Policy Options,”
India Policy Forum 2013/14, 57-116.
Athukorala, Prema-Chandra and Veeramani, C. 2019. “From Import Substitution to Integration into Global Production Networks: The Case of Indian Automobile Industry”, Asian Development Review, Vol 36 (2).
Basu, Anwesha and Veeramani, C 2020. “Declining Labour Share in Indian Economy: Role of Structural Transformation?” in S Mahendra Dev (ed), India Development Report 2020, Oxford University Press, New Delhi (forthcoming).
Besedes, T., Prusa, J.T. 2011. ‘The Role of Extensive and Intensive Margins and Export Growth’, Journal of Development Economics, 96, 2, 371-379.
D’Costa, Anthony. 1995. “The Restructuring of the Indian Automobile Industry: Indian State and Japanese Capital.” World Development 23 (3): 485–502.
Dedrick, Jason., Kenneth L. Kraemer, and Greg Linden. 2010. Who Profits from Innovation in Global Value Chains? A study of the iPod and notebook PCs”. Industrial and Corporate Change 19(1), 81–116.
Dedrick, Jason., Greg Linden and Kenneth L. Kraemer .2018. “We Estimate China only Makes $8.46 from an iPhone – and that’s why Trump’s Trade War is Futile” The Conversation, July (https://theconversation.com/we-estimate-china-only-makes-8-46-from-an-iphone-and-thats-why-trumpstrade-war-is-futile-99258)
Eaton, J., Eslava, M., Kugler, M., Tybout, J., 2007. ‘The Margins of Entry into Export Markets: Evidence from Colombia’, in Globalization and the Organization of Firms and Markets, Munich, Germany, Centre for Economic Policy Research.
Felbermayr, G.J., Kohler, W. 2006. “Exploring the Intensive and Extensive Margins of World Trade’, Review of World Economics, 142, 4, 642-674.
Grossman, G.M. and Rossi-Hansberg. 2008. “Trading Tasks: A Simple Theory of Offshoring” American Economic Review, 98(5), 1978–1997.
Hamaguchi, T. 1985. “Prospects for SelfReliance and Indigenization in Automobile Industry: Case of Maruti-Suzuki Project.” Economic and Political Weekly 20 (35):M115–M122.
Helpman, E., Melitz, M., Rubinstein, Y. 2008. ‘Estimating Trade Flows: Trading Partners and Trading Volumes’, Quarterly Journal of
Economics, 123, 2, 441-487.
Hinloopen, J., Marrewijk C. 2008. “Empirical Relevance of the Hillman Condition for Revealed Comparative Advantage: 10 Stylized Facts,” Applied Economics, 40, 18, 2313-2328.
Hummels, D., Klenow, P.J. 2005. “The Variety and Quality of a Nation’s Exports”, American Economic Review, 95, 3, 704-723.
International Labour Organization. 2019. “Exports to Jobs Boosting the Gains from Trade in South Asia”
Isaacson, Walter. 2011. “Steve Jobs”, New York: Simon & Schuster Kochhar, K., Kumar, U., Rajan, R., Subramanian A., Tokatlidis, I. 2006. “India’s Pattern of Development: What Happened, What Follows?”, Journal of Monetary Economics, 53, 5, 981-1019.
Los, Bart, Marcel P. Timmer, and Gaaitzen J.de Vries. 2015. “How important are exports for job growth in China? A demand side analysis,” Journal of Comparative Analysis, 43(1), 19-32.
Panagariya, A. 2007. “Why India Lags Behind China and How It Can Bridge the Gap”, World Economy, 30, 2, 229-248.
Silva, Santos J M C and Tenreyro, Silvana. 2006. “The Log of Gravity”, Review of Economics and Statistics, 88(4): 641-658.
Tewari, Meenu and Veeramani, C. 2016. “Network Trade and Development: What do the Patterns of Vertically Specialized Trade in ASEAN Tell Us About India’s Place in Asian Production Networks” Global Economy Journal, De, Vol 16(2).
Veeramani, C. 2012a. “Anatomy of India’s Merchandise Export Growth, 1993-94 to 2010-11”, Economic and Political Weekly, Vol XLVII (1), pp 94-104.
Veeramani, C 2012b. “The “miracle” still waiting to happen: performance of India’s manufactured exports in comparison to China”, in S Mahendra Dev (ed), India Development Report, Oxford University Press, New Delhi, p. 132-150.
Veeramani, C and Dhir, Garima. 2016. “India’s export of unskilled labor-intensive products: a comparative analysis” in C. Veeramani
and R Nagaraj (ed) International Trade and Industrial Development in India: Emerging Trends, Patterns and Issues, Orient
Blackswan.
Veeramani, C and Dhi, Garima. 2017. “Make What in India?” in S Mahendra Dev (ed), India Development Report 2017, Oxford University Press, New Delhi.
Veeramani, C., Aerath, Lakshmi and Gupta, Prachi. 2018. “Intensive and Extensive Margins of Exports: What can India Learnfrom China”, The World Economy, Vol 41 (5).
Veeramani. 2019. “Fragmentation Trade and Vertical Specialisation: How Does South Asia Compare with China”, Journal of Asian Economic Integration, Vol 1(1), 2019.
Veeramani, C and Dhir, Garima. 2019a. “Reaping Gains from Global Production Sharing: Domestic Value Addition and Job Creation by Indian Exports”, IGIDR Working Paper No WP-2019-024, Mumbai (http:// www.igidr.ac.in/pdf/publication/WP-2019- 024.pdf)
Veeramani, C and Dhir, Garima. 2019b. “Dynamics and Determinants of Fragmentation Trade: Asian Countries in Comparative and Long-term Perspective” IGIDR Working Paper No WP-2019- 040, Mumbai. (http://www.igidr.ac.in/ working-paper-dynamics-determinantsfragmentation-trade-asian-countriescomparative-long-term-perspective/)
Veeramani C and Dhir, Garima. 2020. “Impact of Free Trade Agreements on India’s Exports and Imports: A Quantitative Assessment”,
IGIDR Working Paper., Mumbai
Veeramani, C and Aerath, Lakshmi. 2020. “Emerging Trends and Patterns of India’s Trade Flows in A Comparative Asian Perspective”,in Suresh Chand Aggarwal, Deb Kusum Das, Rashmi Banga (eds), Accelerators of India’s Growth: Industry, Trade and Employment, Springer (forthcoming).
Note
1 An illustrative example will make this point clearer. India’s exports of passenger motor vehicles (SITC 7810), a capital and skill-intensive product, increased remarkably from $102 million in 2000 to $5392 million in 2015, registering an annual average growth rate of 34 per cent. In 2015, high-income OECD countries accounted for only 22 per cent of Indian exports of passenger motor vehicles while low & middleincome countries accounted for 68 per cent. On the other hand, India’s exports of apparel (SITC 84), a traditional labor-intensive category, grew at a much lower rate of 9 per cent per annum during 2000-2015. In 2015, while high-income OECD countries accounted for 64 per cent of India’s exports in this category, low & middle-income countries accounted for just 12 per cent (Veeramani and Aerath, 2020).