People coming under income tax assessment
According to the data of the AY 2015-16, only 1.7% of total Indians pay income tax. The number of people paying income tax rose from 3.65 crores to 4.07 crores paid income tax & the rest claims below taxable income.
| % of taxpayer | % of total taxes |
| 4.63% of total taxpayers | Pay 62.34% of total taxes |
| 5.5% of total tax-payers | Pay 13.92% of total taxes |
| 89.86% of total tax-payers | Pay 23.72% of total taxes |
The main cause of this, as said by the Finance Minister Arun Jaitley, “India is a tax non-compliant society and too many people evade taxes.” In other words, many people under-report their income to evade taxes. But there are still many who actually earn less than the taxable income.
Now, let’s consider the income distribution that can make it more clear as to how much tax is actually received.
| % of taxpayers | Taxable Income range |
| 93.3% of taxpayers | Rs. 1-2.5 lakhs |
| 6.28% of taxpayers | Rs. 2.5-25 lakhs |
| 0.35% of taxpayers | More than Rs. 50 lakhs |
Even if the number of taxpayers has increased, the total tax collection has decreased overall. This would be easier to understand with the help of a table.
| Year | Taxpayers |
| 2013-14 | 1.66 crore |
| 2014-15 | 1.91 crore |
| 2015-16 | 2.05 crore |
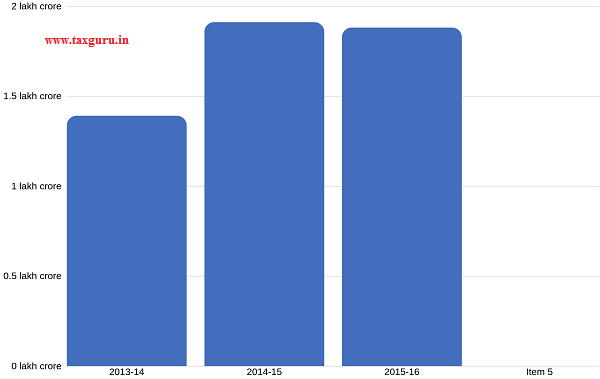
| Year | Tax revenue (INR) |
| 2013-14 | 1.39 crore |
| 2014-15 | 1.91 crore |
| 2015-16 | 1.88 crore |
New pan card users

The IT (Income-Tax) Department has launched data that as many as 19.6 million new PAN cards were issued during the quarter ending March 2018. This is important to understand as the PAN card is a 10-digit Identification number that is required to pay tax & returns. In other words, the more the PAN card holders, the wider is the tax base.
| PAN holders | Total percentage |
| Individuals | 97.46% |
| Firms | 1.08% |
| HUF (Hindu Undivided Family) |
0.51% |
2 states
You must have seen the movie or read the book. The story revolves around 2 people from 2 states. The same story can be narrated about the income tax scenario of India. The 2 most paying states in India are
- Delhi
- Maharashtra
While at the same time, some states have seen a rise in Income taxpayers. These are:
- Karnataka
- Tamil Nadu
- Gujarat
- Rajasthan*
*Rajasthan has seen a 3 times jump in the taxes in the last 7 years i.e. 5,813 crores in 2010-11 to 19,910 crore in 2017-18.
Furthermore, Uttar Pradesh (the most populous state) contributes just 2.3% of the total tax collection of the country.

Let’s not forget the North-eastern states when it comes to total income tax collection.
| Top 5 states the annual growth rate | Increment of taxes (in %) 2017-18 |
| Mizoram | 41% |
| Nagaland | 32.1% |
| Sikkim | 26% |
| Tripura | 16.7% |
| Meghalaya | 12.7% |
Top 5 State-wise taxes paid (2017-18)
| State’s Name | Tax Paid |
| Maharashtra | Rs. 3.84 lakh crore |
| Delhi | Rs. 1.36 lakh crore |
| Karnataka | Rs. 1 lakh crore |
| Tamil Nadu | Rs. 67,583 crore |
| Gujarat | Rs. 44,866 crore |
Returns & taxes
2 crore pay taxes but don’t file income tax returns. At the same time, 2 crore file returns but don’t pay taxes according to statistics.
This data represents the individual tax payee
| Range of tax | No. of returns | Sum of tax payable (Cr) | Avg. tax payable (INR) |
| Zero | 2.02 Cr | 0 | 0 |
| Up to Rs. 5 lakh | 2.55 Cr | 1,21,384 | 47,602 |
| Between Rs. 5-10 L | 5.57 lakh | 38,314 | 6.9 lakh |
| Between Rs. 10-25 L | 2.6 lakh | 39,004 | 15 lakh |
| Between Rs. 25 L-1 Cr | 87,026 | 39,239 | 45.1 lakh |
| Between Rs. 1 Cr- Rs. 50 Cr | 14,048 | 33,824 | 2.4 Cr |
| Between Rs. 50 Cr- 100 Cr | 16 | 975 | 60.9 Cr |
| Above Rs. 100 Cr | 4 | 665 | 166.3 Cr |
And this data represents the companies that pay taxes
| Range of tax | No. of returns | Sum of tax payable (Cr) | Avg. tax payable (INR) |
| Zero | 3.9 lakh | 0 | 0 |
| Up to Rs. 5 lakh | 2.9 lakh | 2,825 | 97,749 |
| Between Rs. 5-10 L | 34,842 | 2,485 | 7.1 lakh |
| Between Rs. 10-25 L | 34,264 | 5,449 | 15.9 lakh |
| Between Rs. 25 L-1 Cr | 28,609 | 14,215 | 49.7 |
| Between Rs. 1 Cr- Rs. 50 Cr | 18,782 | 1,02,529 | 5.5 Cr |
| Between Rs. 50 Cr- 100 Cr | 412 | 28,669 | 69.6 Cr |
| Above Rs. 100 Cr | 466 | 2,39,549 | 514.1 |
Direct tax to GDP ratio
In the Financial Year 2017-18, the Direct Tax to GDP ratio was 5.98% (considered the best in 10 years).
- The growth in personal income tax was 18.3%
- And the growth of corporate income tax was 17.7%
The trend of the Direct tax to GDP ratio is given below:
| Year | Direct tax to GDP ratio |
| 2015-16 | 5.47% |
| 2016-17 | 5.57% |
| 2017-18 | 5.98% |
The comments made by the Finance Ministry on this data
- “There is a constant growth in the direct tax-GDP ratio over the last three years and the ratio of 5.98% in the fiscal year 2017-18 is the best direct tax-GDP ratio in last 10 years”
- “Demonetisation compelled holders of cash to deposit the same in the banks. The enormity of cash deposited and identified with the owner resulted in suspected 17.42 lakh account holders from whom the response has been received online through the non-invasive method” said the Finance Ministry.
- “For AY (assessment year) 2014-15, corresponding to FY (financial year) 2013-14 (base year), the return filers had declared gross total income of 26.92 lakh crore, which has increased by 67% to Rs. 44.88 lakh crore for AY 2017-18, showing a higher level of compliance resulting from various legislative and administrative measures taken by the government, including effective enforcement measures against tax evasion,”
Note: Reference link for the above comments “Direct tax-GDP ratio of 5.98% in FY18 best in 10 years: Govt”

Author Bio


