Advance Pricing Agreement (APA) -Programme of India- Annual Report (2018-19)
Central Board of of Direct Taxes, November 2019
INDEX
Foreword
The Advance Pricing Agreement (APA) programme in India was introduced more than seven years ago. It is currently in its 7th annual cycle of examination and processing of applications. The CBDT is very happy about the fact that this programme has been accepted well by taxpayers and tax consultants. We are very proud of the results generated and the positive impact that the programme has had on the tax environment in India.
The APA programme has contributed significantly to the Government’s mission of enhancing ease of business. It gives me immense pleasure to present the third Annual Report (2018-19) of the Indian APA programme before all stakeholders. While 271 APAs had been entered into till the end of the fiscal year 2018-19, the number has since crossed 300. Suggestions and comments on the Annual Report would be appreciated.
The programme does face certain challenges about which the Government is aware. Steps would be taken to augment the human resources available to work in this arena. Steps would also be taken to bring about added procedural clarity on some issues.
I am aware of the efforts put in by the officers in the Foreign Tax & Tax Research Division of the CBDT and the officers in the APA teams under Principal CCIT (International Taxation) to make this programme a success. I would like to put on record my appreciation for their dedication and hard work. I am also grateful to all taxpayers for reposing their faith in our APA programme and being equal partners in its success.
P.C.Mody
Chairman, Central Board of Direct Taxes
In the Words of Member (Legislation), CBDT
The Government of India and the CBDT set out on an ambitious path in 2012 by rolling out the Advance Pricing Agreement (APA) programme. The idea was to shake off the image of being a jurisdiction where the tax administration ran an aggressive transfer pricing regime. The idea also was to provide certainty to MNEs in respect of their transfer pricing of international transactions, so as to encourage them to invest and grow in India. With a sense of satisfaction, I can say today that those ideas have become the reality. The last seven odd years have resulted in hundreds of APAs getting signed, which has provided comfort and certainty to MNEs.
I have seen the APA programme unfold before my eyes over the past seven years. I have been involved with it in various capacities since 2013 and I have been fortunate to have got an opportunity to contribute towards its success.
With each passing year, we get to see more complex cases. For example, in the year 2018-19 we inked agreements in respect of international transactions like AMP expenses, payment of royalty and transfer of intangibles. This entailed adoption of transfer pricing methods like profit split and CUP. Resolution of such complex cases augurs well for the future of the Programme.
This third Annual Report (2018-19) on the Indian APA programme showcases some of its interesting insights. It also reflects in equal measure the work done by our officers in the Foreign Tax & Tax Research Division and in the APA teams functioning under Pr. CCIT (International Taxation).
I urge taxpayers and tax consultants to keep making use of APAs to reap the benefits of certainty and dispute prevention.
Akhilesh Ranjan
Member (Legislation), Central Board of Direct Taxes
ANNUAL REPORT ON INDIA’S ADVANCE PRICING AGREEMENT (APA) PROGRAMME – 2018-19
INTRODUCTION
Advance Pricing Agreement (APA) programmes are operational in a number of countries and they are almost 30 years old in countries like Canada, USA, Japan and UK. The primary goal of such programmes is to provide certainty to taxpayers in respect of the transfer price of the cross-border transactions undertaken by such taxpayers with their group entities. Rapid growth in international trade through an increasing number of Multi National Enterprises (MNEs) has given rise to numerous tax disputes on the issue of transfer pricing. An APA is a mechanism to resolve transfer pricing issues in advance, i.e., before the cross-border related party transaction actually takes place or, at least, before a dispute arises in respect of such cross-border transaction. The transfer price of goods and services transacted between group entities is decided in advance by the tax authorities and the taxpayers, so as to prevent any dispute arising from such transfer pricing.
The Advance Pricing Agreement (APA) programme in India was launched in 2012 vide the Finance Act, 2012 through the insertion of Sections 92CC and 92CD in the Income-tax Act, 1961. These statutory provisions, effective from 1st July, 2012, provided the legal basis for the CBDT to enter into Advance Pricing Agreements (APAs) with taxpayers for a maximum period of 5 years in respect of international transactions between Associated Enterprises (AEs) to determine the Arm’s Length Price (ALP) or to specify the manner in which the ALP is to be determined.
Vide notification no. 36/2012 [F. No. 133/5/2012-SO(TPL)]/SO 2005 (E), dated 30th August, 2012, the APA Scheme [Rules 10F to 10T] was inserted in the Income-tax Rules to operationalize the APA programme. Thus, the Indian APA programme, which commenced from 1st July, 2012, actually became functional and operational from 30th August, 2012 with the notification of the rules. The rules lay down the detailed procedures for filing of pre-filing consultation application; pre-filing consultation; payments of fees; filing of APA application; processing of APA application; withdrawal of APA application; terms and conditions of APA; filing of Annual Compliance Report; Compliance Audit; revision, cancellation and renewal of APA; etc.
To provide clarity to taxpayers on a number of issues concerning the APA programme, the CBDT issued a booklet containing guidance on the APA programme and answers to Frequently Asked Questions (FAQs) as part of its Taxpayers’ Information series.
Roll-back of APAs was announced by the Government on 10th July, 2014. The necessary legislative changes in this regard were carried out through the Finance (No. 2) Act, 2014. The Income-tax Rules for implementing the Roll-back provisions were notified on 14th March, 2015 and the existing APA Scheme got amended accordingly. The Rollback provisions are applicable for a maximum of four years prior to the first year of the APA period. Thus, a taxpayer would be able to have certainty in matters of transfer pricing for a maximum period of 9 years at any one time by applying for an APA with Rollback provisions. Circular No. 10 of 2015 was issued by the CBDT on 10th June, 2015 to provide clarity on Rollback issues in the form of answers to FAQs.
Under the Indian APA programme, APAs can be multilateral or bilateral (involving CBDT and the tax authorities of one or more countries) or unilateral (involving the CBDT only). Over the last 7 years, more than 1150 applications have been filed in India. Majority of these applications (about 82%) are for unilateral APAs between the Indian taxpayer and the CBDT. Till 31st March, 2019, 271 Agreements have been entered into (240 unilateral and 31 bilateral).
The APA applications are processed and analysed by dedicated APA teams working under the overall supervision of Pr. CCIT (International Taxation & Transfer Pricing). Each APA team is headed by a Commissioner of Income-tax and the team also comprises Addl./Joint Commissioners of Income-tax and Deputy/Asst. Commissioners of Income-tax. Presently, there are four APA teams and the APA offices are located at Delhi, Mumbai and Bengaluru.
In respect of unilateral APAs, the position papers developed by the APA teams are approved by the Pr. CCIT (International Taxation & Transfer Pricing) and sent to the Central Board of Direct Taxes [CBDT] for approval. In the CBDT, officers working in the Foreign Tax & Tax Research (FT & TR-I and II) Divisions examine and process the position papers. Joint Secretary, FT & TR-I and FT & TR-II review the examination done by the officers below and further process the position papers before sending it for final approval of the designated Member of the CBDT. The Member approves the final negotiating position to be adopted by the APA teams. Once the negotiation is complete, a draft Agreement is sent to the CBDT for approval before the Agreement is entered into between the Board and the taxpayer. On behalf of the Board, the Agreements are entered into by either Joint Secretary, FT & TR-I or Joint Secretary, FT & TR-II.
In respect of bilateral APAs, once the position papers are sent to the FT & TR-I & II Divisions by the Pr. CCIT (International Taxation), the Competent Authority of India (either Joint Secretary, FT & TR-I or Joint Secretary, FT & TR-II depending on the country with which the bilateral APA is to be negotiated under the Tax Treaty) has to initiate discussions with his/her counterpart in the other country. The officers in the FT & TR-I & II Divisions of the CBDT working with the Competent Authority examine the position papers and prepare the position of the Indian Competent Authority. The same is shared with the Competent Authority of the other country. Once positions have been exchanged, the Competent Authorities of both the concerned countries discuss and negotiate the terms and conditions of the APA. If they reach an understanding, then a Mutual Agreement, containing the terms and conditions of the APA, is entered into by the Competent Authorities of both countries. Thereafter, each country has to enter into an Agreement with its own taxpayer. On the Indian side, a draft Agreement is prepared in consultation with the Indian taxpayer and the same is submitted for the approval of the designated Member in the CBDT. After approval, the APA is entered into by either Joint Secretary, FT & TR-I or Joint Secretary, FT & TR-II (the two Competent Authorities of India) with the taxpayer on behalf of the CBDT.
This Annual Report carries forward the CBDT’s unique initiative of the last two years to bring into the public domain various statistical and qualitative aspects of India’s APA programme. The idea is to encourage discussion and debate amongst taxpayers, policy makers, economists, etc. on the strengths and weaknesses of the programme. This Annual Report by the CBDT on one of its programmes underlines the importance that the APA programme holds in the Government’s endeavour to promote and preserve a non-adversarial tax regime. The third Annual Report on the APA programme highlights the progress made in financial year 2018-19. A total of 52 APAs were entered into during this year. Though the number of APAs entered into has come down, it is still an impressive achievement by the CBDT and its officers working in the Foreign Tax & Tax Research Division and in the APA teams at the field level [comprising the Principal CCIT (IT), APA Commissioners, Additional/Joint Commissioners and Deputy/Assistant Commissioners]. The CBDT acknowledges the cooperation and efforts of the applicants and their consultants in making the APA programme a success.
DATA AND QUALITATIVE ANALYSES
A. GENERAL ANALYSIS
A.1. No. of Applications Filed
The total number of applications filed on an annual basis (till 31 March, 2019) can be seen in the table and the graph below.
Table A.1
| Financial Year (F.Y) | Unilateral APA Applications | Bilateral APA Applications | Total |
| 2012-13 | 117 | 29 | 146 |
| 2013-14 | 206 | 26 | 232 |
| 2014-15 | 192 | 14 | 206 |
| 2015-16 | 113 | 19 | 132 |
| 2016-17 | 78 | 23 | 101 |
| 2017-18 | 115 | 53 | 168 |
| 2018-19 | 123 | 47 | 170 |
| Total | 944 | 211 | 1155 |
Graph A.1

Though the overwhelming preference for unilateral APAs is clearly seen in the data above, it is equally clearly seen that the filing of bilateral APA applications saw an upward spike in 2017-18 and that trend continues in 2018-19. Bilateral APA applications now constitute almost one-third of the total applications filed. The primary reasons for the increase in bilateral APA applications are the following:
- Both the Indian Competent Authorities have successfully resolved bilateral APAs with several countries like Japan, United Kingdom, USA, Australia, Switzerland, Netherlands, etc.
- Bilateral APAs provide complete relief from double taxation.
- The US Competent Authority opening up the bilateral APA programme between the two countries in February 2016.
- India becoming willing to accept bilateral APAs in respect of all treaty partners (even in the absence of Article 9(2) in the relevant treaty).
It is also pertinent to point out that the above graph only depicts the number of unilateral and bilateral applications, as filed originally. The statistics on nature of applications filed – unilateral or bilateral – is dynamic because applicants come up with frequent requests for conversion from unilateral to bilateral. Requests for conversion of bilateral applications to unilateral have been rare.
Over the last few years and till 31st March, 2019, 44 unilateral applications filed in different years have been converted to bilateral applications. During the same period, 2 bilateral applications have been converted to unilateral applications. As a result, there has been a net increase of 42 bilateral applications over the original number of applications filed. More details regarding this would be found in subsequent sections.
It is important to note that India received the most APA applications across the globe, after USA (203 in 2018), during the period 2018-19. This has been the trend since the beginning of our APA Programme and goes on to indicate two facts – firstly, the popularity of the APA Programme and, secondly, the need for human resources to handle the volume of work.
A.2. Status of Applications Filed
The status of applications filed in the last 7 years can be seen from the table and graph below. The number of applications filed has gone up again from F.Y 2017-18 due to many applicants coming back to the APA Programme with applications for renewing their earlier APAs.
The table and graph also reveal the number of cases disposed of otherwise than by signing of an Agreement. The reasons for such disposal of applications include withdrawal of applications by the applicants and merger of multiple applicants with each other. This results in signing of fewer Agreements than the number of applications filed.
Table A.2
| F.Y | (A) No. of Applications Filed |
(B) No. of Agreements Signed out of (A) |
(C) No. of Applications disposed of out of (A) due to other reasons |
(D) No. of Applications Under Processing out of (A) [(A) – (B+C)] |
| 2012-13 | 146 | 92 | 20 | 34 |
| 2013-14 | 232 | 108 | 40 | 84 |
| 2014-15 | 206 | 51 | 19 | 136 |
| 2015-16 | 132 | 15 | 3 | 114 |
| 2016-17 | 101 | 3 | 0 | 98 |
| 2017-18
2018-19 Total |
168 | 2 | 0 | 166 |
| 170 | 0 | 0 | 170 | |
| 1155 | 271 | 82 | 802 |
Graph A.2

It is pertinent to point out here that out of the pending 802 applications, there are about 50 applicants who have not formally withdrawn from the APA Programme but have not been participating in the process actively. For example, they have not furnished documents and responses to basic questions even after a year of issue of questionnaires or query letters. Naturally, such applications have been placed on the back burner and may be processed for closure.
A.3 Agreements Signed: Year-wise
The table and the graph below depict the number of Agreements that have been entered into, year-wise, till 31st March, 2019.
Table A.3
| Financial Year (F.Y) | Unilateral | Bilateral | Total |
| 2013-14 | 5 | 0 | 5 |
| 2014-15 | 3 | 1 | 4 |
| 2015-16 | 53 | 2 | 55 |
| 2016-17 | 80 | 8 | 88 |
| 2017-18 | 58 | 9 | 67 |
| 2018-19 | 41 | 11 | 52 |
| Total | 240 | 31 | 271 |
Graph A.3

The number of Agreements signed came down to 52 in 2018-19. This is the second successive year in which the number of Agreements signed has fallen short of its immediately preceding year. The reasons for this trend are two-fold. Firstly, with more and more complex cases coming into the APA Programme, more time is required to analyse the covered international transactions. Secondly, shortage of manpower at the level of Addl./Joint Commissioners and Deputy/Asst. Commissioners in the APA teams has continued and that has slowed down the processing of applications.
Nonetheless, it is interesting to note that while India has entered into 271 APAs in 6 years, China has entered into 156 APAs in the 14 years between 2005 and 2018.
A.4 Total Covered Years in Agreements Signed
Table A.4
| Particulars | APA Years | Rollback Years | Total Years |
| Agreements signed in F.Y 2018-19 | 252 | 99 | 351 |
| Agreements signed till F.Y 2018-19 | 1302 | 477 | 1779 |
An interesting and important data relates to the number of years for which tax certainty on transfer pricing matters has been achieved by the Indian APA Programme. In the 271 APAs entered into till 31st March 2019, CBDT has managed to provide tax certainty for 1779 years to these taxpayers. This includes 477 years covered under the Rollback period of the concluded APAs. Since assessments and litigation in India happen on an annual basis, if we presume that 50% of these cases would have faced transfer pricing adjustments, then the APA Programme has already ended about 890 litigations that would have otherwise clogged the ITATs and courts in India.
In 2018-19 alone, tax certainty has been provided to 351 years, including 99 years under Rollback provisions. Out of the 52 agreements signed during the year, 29 had a Rollback period. Similarly, out of the total 271 agreements signed so far, 137 had a Rollback period.
B. UNILATERAL APAs
B.1 Applications Filed (Original and Post-Conversion)
As mentioned earlier, some unilateral applications do get converted to bilateral applications every year. The conversion from bilateral to unilateral is very rare. The table shows that while 944 unilateral applications were originally filed, conversion of some of them to bilateral APAs has reduced the number to 902. It needs to be clarified that where an application has requests for both unilateral and bilateral APAs, the application is counted as a bilateral.
It is also interesting to note that there has been no conversion from unilateral to bilateral in recent years. The primary reason for this is the opening up of the bilateral APA programme between India and its largest trade and treaty partner – USA. The USA agreed to do bilateral APAs with India only in early 2016. Thus, some taxpayers who had filed unilateral APAs prior to that opted to convert their applications.
As mentioned earlier in the report, there has been a net decrease of 42 in the number of unilateral applications due to conversions from unilateral to bilateral. Correspondingly, the number of bilateral applications filed originally has also gone up by the same number.
Table B.1
| Financial Year (F.Y) | Applications (Original) |
Applications (Post-Conversion) |
| 2012-13 | 117 | 111 |
| 2013-14 | 206 | 196 |
| 2014-15 | 192 | 173 |
| 2015-16 | 113 | 106 |
| 2016-17 | 78 | 78 |
| 2017-18 | 115 | 115 |
| 2018-19 | 123 | 123 |
| Total | 944 | 902 |
Graph B.1

B.2 Status of Applications Filed (Post-Conversion)
The table and the graph below depict the status of unilateral applications [as on 31st March 2019] that have been filed so far.
Table B.2
| F.Y | (A) No. of Applications Filed (Post-Conversion) |
(B) No. of Agreements Signed out of (A) |
(C) No. of Applications Disposed of out of (A) due to other reasons |
(D) No. of Applications under Processing out of (A) |
| 2012-13 | 111 | 74 | 13 | 24 |
| 2013-14 | 196 | 102 | 31 | 63 |
| 2014-15 | 173 | 45 | 19 | 109 |
| 2015-16 | 106 | 15 | 3 | 88 |
| 2016-17 | 78 | 2 | 0 | 76 |
| 2017-18 | 115 | 2 | 0 | 113 |
| 2018-19 | 123 | 0 | 0 | 123 |
| Total | 902 | 240 | 66 | 596 |
Graph B.2

B.3 Agreements Signed: Year-wise
The table and the graph below show the number of unilateral APAs entered into in the last 5 years. There has been a 30% decrease in the number of Agreements signed in 2018-19, as compared to 2017-18. Even in 2017-18, there had been a similar decline, as compared to 2016-17. The reasons for this slowdown have been mentioned earlier in this report.
Table B.3
| Financial Year (F.Y) | Agreements Signed | |
| 2013-14 | 5 | |
| 2014-15 | 3 | |
| 2015-16 | 53 | |
| 2016-17 | 80 | |
| 2017-18 | 58 | |
| 2018-19 | 41 | |
| Total | 240 |
Graph B.3

The 240 unilateral APAs have provided tax certainty of 1553 years to the taxpayers. This includes 404 years covered under the Rollback period of the concluded APAs. Out of the 240 Agreements, 113 Agreements have a Rollback period. The 41 Agreements concluded in 2018-19 provide tax certainty of 269 years, including 72 Rollback years.
B.4 Duration of Processing
A very important aspect of any APA programme is the time taken to process an application and conclude an Agreement. We have computed this by considering the time taken from the date of filing of the application to the date of signing of the agreement. Different countries have managed to achieve varying timelines to conclude APAs. For example, USA has had an average timeline of 35.4 months for unilateral APAs and 47.8 months for bilateral APAs in 2018. In 2017, it had closed unilateral APAs in 40.4 months on an average but had taken 46.9 months for bilateral APAs.
In 2018-19, the average time taken by the CBDT to conclude the 41 unilateral agreements was 45.22 months. This is more than the average time taken in any of the previous 5 years. As a result, the average time taken to conclude unilateral APAs in India has increased from 31.75 months (as on 31st March, 2018) to 32.50 months (as on 31st March, 2019). This is better than what most countries have achieved. The detailed analysis of this is depicted in the tables and graphs below. The timelines for concluding bilateral APAs has been discussed later in this report.
Table B.4(1)
| Duration of Processing | No. of Agreements signed in F.Y 2018-19 |
| Within 12 Months | 2 |
| 13-24 Months | 1 |
| 25-36 Months | 7 |
| 37-48 Months | 15 |
| 49-60 Months | 6 |
| 61-72 Months | 10 |
| Total Agreements Signed | 41 |
| Average Time Taken for each Agreement – 45.22 months | |
Graph B.4(1)

Table B.4(2)
| Duration of Processing | Number of Agreements Signed till 31st March, 2019 |
| Within 12 Months | 9 |
| 13-24 Months | 46 |
| 25-36 Months | 97 |
| 37-48 Months | 65 |
| 49-60 Months | 13 |
| 61-72 Months | 10 |
| Total Agreements Signed | 240 |
| Average Time Taken For Each Agreement – 32.5 Months | |
Graph B.4(2)

The cumulative data of 6 years above reveals that more than 90% of the unilateral APAs entered into have been concluded within 4 years of the filing of applications and about 65% have been entered into within 3 years. While 23% of the unilateral APAs have been concluded within 2 years, which is very commendable, it is a bit worrisome that 4% of the Agreements could be finalised only after the expiry of the term of the APAs, i.e., 5 years.
B.5 Distribution of Agreements Signed: Economic Activity-wise
The economic activities performed by the taxpayers in the 41 unilateral APAs concluded in 2018-19 have been culled out and depicted in the table and graph below.
Table B.5
| Sl. No. | Economic Activity | No. of Agreements Signed in F.Y 2018-19 |
| 1 | Service | 20 |
| 2 | Manufacturing & Trading | 14 |
| 3 | Trading | 4 |
| 4 | Manufacturing | 2 |
| 5 | Manufacturing & Service | 1 |
| 6 | Trading & Service | 0 |
| Total | 41 |
The service sector of the Indian economy continues to be the pre-dominant activity in the unilateral APAs. This is probably on expected lines because the service sector is the largest contributor to India’s Gross Domestic Product and is at the forefront of India’s international trade, which in turn, raises several issues around the transfer pricing of such transactions.
Graph B.5

B.6 Distribution of Agreements Signed – Industry-wise
The table and graph below provide information regarding the various industries covered in each of the unilateral APAs entered into in F.Y 2018-19. Information Technology, and Health & Hygiene industries constitute more than 40% of the Agreements. This is consistent with the trend seen in our previous analysis of the economic activities covered in the unilateral APAs.
It is also a positive sign that the APAs are not only about a few industries. As can be seen, there are 14 different types of industries that have availed the benefits of the Indian APA programme in 2018-19.
Table B.6
| Sl. No. | Industry | No. of Agreements Signed |
| 1 | Agriculture | 1 |
| 2 | Automobile/Automotive Parts | 2 |
| 3 | Banking & Finance | 1 |
| 4 | Chemicals | 1 |
| 5 | Consumer Durables | 1 |
| 6 | Engineering Services | 1 |
| 7 | Food & Beverages | 2 |
| 8 | Health & Hygiene | 6 |
| 9 | Industrial/Commercial Goods | 5 |
| 10 | Information Technology | 11 |
| 11 | Media & Communication | 1 |
| 12 | Pharmaceutical | 1 |
| 13 | Real Estate & Infrastructure | 3 |
| 14 | Textiles | 1 |
| 15 | Others | 4 |
| Total | 41 |
Graph B.6

B.7 Nature of Covered Transactions
The table and graph below provide information about the nature of international transactions covered in the unilateral APAs entered into in F.Y 2018-19. It can be seen that there are as many as 29 different types of international transactions that have been covered in the unilateral APAs. In addition, some small incidences of other types of transactions have been clubbed together under the category of ‘others’.
A total of 164 international transactions have been covered under the 41 APAs entered into in F.Y 2018-19. Unlike earlier years, provision of IT enabled Services (ITeS) and provision of IT Services (Software Development (SWD) Services) do not occupy the top positions in the list this year. Payment of Royalty and receipt of various kinds of support services (Intra-Group services) feature at the top this time. This is an indicator that more complex cases are coming up and are being dealt with in the APA Programme.
Table B.7
| Sl. No. |
Nature of Covered Transaction | Total No. of Transactions |
| 1 | Payment of Royalty, including license fee | 19 |
| 2 | Receipt of administrative/ technical and other support services | 15 |
| 3 | Purchase of semi-finished/Finished goods | 13 |
| 4 | Provision of IT enabled Services | 12 |
| 5 | Provision of Information Technology Services | 11 |
| 6 | Availing of management services | 10 |
| 7 | Purchase of Raw Materials | 9 |
| 8 | Payment for IT services | 9 |
| 9 | Sale of semi-finished/finished goods/products | 8 |
| 10 | Provision of marketing Support Services and Business Support services | 7 |
| 11 | Import of spare parts/equipments/goods | 5 |
| 12 | Import of capital assets | 5 |
| 13 | Provision of support services | 5 |
| 14 | Provision of corporate guarantee | 3 |
| 15 | Receipt of commission | 3 |
| 16 | Payment of Commission | 3 |
| 17 | Provision of service support and warranty | 3 |
| 18 | Provision of engineering support services | 2 |
| 19 | Receipt of interest on fixed deposits | 2 |
| 20 | Payment of guarantee fee | 2 |
| 21 | Reimbursement of third-party marketing cost | 2 |
| 22 | Receipt of network service income | 2 |
| 23 | Licensing of software application to AE | 1 |
| 24 | Sub- contracting of onsite software development services to AE | 1 |
| 25 | Payment for Marketing and distribution of channels | 1 |
| 26 | Sale of commercial air-time | 1 |
| 27 | Provision of Investment advisory services | 1 |
| 28 | Payment for bank charges | 1 |
| 29 | Incurring of AMP expenses | 1 |
| 30 | Others | 7 |
| TOTAL | 164 |
Graph B.7

B.8 Transfer Pricing Methods Adopted
Taxpayers request tax authorities for an APA so that they can achieve certainty about the transfer pricing method and/or the Arm’s Length Price (ALP) to be used to benchmark their international transactions. During F.Y 2018-19, only 3 methods have been used for the 164 covered transactions in the 41 unilateral APAs that were finalised. The table and graph below throw light on that.
Table B.8
| Sl. No. | Transfer Pricing Method | No. of Transactions |
| 1 | TNM Method | 132 |
| 2 | Other Method | 24 |
| 3 | CUP Method | 8 |
| Total | 164 |
Graph B.8

B.9 Location of Associated Enterprises (AEs)
The 41 unilateral APAs entered into in 2018-19 have AEs across 54 countries, which have been listed below in the table. USA, UK and Singapore are the top 3 countries in terms of the number of APAs in which AEs located therein have been covered.
Table B.9
| Sl. No. | Countries | No. of Ag reements |
| 1 | United States of America | 29 |
| 2 | United Kingdom | 17 |
| 3 | Singapore | 16 |
| 4 | Germany | 14 |
| 5 | China | 12 |
| 6 | Japan | 12 |
| 7 | Australia | 11 |
| 8 | Hong Kong | 10 |
| 9 | Malaysia | 10 |
| 10 | France | 9 |
| 11 | Switzerland | 9 |
| 12 | Italy | 9 |
| 13 | Taiwan | 8 |
| 14 | Indonesia | 7 |
| 15 | Thailand | 7 |
| 16 | Korea | 7 |
| 17 | Brazil | 6 |
| 18 | Philippines | 6 |
| 19 | Turkey | 6 |
| 20 | The Netherlands | 7 |
| 21 | Ireland | 5 |
| 22 | Spain | 5 |
| 23 | Belgium | 4 |
| 24 | Poland | 4 |
| 25 | South Africa | 4 |
| 26 | Canada | 3 |
| 27 | UAE | 3 |
| 28 | Vietnam | 3 |
| 29 | Luxembourg | 3 |
| 30 | Greece | 3 |
| 31 | New Zealand | 3 |
| 32 | Denmark | 2 |
| 33 | Mauritius | 2 |
| 34 | Sweden | 2 |
| 35 | Czech Republic | 2 |
| 36 | Mexico | 2 |
| 37 | Russia | 2 |
| 38 | Sri Lanka | 2 |
| 39 | Egypt | 2 |
| 40 | Hungary | 2 |
| 41 | Nigeria | 2 |
| 42 | Israel | 2 |
| 43 | Morocco | 2 |
| 44 | Pakistan | 2 |
| 45 | Jersey Channel Islands | 2 |
| 46 | Kenya | 2 |
| 47 | Norway | 1 |
| 48 | Finland | 1 |
| 49 | Portugal | 1 |
| 50 | Austria | 1 |
| 51 | Argentina | 1 |
| 52 | Bermuda | 1 |
| 53 | Romania | 1 |
| 54 | Bahrain | 1 |
C. BILATERAL APAs
C.1 Applications Filed (Original and Post-Conversion)
The table and graph below depict the number of original and post-conversion bilateral applications filed.
Table C.1
| Financial Year | Applications (Original) | Applications (Post-Conversion) |
| 2012-13 | 29 | 35 |
| 2013-14 | 26 | 36 |
| 2014-15 | 14 | 33 |
| 2015-16 | 19 | 26 |
| 2016-17 | 23 | 23 |
| 2017-18 | 53 | 53 |
| 2018-19 | 47 | 47 |
| Total | 211 | 253 |
Graph C.1

Bilateral APA applications filed in F.Y 2018-19 are almost at the same level, as filed in the previous financial year.
C.2 Applications – Country-wise Distribution
The tables and graphs below provide the country-wise distribution of bilateral APA applications filed in 2018-19, and cumulatively between 2012-13 and 2018-19. In the initial years of the APA programme, United Kingdom (UK) and Japan were leading the list because there was no bilateral APA programme available with the United States of America (USA). However, once the USA opened its bilateral APA programme with India in February, 2016, the applications for India-USA bilateral APAs started coming in. A combination of fresh applications and conversions from unilateral to bilateral, have put the number of applications with USA at the top.
Table C.2
| Sl. No. | Country | No. of Applications Filed in F.Y 2018-19 |
Percentage of Total Applications |
| 1 | USA | 20 | 42.6 |
| 2 | UK | 12 | 25.5 |
| 3 | Singapore | 5 | 10.6 |
| 4 | Japan | 3 | 6.4 |
| 5 | Germany | 2 | 4.3 |
| 6 | Denmark | 1 | 2.1 |
| 7 | France | 1 | 2.1 |
| 8 | Finland | 1 | 2.1 |
| 9 | Sweden | 1 | 2.1 |
| 10 | South Korea | 1 | 2.1 |
| Total | 47 | 100.0 |
Graph C.2

C.3 Status of Applications Filed (Post-Conversion)
The table and graph below show the status of bilateral APA applications as on 31st March, 2019.
Table C.3
| Financial Year |
(A) No. of Applications Filed |
(B) No. of Agreements Signed out of A |
(C) No. of Applications disposed of out of (A) due to other reasons |
(D) No. of Applications under Processing out of (A) |
| 2012-13 | 35 | 18 | 7 | 10 |
| 2013-14 | 36 | 6 | 9 | 21 |
| 2014-15 | 33 | 6 | 0 | 27 |
| 2015-16 | 26 | 0 | 0 | 26 |
| 2016-17 | 23 | 1 | 0 | 22 |
| 2017-18 | 53 | 0 | 0 | 53 |
| 2018-19 | 47 | 0 | 0 | 47 |
| Total | 253 | 31 | 16 | 206 |
Graph C.3

In the 31 bilateral APAs entered into so far, CBDT has provided tax certainty of 226 years to these 31 taxpayers. These 226 years include 73 years covered under the Rollback period of the concluded APAs. Out of the 31 Agreements, 24 have Rollback provisions.
In 2018-19, the 11 bilateral APAs entered into have provided tax certainty of 82 years that includes 27 Rollback years (7 out of the 11 APAs have Rollback provisions).
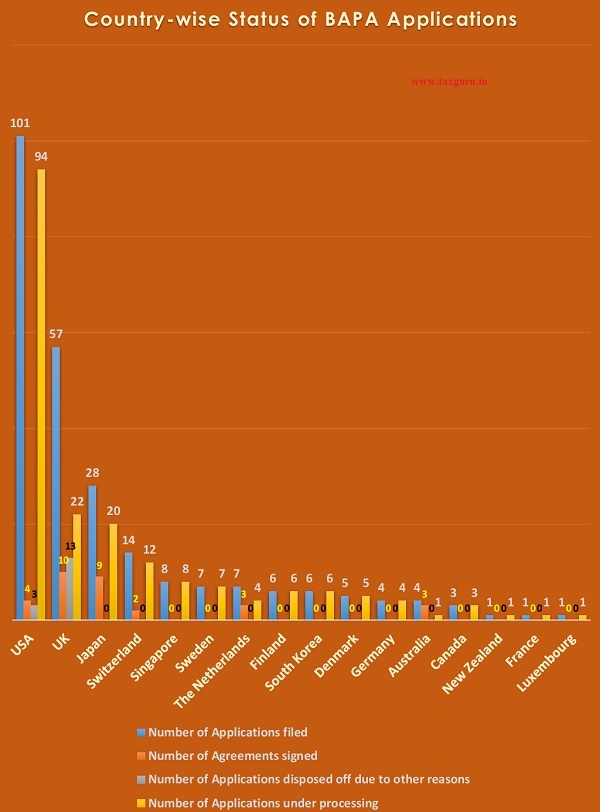
C.4 Country-wise Status of Applications Filed (Post-Conversion)
The country-wise status of original bilateral applications filed and also the applications converted from unilateral till 31st March, 2019 is depicted in the table and graph below. It is clearly seen that almost 80% of the total BAPA applications are with only 4 countries – USA, UK, Japan and Switzerland.
Table C.4
| Sl. No. | Country | (A) No. of Applications Filed |
(B) No. of Agreements Signed out of A |
(C) No. of Applications disposed of out of (A) due to other reasons |
(D) No. of Applications under Processing out of (A) |
| 1 | USA | 101 | 4 | 3 | 94 |
| 2 | UK | 57 | 10 | 13 | 34 |
| 3 | Japan | 28 | 9 | 0 | 19 |
| 4 | Switzerland | 14 | 2 | 0 | 12 |
| 5 | Singapore | 8 | 0 | 0 | 8 |
| 6 | Sweden | 7 | 0 | 0 | 7 |
| 7 | The Netherlands | 7 | 3 | 0 | 4 |
| 8 | Finland | 6 | 0 | 0 | 6 |
| 9 | South Korea | 6 | 0 | 0 | 6 |
| 10 | Denmark | 5 | 0 | 0 | 5 |
| 11 | Germany | 4 | 0 | 0 | 4 |
| 12 | Australia | 4 | 3 | 0 | 1 |
| 13 | Canada | 3 | 0 | 0 | 3 |
| 14 | New Zealand | 1 | 0 | 0 | 1 |
| 15 | France | 1 | 0 | 0 | 1 |
| 16 | Luxembourg | 1 | 0 | 0 | 1 |
| TOTAL | 253 | 31 | 16 | 206 |
Graph C.4
C.5 Agreements Signed: Year-wise
The table and graph below show the year-wise details of bilateral Agreements entered into till 31st March, 2019.
Table C.5
| Financial Year | Agreements Signed |
| 2013-14 | 0 |
| 2014-15 | 1 |
| 2015-16 | 2 |
| 2016-17 | 8 |
| 2017-18 | 9 |
| 2018-19 | 11 |
| Total | 31 |
Graph C.5

In continuation of the trend seen in financial years 2016-17 and 2017-18, a larger number of bilateral APAs were signed with Indian taxpayers after conclusion of Mutual Agreements with the Competent Authorities of Treaty partners. This trend is likely to continue as a number of bilateral APAs have been resolved with the Competent Authorities of Treaty partners and the Agreements with Indian taxpayers would be signed in due course.
In 2018-19, out of the 11 Agreements signed with Indian taxpayers, 4 pertained to Japan, 3 to Australia, 2 to Switzerland and 1 each to USA and Netherlands.
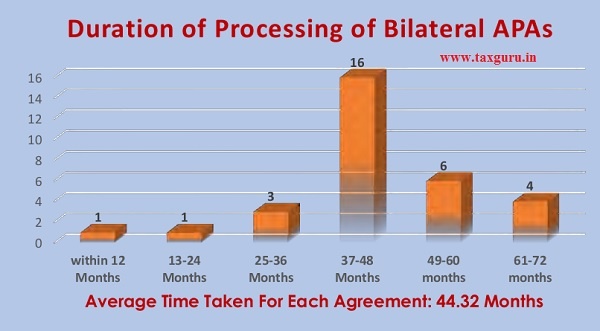
C.6 Duration of Processing
In 2018-19, the average time taken to conclude bilateral APAs has gone up to 51.82 months. The detailed analysis of this is depicted in the table and graph below. This has increased the average time taken for all bilateral APAs concluded till 31st March, 2019 from 42.10 months (as on 31st March, 2018) to 44.32 months.
Table C.6(1
| Duration | No. of Agreements Signed in FY 2018-19 |
| within 12 Months | 0 |
| 13-24 Months | 0 |
| 25-36 Months | 0 |
| 37-48 Months | 6 |
| 49-60 Months | 1 |
| 61-72 Months | 4 |
| Total | 11 |
| Average Time Taken for each Agreement – 51.82 Months | |
Graph C.6(1)

In 2018, USA took 47.8 months on an average to conclude bilateral APAs whereas, Canada took 44 months. We have taken a little more time, as some long pending APAs were concluded in 2018-19.
Table C.6(2
| Duration of processing | No. of Agreements signed till 31st March 2019 | |
| within 12 Months | 1 | |
| 13-24 Months | 1 | |
| 25-36 Months | 3 | |
| 37-48 Months | 16 | |
| 49-60 Months | 6 | |
| 61-72 Months | 4 | |
| Total | 31 | |
| Average Time Taken for each Agreement – 44.32 Months | ||
Graph C.6 (2)
C.7 Distribution of Agreements: Economic Activity-wise
The table and graph below capture the data regarding the economic activity or the pre-dominant economic activity in each of the bilateral APAs entered into during F.Y 2017-18.
Table C.7
| Sl. No | Economic Activity | No. of Agreements Signed in FY 2018-19 |
| 1 | Service | 5 |
| 2 | Manufacturing | 4 |
| 3 | Trading | 2 |
| Total | 11 |
Graph C.7

As in unilateral APAs, the service sector of the Indian economy has been overwhelmingly covered in bilateral APAs also.
C.8 Distribution of Agreements – Industry-wise
The table and the graph below reveal that there are 5 broad industry categories that have been covered under bilateral APAs concluded in F.Y 2018-19.
Table C.8
| Sl. No | Industry | No. of Agreements Signed |
| 1 | Information Technology | 5 |
| 2 | Automotive | 3 |
| 3 | Iron & Steel | 1 |
| 4 | Packaging | 1 |
| 5 | Chemicals | 1 |
| Total | 11 |
Graph C.8

C.9 Nature of Covered Transactions
During F.Y 2018-19, the following international transactions were covered in the 11 bilateral APAs signed. As can be seen, service transactions have an overwhelming dominance in the transaction mix.


C.10 Transfer Pricing Methods Adopted
The table and graph below show that TNMM continues to be the most favoured among all the TP Methods. Out of 35 covered transactions, 23 have been benchmarked by using TNMM. It is also interesting to note that the Profit Split Method has also been used in 8 covered transactions. This indicates the increase in complexity of the APA cases.
Table C.10
| Sl. No | Transfer Pricing Method | No. of Transactions |
| 1 | TNM Method | 23 |
| 2 | Profit Split Method | 8 |
| 3 | CUP Method | 3 |
| 4 | Other Method | 1 |
| Total | 35 |

CONCLUSION
The Indian APA programme has matured over the years since its commencement in July, 2012. The number of applications getting filed and Agreements getting signed bear testimony to that. Complex transfer pricing issues, which were prone to long drawn litigation, are being increasingly resolved through APAs. The resolutions have been to the satisfaction of both taxpayers and the Government. While taxpayers have managed to get certainty over transfer pricing issues for five or nine years (depending upon whether rollback provisions are applicable to an Agreement), the Government has been able to divert resources away from the audit and litigation processes to more productive work. In addition, APAs are also ensuring that the Government gets assured revenues from big taxpayers on the basis of the terms and conditions embedded in the Agreements. Though revenue mobilisation has never been the primary objective of the Indian APA programme, it is a positive externality flowing out of from the programme that provides additional and assured revenues to the Government of India. It is estimated that the 271 signed APAs have resulted in additional income of about Rs. 10,000 Crore. This translates to a tax and interest payment of about Rs. 3,600 Crore without getting into any litigation or there being any dispute.
Though the number of Agreements entered into in F.Y 2018-19 fell short of what had been achieved in F.Y 2017-18 and F.Y 2016-17, that has not impacted the Indian APA Programme in any adverse manner. The APA Programme has done very well and the Government is aware of the benefits of the programme and how it is helping in creating a positive environment for global corporate giants to do business in India. The Government is committed to strengthening the programme by providing it with adequate human and physical resources.
Source- https://www.incometaxindia.gov.in/Lists/Latest%20News/Attachments/360/FINAL_ANNUAL_REPORT_29_11_19.pdf


