Economic Policy Uncertainty in India has reduced significantly over the last decade. Coinciding with the years of policy paralysis, economic policy uncertainty was the highest in 2011-12. Since then, economic policy uncertainty has declined secularly. The continued decrease in economic policy uncertainty in India post 2015 is exceptional because it contrasts sharply with the increase in economic policy uncertainty in major countries during this period, including the US. As is expected, episodes of greater uncertainty, such as the taper tantrum in 2013 exhibit elevated economic policy uncertainty. Economic policy uncertainty also correlates strongly with the macroeconomic environment, business conditions and other economic variables that affect investment. Surges in economic policy uncertainty increase the systematic risk, and thereby the cost of capital in the economy. As a result, higher economic policy uncertainty lowers investment, especially because of the irreversibility of investment. Consistent with this thesis, an increase in economic policy uncertainty dampens investment growth in India for about five quarters. Unlike generic economic uncertainty, which cannot be controlled, policymakers can reduce economic policy uncertainty to foster a salutary investment climate in the country. The following policy changes are recommended. First, policymakers’ must make their actions predictable, provide forward guidance on the stance of policy, and reduce ambiguity/arbitrariness in policy implementation. Second, “what gets measured gets acted upon”. So, economic policy uncertainty index must be tracked at the highest level on a quarterly basis. Finally, quality assurance of processes in policy making must be implemented in Government via international quality certifications.
INTRODUCTION
6.1 What is the effect of uncertainty/ ambiguity in policy making on the investment climate in the economy? Consider, for instance, a poorly drafted law that is riddled with ambiguities, amendments, clarifications and exemptions that inevitably lead to conflicting interpretations and spawn endless litigation. Needless to say, such uncertainty can spook investors and spoil the investment climate in the economy. Such uncertainty in economic policy can be avoided. In contrast, a nation state that ensures predictability of policy action, provides forward guidance on policy action, maintains broad consistency in actual policy with the forward guidance, reduces ambiguity and arbitrariness in policy implementation creates economic policy certainty. Investors may enjoy the certainty provided by such an environment and flock to invest in this environment.
6.2 To examine this critical question and frame appropriate policy responses, it is critical to understand the differences between risk and uncertainty. Both fundamentally affect economic activity. However, while risk can be quantified, uncertainty is inherently hard to measure1. As policy making relies on judgement – within the framework set by constitutional rules and other legal constraints – it often involves discretion. Such discretion can generate uncertainty, which can impact economic activity. Among different sources of economic uncertainty, economic policy uncertainty matters significantly because this uncertainty refers to one that policymakers can control and thereby influence economic activity. For instance, while the monsoon impacts economic activity, policymakers have absolutely no control over it. However, economic policy uncertainty captures uncertainty that policymakers can control.
6.3 As uncertainty itself inherently cannot be quantified, economic policy uncertainty is difficult to quantify. However, advances in data analytics, in general, and text analytics, in particular, have made it possible to quantify uncertainty, in general, and economic policy uncertainty, in particular. A globally recognized attempt at quantifying economic policy uncertainty is the one by Baker et al. (2016), who develop an Economic Policy Uncertainty (EPU) index for various countries including India. To measure economic policy uncertainty, the index is created by quantifying newspaper coverage of policy-related economic uncertainty. The index reflects frequency of articles in leading newspapers that contain the following triple: ʻeconomic’ or ʻeconomy’; ʻuncertain’ or ʻuncertainty’; and one or more of policy related words ʻfiscal policy’, ʻmonetary policy’, ʻPMO’, ʻparliament’. Other terms for ʻpolicy’ include ʻregulation’, ʻdeficit’, ʻlegislation’, ʻreform’, ʻcentral bank’, ʻRBI’, ʻReserve Bank’, ʻfinance ministry’, ʻpolicymakers, ʻfinance minister’, ʻlawmakers, ʻplanning commission’, ʻeconomic advisor’, ʻPrime Minister’s Office’, ʻPM Office’, ʻPrime Minister Economic Advisory Council.’ Only those articles that have words from all three categories are counted for measuring economic policy uncertainty. Articles are taken from various newspapers, including, Economic Times, Times of India, Hindustan Times, The Hindu, Financial Express, Indian Express and the Statesman using access world news.
6.4 As shown later in this chapter, EPU index picks up the period of economic policy uncertainty, such as the taper tantrum of 2013, and correlates very well with other vulnerability indices like inflation volatility, stock market volatility, business sentiment index, and other macroeconomic vulnerability indices.
6.5 We then examine the impact of economic policy uncertainty on investment as it forms the core of the process of economic growth. Two key features of the decision to invest highlight the key role of uncertainty. First, investment represents a forward-looking activity. Second, it is irreversible (Pindyck and Salimano, 1993; Caballero and Pindyck, 1993; Chen and Funke, 2003; Bloom, Floetotto and Jaimovich, 2009). As investment is forward-looking, future expectations play a critical role in the decision to invest. Specifically, an investor invests in a project if the upfront costs are less than the present value of the expected rewards from the investment. As uncertainty influences these expectations, irrespective of its source, it affects the decision to invest. Conceptually, the Capital Asset Pricing model postulates that that the required return on investment correlates positively with the systematic risk underlying the investment. An increase in uncertainty in the economy increases this systematic risk and thereby increases the rate of return required to justify the investment. As a result, projects that generate a return lower than this required return become unviable when uncertainty increases in the economy. Also, as fixed investment is irreversible, uncertainty exacerbates risk-aversion, increases the premium demanded for assuming risk, and eventually dampens investment. Consistent with this thesis, the analysis indicated that an increase in economic policy uncertainty dampens investment growth in India for about five quarters. One standard deviation increase in uncertainty leads to about one percentage point decline in investment growth rate. Thus, economic policy uncertainty materially impacts the investment climate in the country.
ECONOMIC POLICY UNCERTAINTY IN INDIA
6.6 Economic Policy Uncertainty when measured using EPU index was the highest in 2011-12 coinciding with the years of policy paralysis. Economic policy uncertainty has reduced significantly over the last decade in India. Figure 1 shows that economic policy uncertainty has secularly declined from July 2012 onwards, though with intermittent episodes of elevated uncertainty in between. As is expected, episodes of greater uncertainty, such as the taper tantrum in 2013, exhibit elevated levels of the economic policy uncertainty index. Following the announcement by the Federal Reserve of tapering of their policy of monetary easing, investors in emerging markets faced uncertainty about the policies that would be adopted in these countries to control the impact of this Fed policy change. Thus, the EPU index captures this economic policy uncertainty as expected.
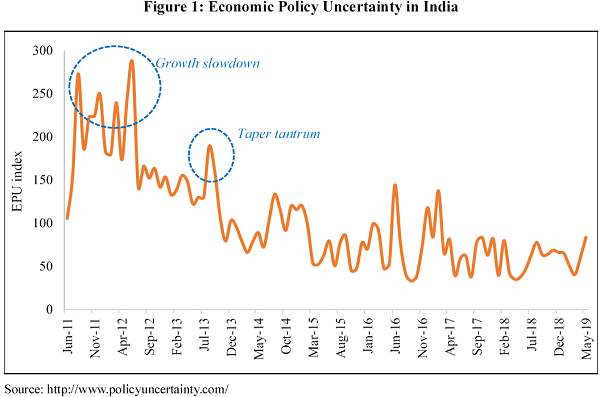
6.7 The index of economic policy uncertainty for India shows peaks in few months of 20 11 and 2012, reflecting the policy paralysis during that period, which witnessed the problems of the high twin deficits and high inflation, thereby exacerbating macroeconomic vulnerability. The index is also high in the second half of 2013 when the economy faced the episode of “taper tantrum” leading to volatile capital flows, depreciation of rupee vis-а-vis US dollar (Figure 2). The peak during GST is not as sharp, maybe due to the fact that the discussions around GST policy were happening much before it was actually implemented in July 2017. This shows that the index is picking up time periods characterized by increasing economic policy uncertainty.
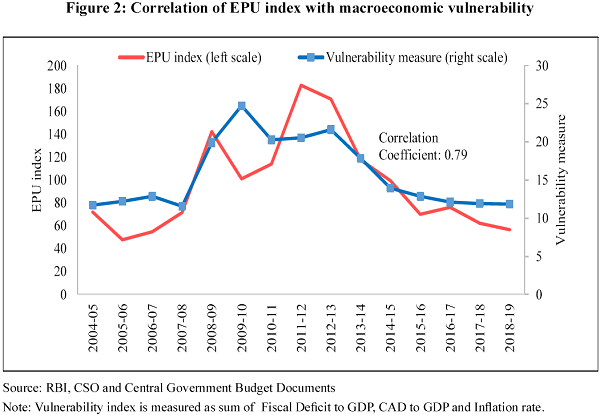
6.8 The EPU index correlates very strongly to macroeconomic stability. To examine this correlation, we use the vulnerability measure created and employed in the Economic Survey 2014-15. This measure is a sum of twin deficits i.e., fiscal deficit and current account deficit, and inflation. Figure 2 shows a strong correlation of 0.8 of this vulnerability measure with EPU index. Both the indices show almost same movements over time. This also points towards aptness of economic policy uncertainty index to be used as a yardstick for measuring impact of uncertainty with investment.
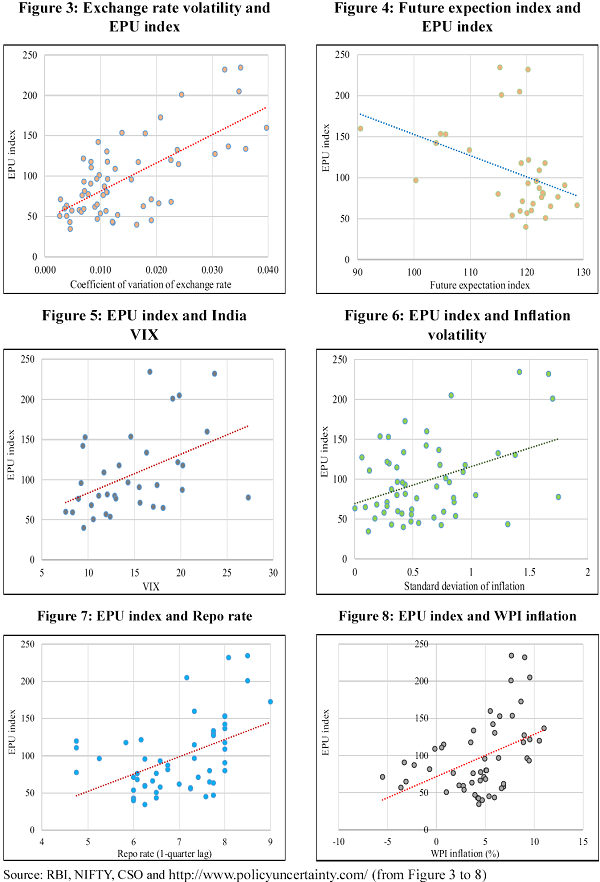
6.9 Apart from this, EPU index is very strongly correlated to volatility in exchange rate, stock market & inflation and various other macroeconomic variables. There is a correlation of around 0.7 between volatility in exchange rate and EPU index. The EPU index closely tracks both the deterioration of the future expectation index and India VIX index which monitors the volatility in stock market. It is strongly correlated to inflation rate and repo rate as well (Figures 3 to 8).
–
DECOUPLING OF ECONOMIC POLICY UNCERTAINTY IN INDIA SINCE 2015
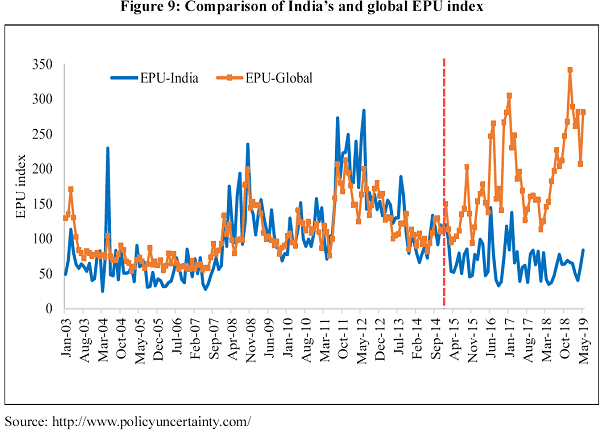
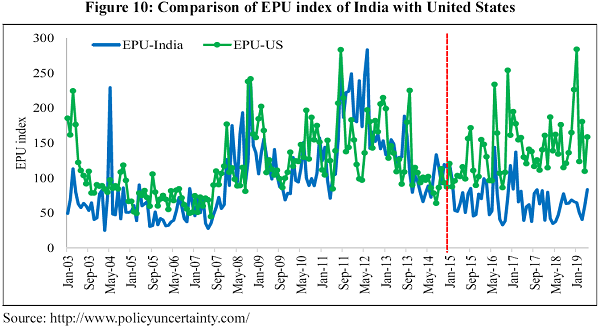
6.10 Economic policy uncertainty peaked in India during the late 2011 and early 2012 and has since been declining with intermittent increases in between. Economic policy uncertainty in India moved closely in tandem with global uncertainty until 2014. However, it started diverging since early 2015 and seems to have completely decoupled in 2018. In recent times, while the economic policy uncertainty has been increasing across the world, including US, UK and China; India’s economic policy uncertainty has been falling. Uncertainty seems to have stabilized at lower levels in case of India since last few years, which is noteworthy given the recent surge in global uncertainty, partly due to rising trade tensions between US and China, uncertainty about outcome of Brexit, slower world growth. Year 2018 saw sharp divergence of India’s economic policy uncertainty index with that of global uncertainty index, which increased sharply (Figure 9). Global uncertainty index increased from 112 to 341 in the same year, whereas that of India remained below 100.
6.11 Specifically, EPU index shows that the movements in India were almost similar to that of the US until 2015; however, the two series have diverged since then. Economic policy uncertainty in India has consistently been lower than that of US since then (Figure 10). The divergence has increased sharply since mid-2018, probably due to the rising trade tensions of US with China. The low economic policy uncertainty index for India in last one year points towards resilience of the economy even in times of global trade uncertainty.
–
GREEN SHOOTS OF TURNAROUND IN INVESTMENT ACTIVITY
6.12 Figure 11 shows that after falling for close to a decade since 2008, investment activity has turned the corner since Q1 of 2017-18. In fact, gross fixed capital formation as a proportion of GDP, commonly referred to as the fixed investment rate, fell from 37 per cent in 2007-08 to 27 per cent in the following ten years but has since recovered
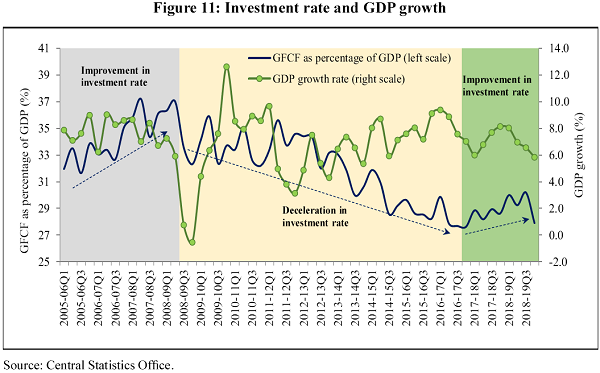
Note: Quarterly GFCF rate from 2005-06 Q1 to 2010-11 Q4 has been calculated using the quarterly to annual ratio from 2004-05 series.
to approximately 28 per cent recently. While several factors led to the investment slowdown till 2017-18, inter-alia, including the twin balance sheet problem discussed in detail in Economic Survey 2016-17, we show that a secular trend of reducing economic policy uncertainty may have helped to foster the turnaround in investment activity.
6.13 The continued resolution of the twin balance sheet problem following implementation of Insolvency and Bankruptcy Code 2016 and recapitalization of banks helped to promote investment. Focus on improvement in the business climate via measures to improve ease of doing business, clarity in the policy for FDI liberalization may have also helped in this regard by reducing economic policy uncertainty.
RELATIONSHIP OF ECONOMIC POLICY UNCERTAINTY WITH INVESTMENT IN INDIA
6.14 Internationally, there are many studies showing a significant dynamic relationship between economic policy uncertainty and real macroeconomic variables. Economic policy uncertainty as measured by EPU index foreshadows a decline in economic growth, banking crisis (Baker et al. 2016). Anand et al. (2014) found that high uncertainty and deteriorating business confidence played a role in the investment slowdown in India. Bloom et al. (2018) found that uncertainty shocks can generate drop in GDP of around 2.5 per cent with heterogeneous firms. Gluen and Ion (2013) using EPU index find that policy related uncertainty is negatively related to firm and industry level investment, and the economic magnitude of the effect is substantial. Their estimates indicate that approximately two thirds of the 32 per cent drop in corporate investments in US observed during the 2007-2009 crisis period can be attributed to policy related uncertainty. Hardouvelis et al (2018) find that shocks to economic policy uncertainty are associated with a subsequent decline in investment, industrial production, GDP, economic sentiment and the stock market. These shocks go a long way to explain not only the direction but also the magnitude of the changes in macro and financial variables during the Greek economic crisis.
6.15 The relationship of uncertainty in economic policy with investment may be through two channels. First is the direct relationship of economic policy uncertainty with investment growth and second is the relationship of EPU with other variables which in turn affect investment.
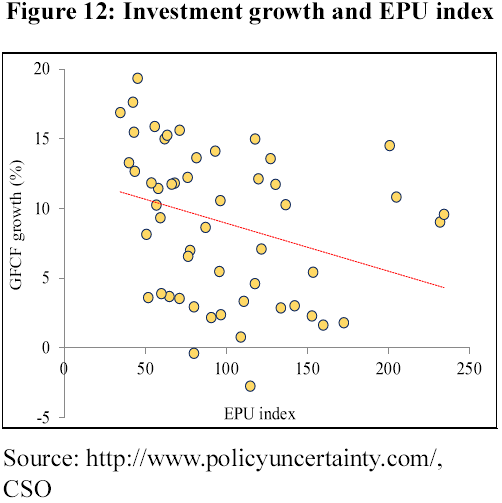
6.16 Figure 12 shows that there is a strong negative relationship between EPU index and investment growth. There is a correlation of (-)0.30 between these two variables (from Q1 of 2005-06 to Q4 of 2018-19). However, the relationship was weaker for some time period i.e., Q3 of 2009-10 to Q4 of 2013-14, when the uncertainty in the economy was declining and even the investment growth rate was declining.
6.17 Impulse response functions from the Vector Autoregressive Regression (VAR) model show after a shock i.e., higher uncertainty, the investment rate falls and then the impact withers away with time (Figure 14). The impact of a one standard deviation shock to EPU index is about 1 percentage point and it remains for many quarters (Figure 13). In fact, it can be said with sufficient confidence that the impact remains for at least five quarters (the 95 per cent confidence band remains below zero till five quarters).
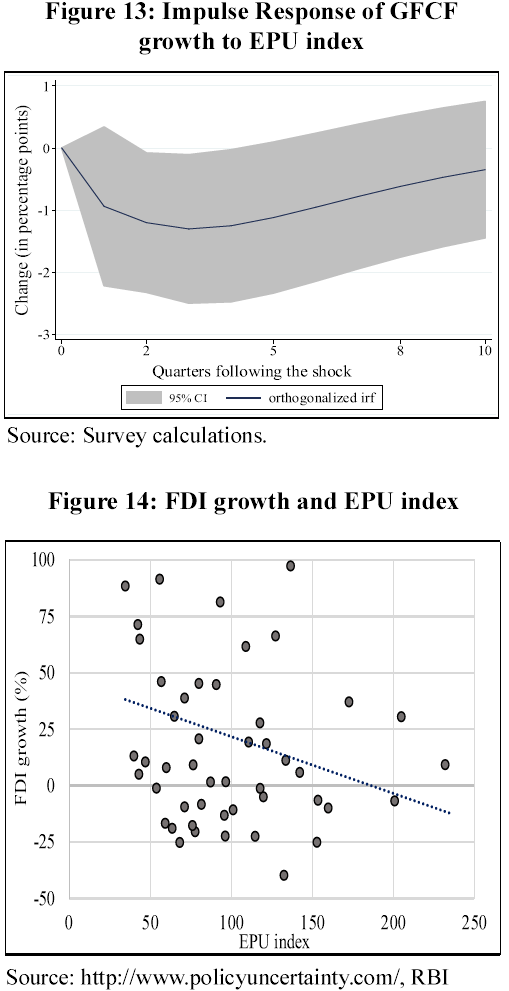
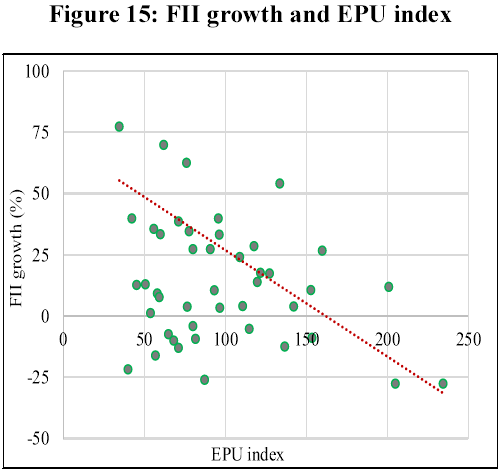
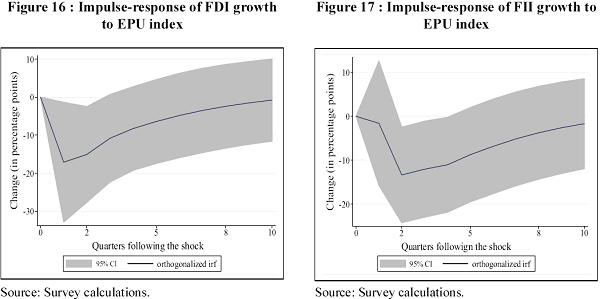
6.18 Foreign investments are also expected to be negatively related to the economic policy certainty in the economy and the data shows so as well (Figure 14 and Figure 15). Both Foreign Direct Investment (FDI) flows and Foreign Institutional Investment (FII) flows are negatively correlated to EPU index, implying that not only the short term inflows, but also long term capital inflows are affected by higher uncertainty in economic policy. Impulse Response Function of VAR also shows a significant negative impact of the shock, which lingers on about three to four quarters. However, another point to note is that the initial impact is sharper for FDI flows (Figure 16 and 17).
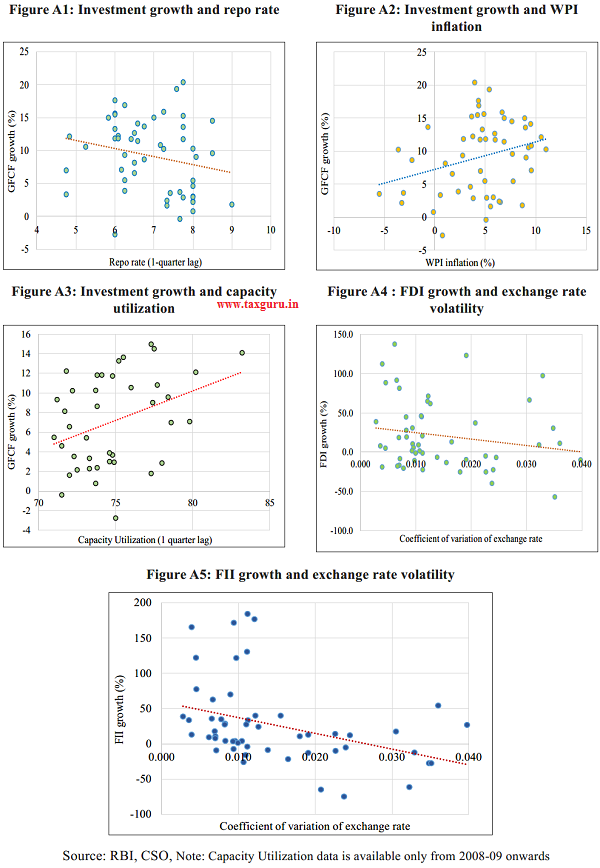
6.19 There are various other factors affecting investment. First important factor that affects investment decision is cost of borrowing. Borrowing costs, with a lag, are expected to be negatively associated with investment as they reflect higher input costs. As expected, fixed investment is negatively correlated with repo rate2, weighted average lending rate and marginal cost of lending rates of SBI. Second important factor for
–
investment is the prices that producers get for their products. Rise in prices are expected to trigger greater investments as businesses find it profitable to do so as long as consumption demand is sufficiently strong to overcome the impact of inflation. This is seen, as the investment growth is positively correlated to wholesale price inflation, but negatively to consumer price inflation. This may be due to the fact the producers would realize producer prices which are closer to wholesale prices upon selling any product, whereas consumers have to pay consumer prices and higher prices may dampen the demand. Third important factor affecting investment is capacity utilization. The utilization of capacity in any quarter is expected to have a positive relationship with investment growth in the following quarter, as excess unutilized capacity in the previous quarter may lower the need for new investment in the current quarter. Data shows a positive correlation between investment growth and capacity utilization in previous quarter (details in annex of the Chapter).
6.20 The foreign component of fixed investment, FDI and FII flows are expected to be negatively related to the volatility of exchange rate, measured by its coefficient of variation. This is because the returns that the foreign investors actually realize are in foreign currency terms, which depend on the exchange rate. If the volatility of the exchange rate is higher, it may decrease the growth of foreign inflows. It is seen that the relationship between growth in FDI and volatility of exchange rate is weak suggesting that foreign investors in projects have other considerations as well. On the other hand, a negative relationship, is seen between FII inflows and volatility of exchange rate. The negative relationship suggests that the portfolio investments which are generally short term investments are more affected by the volatility in exchange rate, as compared to FDI flows, which are generally for longer duration (details in annex of the Chapter).
6.21 Can EPU index proxy for all variables examined for impacting fixed investment in the economy? It can, if it is strongly correlated with these variables and results in previous section indicate that it is indeed correct. EPU is positively correlated to all the factors discussed above- repo rate, WPI inflation, volatility of exchange rate, and Capacity Utilization (as shown in Figure 3 to 8).
CONCLUSION AND POLICY RECOMMENDATIONS
6.22 While economic uncertainty stemming from uncontrollable factors remains beyond the control of policymakers, they can control economic policy uncertainty. Reducing economic policy uncertainty is critical because both domestic investment and foreign investment are strongly deterred by increases in domestic economic policy uncertainty.
6.23 India has secularly decreased domestic economic policy uncertainty since 2012 and has been exceptional in reducing this uncertainty since 2015 amidst a global environment of increases in the same. However, policymakers need to double down on reducing domestic economic policy uncertainty.
6.24 We outline a few steps in this regard:
1. First, top-level policymakers must ensure that their policy actions are predictable, provide forward guidance on the stance of policy, maintain broad consistency in actual policy with the forward guidance, and reduce ambiguity/arbitrariness in policy implementation. To ensure predictability, the horizon over which policies will not be changed must be mandatorily specified so that investor can be provided the assurance about future policy certainty. While this will generate some constraints in policy making, such voluntary tying of policymakers’ hands is undertaken in several cases including the Fiscal Responsibility and Budget Management Act, the Monetary Policy Framework of the Reserve Bank of India. A similar constraint placed on ensuring no changes in policy for a specified horizon would go a long way to ensuring policy certainty. The Government could also use labels such as “Standstill” versus “Ratchet up” to categorize various categories of policies according to the level of commitment about future certainty that it can provide.
2. Second, following the adage that “what gets measured gets acted upon”, economic policy uncertainty index must become an important index that policymakers at the highest level monitor on a quarterly basis. Relatedly, following the evolved academic literature in this area, government must encourage construction of economic policy uncertainty sub-indices to capture economic policy uncertainty stemming from fiscal policy, tax policy, monetary policy, trade policy, and banking policy. Tracking these sub-indices would enable monitoring and control over economic policy uncertainty.
3. Quality assurance of processes in policy making, which reflect the adage of “Document what you do, but more critically do what you document!” must be implemented in the government. The actual implementation of policy occurs at the lower levels, where ambiguity gets created and exacerbates economic policy uncertainty. As organizations in the private sector compete and seek the highest level of quality certifications, Government departments must be mandated to similarly seek quality This process of certification will require training of personnel in following quality assurance processes and will significantly reduce economic policy uncertainty.
CHAPTER AT A GLANCE
> Economic Policy Uncertainty has reduced significantly in India over the last decade.
> Continued decline in economic policy uncertainty in India post 2015 is exceptional because it contrasts sharply with the increase during this period in economic policy uncertainty in major countries, especially the U.S.
> An increase in economic policy uncertainty dampens investment growth in India for about five quarters.
> Forward guidance, consistency of actual policy with forward guidance, and quality assurance certification of processes in Government departments can help to reduce economic policy uncertainty.
> Unlike generic economic uncertainty, which cannot be controlled, policymakers can reduce economic policy uncertainty to foster a salutary investment climate in the country.
REFERENCES
Knight, Frank H. Risk, uncertainty and profit. Courier Corporation, 2012.
Pindyck, Robert S., and Andres Solimano. “Economic instability and aggregate investment.” NBER macroeconomics
annual 8 (1993): 259-303.
Chen, Yu-Fu, and Michael Funke. “Option value, policy uncertainty, and the foreign direct investment decision.” (2003).
Anand, Rahul, and Volodymyr Tulin. Disentangling India’s Investment Slowdown. No. 14-47. International Monetary Fund, 2014.
Baker, Scott R., Nicholas Bloom, and Steven J. Davis. “Measuring economic policy uncertainty.” The quarterly journal of economics 131, no. 4 (2016): 1593-1636.
Caballero, Ricardo J., and Robert S. Pindyck. Uncertainty, investment, and industry evolution. No. w4160. National Bureau of Economic Research, 1992.
Bloom, Nicholas, Max Floetotto, Nir Jaimovich, Itay Saporta `Eksten, and Stephen J. Terry. “Really uncertain business cycles.” Econometrica 86, no. 3 (2018): 103 1-1065.
Gulen, Huseyin, and Mihai Ion. “Policy uncertainty and corporate investment.” The Review of Financial Studies 29, no. 3 (2015): 523-564.
Hardouvelis, Gikas A., Georgios Karalas, Dimitrios Karanastasis, and Panagiotis Samartzis. “Economic Policy Uncertainty, Political Uncertainty and the Greek Economic Crisis.” (2018).
ANNEX
Source- Economic Survey 2018-19 Volume 1


