Mr. Abheek Barua*

The inflation print for January jumped up to 7.6% while Industrial production contracted by -0.3% in December 2019. The inflation spike was driven by higher food prices, rise in medicine and telecom prices and an unfavorable base effect. We expect the January print to be the peak as onions prices have started cooling off in recent days and the sequential momentum in food is slowing down. Moreover, the unfavorable base effect impact will fall off from February onwards. That said, we expect core inflation numbers to remain above 4% over the coming months due to idiosyncratic factors (such as the impact of the recent telecom tariffs increase). Overall, inflation prints could come in above 6% for the coming 2-3 months, before moving within the 5-6% range until August 2020. That said, the RBI could cut rates at the first opportunity they get – as soon as inflation optics look somewhat favorable (within their target band). They are likely to take comfort from their forward view of inflation falling to 3% by the end of the year. Moreover, weak IIP data (averaging at 0.6% so far this year compared to 4.4% last year), signalling that a sustainable growth recovery remains elusive, tips the scales in favor of further rate cuts. We expect the RBI to deliver a rate cut of 25bps in the first quarter of the fiscal (Apr-June 2020).
Inflation: Food drives inflation higher
- Headline CPI rose to 7.59% in January 2020 from 7.35% in the previous month (HDFC forecast: 7.5%) on the back of rising food prices and a firm core inflation figure (inflation excluding food and fuel).
- A broad-based pickup in food inflation: Food inflation remained high at 13.6%, although moderating slightly from 14% in December 2019. The biggest driver continued to be high vegetable inflation, which rose by 50% compared to 60% in December 2019. Other food categories also picked up pace, contributing to the food inflation increase. Cereals and pulses prices rose by 5% and 17% respectively. Overall protein inflation (including meat, egg, and milk products) rose to 12.5% from 11.4% in the previous month.
- Core inflation rose to 4% in January 2020 from 3.5% in December 2019, with an increase recorded in most sub-categories. The biggest jump was recorded in transport and communication, reflecting the impact of telecom tariff revisions. Also, personal care and effects inflation rose to 7% from 6% in the previous month. Both health and recreation & amusement inflation inched up by 50bps.
- Base effects: An unfavorable base effect from last year also pushed up the annual numbers in January. We estimate the base effect to be close to 40bps and inflation excluding the base effect would have been close to 7.2% in the month.
- Sequential Momentum: On a month on month basis, the rise in headline inflation moderated to 0.3% from 1.8% in the previous month. Food inflation momentum turned negative to -0.3% from 3.6% m-o-m increase in December. That said, the monthly momentum remained high at 0.6% m-o-m for the second consecutive month in core inflation.
- Rural and Urban inflation: Rural inflation rose to 7.7% while urban inflation moderated to 7.4% (from 7.5% in December). This was as food inflation in urban areas inched down 140bp in January 2020.
- Our View: We expect inflation readings to remain above 6% until April 2020. The average inflation for Q4 FY20 is likely to come in above the RBI’s estimate of 6.5%. With an inflation figure of 7.6% for January, inflation readings would have to drop to 6% over the next two months to come in line with the RBI’s projections. We think that this is unlikely as higher protein inflation could keep the pressure on food inflation, despite the fall in vegetable prices, and core inflation could remain above 4%.
Inflation spikes driven by food inflation
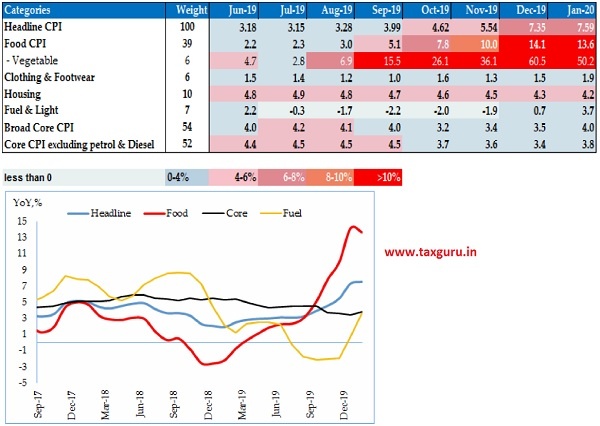
Source: MOSPI, CEIC, HDFC Bank
Index of Industrial Production (IIP): On a fragile footing
Industrial production contracted by 0.3% in December compared to 1.8% growth in November 2019. Most sub-categories of IIP registered a decline, with the sharpest fall in manufacturing activity. As the festive season effect waned off, production activity slowed down in December. Going forward, IIP readings could remain weak due to the impact of the coronavirus in China. The electronics and auto industry could see some impact because of their reliance on Chinese imports of components and raw materials.
- Manufacturing sub-index contracted by -1.2% in December from 2.7% growth in the previous month. Electricity production continued to remain in the red, although the contraction in activity moderated in the month. On the other hand, mining activity recorded positive growth of 5%, but this was in part due to a low base effect.
- It was disappointing to see the sharp drop in capital goods production (-18%) and the continued fall in construction goods production (-2.6%) in December. This was the 14th consecutive negative reading for capital goods sub-index.
- Consumer durable and non-durable goods production recorded a sharper fall in December, signalling that demand continues to be weak.
IIP falls in the red again

Source: MOSPI, CEIC, HDFC Bank
*Mr. Abheek Barua tweets at @AbheekHDFCBank.


