India is set to witness a sharp slowdown in population growth in the next two decades. Although the country as a whole will enjoy the “demographic dividend” phase, some states will start transitioning to an ageing society by the 2030s. It will surprise many readers to learn that population in the 0-19 age bracket has already peaked due to sharp declines in total fertility rates (TFR) across the country. The southern states, Himachal Pradesh, Punjab, West Bengal and Maharashtra now have fertility rates well below the replacement rate. TFR in Bihar, Uttar Pradesh, Jharkhand, Chhattisgarh, Rajasthan and Madhya Pradesh are above the replacement rate but are also experiencing significant declines. As a result, the national TFR is expected to be below replacement level by 2021 (adjusted for the skewed gender ratio, it may already be there). The age distribution, however, implies that India’s working-age population will grow by roughly 9.7mn per year during 2021-31 and 4.2mn per year in 2031-41. Meanwhile, the proportion of elementary school-going children, i.e. 5-14 age group, will witness significant declines. Contrary to popular perception, many states need to pay greater attention to consolidating/merging schools to make them viable rather than building new ones. At the other end of the age scale, policy makers need to prepare for ageing. This will need investments in health care as well as a plan for increasing the retirement age in a phased manner.
1. RECENT DEMOGRAPHIC TRENDS
7.1 Population growth in India has been slowing in recent decades from an annual growth rate of 2.5 per cent during 1971-81 to an estimated 1.3 per cent as of 2011-16 (Figure 1). All major states have witnessed a marked deceleration in population growth during this period; the slowdown in states with historically high population growth such as Bihar, Uttar Pradesh, Rajasthan and Haryana is particularly noteworthy. Population is now growing below 1 per cent in the southern states as well as West Bengal, Punjab, Maharashtra, Odisha, Assam and Himachal Pradesh1 (Figure 2).


7.2 A key driver of this trend has been the steady decline in India’s total fertility rate2 (TFR) since the mid-1980s. Though the decline in India’s TFR has been more gradual when compared to the experience of other emerging economies, it has nonetheless halved from 4.5 in 1984 to 2.3 as of 2016 (Figure 3 and Figure 4).
7.3 The replacement level fertility3 is usually marked at 2.1 but, as discussed in the next section, India’s TFR may already


be close to the effective replacement level fertility after accounting for its skewed sex ratio. Interestingly, India has reached the current TFR of 2.3 at a relatively low per capita income when compared to the experience of major developed economies but similar to that of other Asian countries (Figure 5).
7.4 Note that there is a wide variation in the experience of different Indian states. TFR is now below replacement level fertility in 13 out of the 22 major states (Figure 6). In fact, TFR has reached as low as 1.6-1.7 in states such as Delhi, West Bengal, Tamil Nadu, Andhra Pradesh, Telangana, Punjab and Himachal Pradesh. Even high fertility states such as Bihar, Jharkhand, Rajasthan, Madhya Pradesh, Chhattisgarh, Uttar Pradesh and Uttarakhand have seen a sharp decline in TFR over the years.


7.5 These developments suggest that India has entered the next stage of demographic transition with population growth set to slow markedly in the next two decades along with a significant increase in the share of working-age population (the so-called “demographic dividend” phase).
7.6 However, national-level population trends mask the significant heterogeneity across states in terms of fertility, mortality, age-structure, and the ageing phenomenon already underway in some states. The southern states, Himachal Pradesh, Punjab, West Bengal and Maharashtra are already quite advanced in the demographic transition, with (i) TFR already well below replacement level fertility; (ii) population growth mainly due to momentum; (iii) more than 10 per cent of the population over the age of 59; and (iv) at most one-third of the population below the age of 20. In contrast, states such as Bihar, Uttar Pradesh, Jharkhand, Chhattisgarh, Rajasthan and Madhya Pradesh are still in the early stages of demographic transition.
7.7 In light of continued urbanization, improvements in health care, increase in female education, and other socio-economic drivers of demographic change, Section II forecasts demographic metrics at the national and state level up to 2041. Such an exercise would enable us to understand the pace of demographic transition at the national and state level and assess which states are likely to experience significant ageing. The projected population and age-structure over the next two decades has several implications for policy, inter-alia for the (i) provision of health care, (ii) provision of old-age care, (iii) provision of school facilities, (iv) access to retirement-related financial services, (v) public pension funding, (vi) income tax revenues, (vii) labour force and labour participation rates, and (viii) retirement age. Detailed analysis of these issues is beyond the scope of this chapter. However, as an illustrative exercise, Section III looks at some policy implications for health care provision, elementary school facilities and retirement age.
II. PROJECTING NATIONAL AND STATE LEVEL POPULATION
7.8 Population and its age structure are projected at the national and state level up to 2041 following the methodology outlined in Box 1. For the purpose of analysis, Section II and III focus on 22 major states, which account for 98.4 per cent of India’s population as per Census 2011.
(i) Declining Fertility Rates
7.9 Projected values for 2021-41 suggest that TFR at the national level will continue to decline rapidly and will lie below replacement level fertility at 1.8 as early as 2021 (Table 1). In line with the fertility patterns witnessed in other countries, TFR is expected to stabilize thereafter for some time around 1.7. Such fertility levels would be close to the TFR currently seen in countries such as China, Belgium, Netherlands and Brazil.
Table 1: TFR for India and Major States, 2001-2041
| States | 2001 | 2011 | 2016 | 2021 | 2031 | 2041 |
| INDIA | 3.1 | 2.4 | 2.3 | 1.8 | 1.7 | 1.7 |
| Andhra Pradesh | 2.3 | 1.8 | 1.7 | 1.5 | 1.5 | 1.5 |
| Assam | 3.0 | 2.4 | 2.3 | 1.8 | 1.8 | 1.8 |
| Bihar | 4.4 | 3.6 | 3.3 | 2.5 | 2.0 | 1.8 |
| Chhattisgarh | 3.9 | 2.7 | 2.5 | 1.8 | 1.8 | 1.8 |
| Delhi | 2.1 | 1.9 | 1.6 | 1.5 | 1.5 | 1.5 |
| Gujarat | 2.9 | 2.4 | 2.2 | 1.9 | 1.8 | 1.8 |
| Haryana | 3.1 | 2.3 | 2.3 | 1.8 | 1.8 | 1.8 |
| Himachal Pradesh | 2.2 | 1.8 | 1.7 | 1.6 | 1.6 | 1.6 |
| Jammu & Kashmir | 2.5 | 1.9 | 1.7 | 1.5 | 1.5 | 1.5 |
| Jharkhand | 4.4 | 2.9 | 2.6 | 1.8 | 1.8 | 1.8 |
| Karnataka | 2.4 | 1.9 | 1.8 | 1.5 | 1.5 | 1.5 |
| Kerala | 1.8 | 1.8 | 1.8 | 1.8 | 1.8 | 1.8 |
| Madhya Pradesh | 3.9 | 3.1 | 2.8 | 2.0 | 1.8 | 1.8 |
| Maharashtra | 2.4 | 1.8 | 1.8 | 1.5 | 1.5 | 1.5 |
| Odisha | 2.6 | 2.2 | 2.0 | 1.8 | 1.8 | 1.8 |
| Punjab | 2.4 | 1.8 | 1.7 | 1.6 | 1.6 | 1.6 |
| Rajasthan | 4.0 | 3.0 | 2.7 | 1.9 | 1.8 | 1.8 |
| Tamil Nadu | 2.0 | 1.7 | 1.6 | 1.5 | 1.5 | 1.5 |
| Telangana | 2.3 | 1.8 | 1.7 | 1.6 | 1.6 | 1.6 |
| Uttar Pradesh | 4.5 | 3.4 | 3.1 | 2.0 | 1.8 | 1.8 |
| Uttarakhand | 4.5 | 3.4 | 1.9 | 1.6 | 1.6 | 1.6 |
| West Bengal | 2.4 | 1.7 | 1.6 | 1.5 | 1.5 | 1.5 |
Source: Census, Sample Registration System, IIPS projections
Note: Projected values for 2021-41 are based on fitted model values from 20-year trends of TFR based on estimates from Sample Registration System. Before 2016, the values of Andhra Pradesh are assigned to Telangana.
|
Box 1: Methodology for Population Projections |
|
Using the 2011 Census data as baseline, population is projected by age-structure up to 2041. These projections are undertaken both at the national level and for 36 states and Union Territories (UTs). The cohort-component methodology (Cannan, 1895 and George et al, 2004) is followed for population projections at the national level and for 22 major states that account for 98.4 per cent of India’s population using assumptions for fertility, mortality, life expectancy and sex ratio at birth. These assumptions at the national level are derived using the assumptions for states weighted by their share in national population. No inter-state migration is assumed since the Census 2011 data on net inter-state migration by age-structure has not been published. International migration is not taken into consideration. The age-sex population is smoothened and adjusted for the population category of “age not stated” using a point formula similar to the methodology used in government’s official projections (Office of Registrar General of India, 2006). Population Projections for Smaller States and UTs: The eight smaller states (Arunachal Pradesh, Goa, Manipur, Meghalaya, Mizoram, Sikkim, Nagaland and Tripura) and six UTs (Chandigarh, Puducherry, Daman & Diu, Dadra & Nagar Haveli, Lakshadweep and Andaman & Nicobar) account only 1.6 per cent of India’s population. Due to constraints in obtaining reliable estimates for long-term trends in mortality and fertility, the ratio method (Pittenger, 1976 and U.S. Census Bureau, 1952) is used for population projection. The ratio of the small area (say a small state) to the larger area (say India) is calculated and assumed to remain constant up to 2041. For each year, this ratio is multiplied by the projected population of the larger area, as derived using the cohort-component methodology, to obtain the population projections for these states and UTs. Mortality Rate: A log-linear model is used to project mortality using life expectancy at birth for 1970-2016 from the Sample Registration System’s Life Tables, fitted separately for male and female4:
Life expectancy is projected to continue to rise during the projection period from 67.2 years in 2016 to 71.4 years in 2041 for males, and more significantly, from 70.3 years in 2016 to 75.3 years in 2041 for females5. Fertility Rate: TFR is projected up to 2041 using the Gompertz method (Gompertz, 1825) based on the lower (L) and upper (U) limits of TFR and the base period TFR, where the latest available TFR is inserted:
The lower limit (L) of TFR is taken between 1.2-1.8 for different states, and the upper limit (U) of TFR is taken to be the value of TFR in the base period, given that TFR across states is on a downward trend currently. TFR for time period t is projected using the estimated parameters a and b using the Ordinary Least Squares (OLS) regression. Sex Ratio: Both sex ratio at birth and sex differentials in survival probability are taken into consideration to determine the sex ratio of the population. Sex ratio at birth is assumed to remain constant at the 2014-16 levels since it already stands below 1.10 in 12 out of the 22 major states and is not expected to decline significantly in the next two decades in the remaining 10 states. |


7.10 At the state level, those already below replacement level fertility, including the southern states, West Bengal, Punjab, Maharashtra and Himachal Pradesh, are expected to see TFR decline further by 2021, reaching as low as 1.5-1.6 and stabilizing thereafter. Even states lagging behind in the fertility transition are expected to see TFR fall significantly below replacement level to 1.8. This would be as early as 2021 in Jharkhand, Haryana and Chhattisgarh, and by 2031 in Uttar Pradesh, Rajasthan and Madhya Pradesh. In fact, by 2031, all states would see below replacement level fertility.
7.11 This is in line with expectations of further decline in fertility for females in the 20-30 age-group, driven by rising female education, postponement of marriage, access to family planning methods, and continued decline in infant mortality. While family planning programs have played a major role in reducing fertility in India in the past decades, these socio-economic changes have manifested over the last 10-15 years.
7.12 The projections for TFR in Table 1 are based on the assumption that sex ratio at birth will remain at current levels over the next two decades. As of 2014-16, sex ratio at birth remains higher than the normal range of 1.02-1.076 at the national level and in 17 out of 22 major states. Thus, there are more men than women in the population when compared to the natural level. This implies that the required replacement level fertility at the national and state level is higher than the usual benchmark of 2.1, i.e., due to the skewed sex ratio, a woman would have to give birth to more than 2.1 children in order for the population to replace itself. Our estimates suggest that the effective replacement level fertility after taking into account the skewed sex ratio could be around 2.15-2.2 for India with a sex ratio of 1.11; around 2.2-2.25 for states such as Haryana, Uttarakhand and Gujarat with the sex ratio as high as 1.151.20; and between 2.1-2.2 for the remaining states with the sex ratio around 1.07-1.14. Interestingly, the current TFR in 14 out of the 22 major states is already below the effective replacement level fertility.
(ii) Population Growth Trajectory
7.13 Demographic projections show that India’s population growth will continue to slow rapidly over the next two decades, growing less than 1 percent during 202131 and under 0.5 per cent during 2031-41 (Table 2). Such population growth rates would be close to the trend currently seen in countries such as Germany and France. In fact, with TFR projected to fall well below replacement level fertility by 2021, positive population growth in the next two decades will be due to population momentum and the continued rise in life expectancy.
7.14 Given state-level differences in initial fertility levels, mortality and age composition, both the trajectory of population and population growth will continue to vary across states. States ahead in the demographic transition will see a continued deceleration in population growth and reach near-zero growth rates by 2031-41. With population peaking by 2031, Tamil Nadu’s population growth will start declining during 2031-41 unless offset by inward migration. Population growth will be close to zero in Andhra Pradesh and as low as 0.1-0.2 per cent in Karnataka, Kerala, Telangana, Himachal Pradesh, West Bengal, Punjab and Maharashtra.
7.15 States lagging behind in the demographic transition will also witness a marked slowdown in population growth during 2021-41. Population growth will halve over the next two decades in Chhattisgarh, Uttar Pradesh, Rajasthan and Madhya Pradesh. Bihar alone will have a population growth rate of 1 per cent. Nonetheless, together with Jharkhand, these states will account for nearly two-thirds of the increase in India’s population during 2021-41, with
Table 2: Annual Population Growth Rate (in per cent) for India and Major States
| States | 2001-11 | 2011-21 | 2021-31 | 2031-41 |
| INDIA | 1.77 | 1.12 | 0.72 | 0.46 |
| Andhra Pradesh | 1.10 | 0.65 | 0.31 | 0.02 |
| Assam | 1.71 | 0.74 | 0.77 | 0.48 |
| Bihar | 2.54 | 1.82 | 1.34 | 1.00 |
| Chhattisgarh | 2.26 | 1.17 | 0.76 | 0.57 |
| Delhi | 2.12 | 1.00 | 0.62 | 0.30 |
| Gujarat | 1.93 | 1.12 | 0.71 | 0.44 |
| Haryana | 1.99 | 1.08 | 0.70 | 0.44 |
| Himachal Pradesh | 1.29 | 0.64 | 0.57 | 0.24 |
| Jammu & Kashmir | 2.36 | 0.88 | 0.82 | 0.49 |
| Jharkhand | 2.24 | 1.39 | 0.97 | 0.82 |
| Karnataka | 1.56 | 0.75 | 0.36 | 0.10 |
| Kerala | 0.49 | 0.66 | 0.45 | 0.18 |
| Madhya Pradesh | 2.03 | 1.36 | 0.81 | 0.64 |
| Maharashtra | 1.60 | 0.73 | 0.42 | 0.15 |
| Odisha | 1.40 | 0.82 | 0.63 | 0.38 |
| Punjab | 1.39 | 0.71 | 0.42 | 0.11 |
| Rajasthan | 2.13 | 1.47 | 0.96 | 0.75 |
| Tamil Nadu | 1.56 | 0.56 | 0.25 | -0.05 |
| Telangana | N/A | 0.80 | 0.53 | 0.21 |
| Uttar Pradesh | 2.02 | 1.48 | 0.93 | 0.73 |
| Uttarakhand | 1.88 | 1.30 | 0.70 | 0.50 |
| West Bengal | 1.38 | 0.71 | 0.50 | 0.14 |
Source: Census, IIPS projections.
just Uttar Pradesh and Bihar accounting for over 40 per cent of the increase (Table 3).
(iii) Changing Age Composition
7.16 With TFR reaching low levels and longevity continuing to increase, India’s population at the national level and in several states will begin ageing significantly in just a decade from now. The share of India’s young, i.e. 0-19 years, population has already started
to decline and is projected to drop from as high as 41 per cent in 2011 to 25 per cent by 2041 (Table 4). On the other hand, the share of elderly, 60 years and above, population will continue to rise steadily, nearly doubling from 8.6 per cent in 2011 to 16 per cent by 2041. India’s demographic dividend will peak around 2041, when the share of working-age, i.e. 20-59 years, population is expected to hit 59 per cent. With changing demographic
Table 3: Population (in millions) for India and Major States, 2011- 2041
| States | 2011 | 2016 | 2021 | 2031 | 2041 | Projected growth during 2021-41 (%) |
| INDIA | 1210.6 | 1286.1 | 1346.9 | 1443.2 | 1510.2 | 12.1 |
| Andhra Pradesh | 49.4 | 51.2 | 52.6 | 54.2 | 54.3 | 3.4 |
| Assam | 31.2 | 32.2 | 33.5 | 36.1 | 37.9 | 12.9 |
| Bihar | 104.1 | 113.8 | 123.0 | 139.5 | 153.4 | 24.7 |
| Chhattisgarh | 25.5 | 27.3 | 28.5 | 30.7 | 32.4 | 13.8 |
| Delhi | 16.8 | 17.7 | 18.5 | 19.6 | 20.2 | 9.4 |
| Gujarat | 60.4 | 64.1 | 67.2 | 72.0 | 75.2 | 11.8 |
| Haryana | 25.4 | 26.9 | 28.1 | 30.0 | 31.4 | 11.7 |
| Himachal Pradesh | 6.9 | 7.1 | 7.3 | 7.7 | 7.9 | 8.2 |
| Jammu & Kashmir | 12.5 | 13.1 | 13.6 | 14.8 | 15.5 | 13.4 |
| Jharkhand | 33.0 | 35.7 | 37.6 | 41.2 | 44.6 | 18.8 |
| Karnataka | 61.1 | 63.7 | 65.7 | 68.1 | 68.7 | 4.7 |
| Kerala | 33.4 | 34.6 | 35.6 | 37.2 | 37.9 | 6.4 |
| Madhya Pradesh | 72.6 | 78.1 | 82.5 | 89.2 | 94.9 | 15.0 |
| Maharashtra | 112.4 | 117.0 | 120.6 | 125.7 | 127.6 | 5.8 |
| Odisha | 42.0 | 43.8 | 45.4 | 48.2 | 50.1 | 10.3 |
| Punjab | 27.7 | 28.8 | 29.7 | 31.0 | 31.3 | 5.3 |
| Rajasthan | 68.5 | 74.1 | 78.6 | 86.1 | 92.6 | 17.8 |
| Tamil Nadu | 72.1 | 74.5 | 76.2 | 78.1 | 77.7 | 2.0 |
| Telangana | 35.2 | 36.7 | 38.0 | 40.0 | 40.9 | 7.4 |
| Uttar Pradesh | 199.8 | 216.2 | 229.3 | 250.7 | 269.0 | 17.3 |
| Uttarakhand | 10.1 | 10.9 | 11.4 | 12.2 | 12.8 | 12.3 |
| West Bengal | 91.3 | 94.8 | 97.8 | 102.7 | 104.2 | 6.5 |
Source: Census, Sample Registration System, IIPS projections.
composition, India’s age-structure by 2041 will resemble that of China and Thailand as seen during the current decade.
7.17 All major states are projected to witness a decline in the share of young population and an increase in the share of elderly population over the next two decades. States ahead in the demographic transition, such as Himachal Pradesh, West Bengal, Maharashtra, Punjab and most of the southern states, would have less than one-fourth of the population under the age of 20 but about one-fifth or more population over the age of 59 by 2041.
7.18 Even states in earlier stages of demographic transition, such as Bihar, Uttar Pradesh, Jharkhand, Chhattisgarh, Madhya Pradesh and Rajasthan, will see a significant decline in the share of young population, though these shares will remain relatively
Table 4: Population by Age Structure (per cent share of population)
for India and Major States, 2011-2041
0-19 years |
20-59 years |
60 years and above |
||||||||||
States |
2011 |
2021 |
2031 |
2041 |
2011 |
2021 |
2031 |
2041 |
2011 |
2021 |
2031 |
2041 |
INDIA |
40.9 |
34.5 |
28.8 |
25.2 |
50.5 |
55.8 |
58.8 |
58.9 |
8.6 |
9.7 |
12.4 |
15.9 |
Andhra Pradesh |
34.8 |
28.4 |
24.4 |
21.4 |
55.1 |
59.6 |
60.2 |
58.6 |
10.1 |
12.0 |
15.4 |
20.0 |
Assam |
42.7 |
35.4 |
29.1 |
26.8 |
50.6 |
56.7 |
60.1 |
58.8 |
6.7 |
7.9 |
10.9 |
14.4 |
Bihar |
49.4 |
43.5 |
35.1 |
30.1 |
43.2 |
48.9 |
55.9 |
58.3 |
7.4 |
7.7 |
9.1 |
11.6 |
Chhattisgarh |
42.3 |
36.0 |
30.5 |
27.2 |
49.9 |
55.0 |
58.0 |
58.5 |
7.9 |
8.9 |
11.6 |
14.4 |
Delhi |
37.2 |
29.2 |
23.5 |
20.2 |
56.0 |
61.1 |
61.9 |
58.5 |
6.8 |
9.7 |
14.6 |
21.2 |
Gujarat |
38.7 |
33.2 |
28.6 |
25.1 |
53.3 |
56.8 |
58.2 |
57.9 |
8.0 |
9.9 |
13.2 |
17.0 |
Haryana |
40.3 |
33.5 |
28.4 |
24.9 |
51.0 |
57.1 |
59.5 |
59.3 |
8.7 |
9.5 |
12.1 |
15.8 |
Himachal Pradesh |
35.3 |
29.0 |
24.5 |
22.0 |
54.5 |
58.8 |
59.3 |
56.9 |
10.3 |
12.2 |
16.1 |
21.1 |
Jammu & Kashmir |
43.7 |
33.8 |
24.5 |
23.0 |
48.9 |
57.1 |
62.9 |
59.8 |
7.4 |
9.1 |
12.6 |
17.2 |
Jharkhand |
45.9 |
38.8 |
31.0 |
28.0 |
46.9 |
52.8 |
58.5 |
58.7 |
7.2 |
8.4 |
10.6 |
13.4 |
Karnataka |
35.8 |
29.8 |
25.0 |
21.7 |
54.7 |
59.0 |
60.5 |
59.3 |
9.5 |
11.1 |
14.5 |
19.0 |
Kerala |
31.3 |
27.6 |
24.9 |
23.3 |
56.2 |
56.2 |
54.7 |
52.8 |
12.6 |
16.2 |
20.5 |
23.9 |
Madhya Pradesh |
43.8 |
38.0 |
31.8 |
27.3 |
48.4 |
53.7 |
57.6 |
59.3 |
7.9 |
8.3 |
10.6 |
13.4 |
Maharashtra |
36.2 |
29.5 |
24.1 |
21.2 |
53.9 |
59.0 |
60.9 |
59.0 |
9.9 |
11.5 |
14.9 |
19.7 |
Odisha |
38.2 |
32.6 |
28.3 |
26.1 |
52.3 |
56.7 |
58.2 |
57.3 |
9.5 |
10.8 |
13.4 |
16.6 |
Punjab |
35.8 |
28.2 |
23.8 |
21.0 |
53.9 |
59.5 |
60.2 |
58.4 |
10.4 |
12.3 |
16.0 |
20.6 |
Rajasthan |
45.5 |
38.3 |
31.5 |
27.3 |
47.1 |
53.4 |
58.0 |
59.5 |
7.5 |
8.2 |
10.4 |
13.3 |
Tamil Nadu |
32.3 |
27.0 |
23.2 |
20.6 |
57.3 |
59.7 |
59.2 |
56.9 |
10.4 |
13.3 |
17.6 |
22.6 |
Telangana |
37.0 |
30.0 |
26.0 |
23.0 |
53.8 |
59.4 |
60.5 |
58.8 |
9.2 |
10.6 |
13.5 |
18.2 |
Uttar Pradesh |
47.6 |
39.4 |
32.6 |
27.7 |
44.6 |
52.7 |
57.9 |
60.3 |
7.8 |
7.9 |
9.5 |
12.0 |
Uttarakhand |
42.2 |
35.2 |
29.4 |
24.1 |
48.8 |
55.1 |
58.6 |
60.6 |
9.0 |
9.7 |
12.1 |
15.3 |
West Bengal |
37.1 |
29.1 |
24.2 |
21.9 |
54.4 |
59.8 |
60.6 |
58.4 |
8.5 |
11.1 |
15.2 |
19.7 |
Source: Census, IIPS projections.
high and as large as 30 per cent in Bihar by 2041. Meanwhile, the share of elderly population in these states will still be below 15 per cent through 2041.
(iv) Implications for Working-Age Population
7.19 While most of the discussion on demographic dividend revolves around the share of working-age population, changes in the size of working-age population plays a key role in determining the size of labour force and direction of inter-state labour migration.
7.20 Given changing age composition, India’s working-age population will continue to increase through 2041, rising by 96.5 million during 2021-31 and by 41.5 million during 2031-41 (Table 5). This will have implications for the required rate of job creation in the economy. As per the NSSO Periodic Labour Force Survey 2017-18, India’s labour force participation rate for the age-group 15-59 years is around 53 per cent (80 per cent for males, 25 per cent for females). Depending on the trajectory of labour force participation during 2021-41, additional jobs will need to be created to keep pace with the projected annual increase in working-age population of 9.7 million during 2021-31 and 4.2 million during 2031-41. Projecting labour force participation is beyond the scope of this study, but this will be impacted by changes in schooling years, age distribution and female labour force participation.
7.21 The evolution of working-age population, moreover, will vary across states. The size of working-age population will start to decline in 11 out of the 22 major states during 2031-41, including in the southern states, Punjab, Maharashtra, West Bengal and Himachal Pradesh. On the other hand, working-age population will continue to rise through 2041 in states lagging behind in the demographic transition, particularly Bihar, Uttar Pradesh, Madhya Pradesh and Rajasthan. In principle, the latter states with rising working-age population could meet the labour deficit in many of the former ageing states. Current migration trends broadly follow this pattern, and a study of this phenomenon will be the subject of a future Economic Survey.
III. POLICY IMPLICATIONS OF AGEING
(i) Elementary Schools
7.22 As of 2016, population in the 5-14 age-group, which roughly corresponds to the number of elementary school-going children, has already begun declining in India and across all major states except Jammu & Kashmir. Population projections suggest that this trend will continue through 2041 (Table 6). The size of the 5-14 years population will drop sharply in Himachal Pradesh, Uttarakhand, Tamil Nadu, Maharashtra, Punjab, Andhra Pradesh and Karnataka by 2041. Note that it will decline even in the laggard states such as Bihar, Uttar Pradesh, Rajasthan and Madhya Pradesh. Overall, the number of school-going children in India will decline by 18.4 per cent between 2021 and 2041. This will have very important social and economic consequences.
7.23 To understand the implications for the provision of elementary schools, we examine the number of government and private schools per capita of 5-14 years population and school enrolment at the national and state level. In light of the projected decline in elementary school-going children, the number of schools per capita will rise significantly in India across all major states even if no more schools are added (Figure 7 and Figure 8).
Table 5: Population by Age Structure (in millions) for India and Major States, 2011-2041
0-19 years |
20-59 years |
60 years and above |
||||||||||
States |
2011 |
2021 |
2031 |
2041 |
2011 |
2021 |
2031 |
2041 |
2011 |
2021 |
2031 |
2041 |
INDIA |
494.7 |
464.2 |
415.8 |
381.0 |
611.7 |
751.6 |
848.2 |
889.7 |
104.2 |
131.1 |
179.3 |
239.4 |
Andhra Pradesh |
17.2 |
14.9 |
13.3 |
11.6 |
27.2 |
31.3 |
32.6 |
31.9 |
5.0 |
6.3 |
8.3 |
10.9 |
Assam |
13.3 |
11.9 |
10.5 |
10.2 |
15.8 |
19.0 |
21.7 |
22.2 |
2.1 |
2.6 |
3.9 |
5.5 |
Bihar |
51.4 |
53.5 |
48.9 |
46.2 |
45.0 |
60.1 |
77.9 |
89.4 |
7.7 |
9.4 |
12.7 |
17.8 |
Chhattisgarh |
10.8 |
10.3 |
9.4 |
8.8 |
12.7 |
15.7 |
17.8 |
19.0 |
2.0 |
2.6 |
3.5 |
4.7 |
Delhi |
6.2 |
5.4 |
4.6 |
4.1 |
9.4 |
11.3 |
12.1 |
11.8 |
1.1 |
1.8 |
2.9 |
4.3 |
Gujarat |
23.4 |
22.3 |
20.6 |
18.9 |
32.2 |
38.2 |
41.9 |
43.5 |
4.8 |
6.7 |
9.5 |
12.8 |
Haryana |
10.2 |
9.4 |
8.5 |
7.8 |
12.9 |
16.0 |
17.9 |
18.6 |
2.2 |
2.7 |
3.6 |
5.0 |
Himachal Pradesh |
2.4 |
2.1 |
1.9 |
1.7 |
3.7 |
4.3 |
4.6 |
4.5 |
0.7 |
0.9 |
1.2 |
1.7 |
Jammu & Kashmir |
5.5 |
4.6 |
3.6 |
3.6 |
6.1 |
7.8 |
9.3 |
9.3 |
0.9 |
1.2 |
1.9 |
2.7 |
Jharkhand |
15.2 |
14.6 |
12.8 |
12.5 |
15.5 |
19.8 |
24.1 |
26.2 |
2.4 |
3.2 |
4.4 |
6.0 |
Karnataka |
21.9 |
19.6 |
17.0 |
14.9 |
33.4 |
38.8 |
41.2 |
40.8 |
5.8 |
7.3 |
9.9 |
13.0 |
Kerala |
10.5 |
9.8 |
9.3 |
8.8 |
18.8 |
20.0 |
20.3 |
20.0 |
4.2 |
5.8 |
7.6 |
9.0 |
Madhya Pradesh |
31.8 |
31.3 |
28.4 |
25.9 |
35.1 |
44.3 |
51.4 |
56.2 |
5.7 |
6.9 |
9.4 |
12.7 |
Maharashtra |
40.7 |
35.6 |
30.4 |
27.1 |
60.5 |
71.2 |
76.6 |
75.4 |
11.1 |
13.9 |
18.8 |
25.2 |
Odisha |
16.0 |
14.8 |
13.7 |
13.1 |
21.9 |
25.7 |
28.1 |
28.7 |
4.0 |
4.9 |
6.5 |
8.3 |
Punjab |
9.9 |
8.4 |
7.4 |
6.6 |
15.0 |
17.7 |
18.6 |
18.3 |
2.9 |
3.7 |
4.9 |
6.4 |
Rajasthan |
31.2 |
30.1 |
27.2 |
25.3 |
32.3 |
42.0 |
50.0 |
55.1 |
5.1 |
6.5 |
9.0 |
12.3 |
Tamil Nadu |
23.3 |
20.6 |
18.1 |
16.0 |
41.3 |
45.5 |
46.3 |
44.2 |
7.5 |
10.1 |
13.7 |
17.5 |
Telangana |
13.0 |
11.4 |
10.4 |
9.4 |
18.9 |
22.6 |
24.2 |
24.0 |
3.2 |
4.0 |
5.4 |
7.4 |
Uttar Pradesh |
95.1 |
90.3 |
81.8 |
74.5 |
89.1 |
120.9 |
145.0 |
162.2 |
15.6 |
18.1 |
23.8 |
32.3 |
Uttarakhand |
4.3 |
4.0 |
3.6 |
3.1 |
4.9 |
6.3 |
7.1 |
7.7 |
0.9 |
1.1 |
1.5 |
2.0 |
West Bengal |
33.8 |
28.5 |
24.9 |
22.8 |
49.7 |
58.5 |
62.2 |
60.9 |
7.8 |
10.8 |
15.6 |
20.5 |
Source: Census, IIPS projections.
Table 6: Population for 5-14 years (in millions) for India and Major States, 2011-41
| States | 2011 | 2016 | 2021 | 2031 | 2041 | Projected change during 2021-41 (%) |
| INDIA | 260.54 | 243.60 | 234.64 | 202.96 | 191.51 | -18.38 |
| Andhra Pradesh | 8.72 | 7.88 | 7.44 | 6.52 | 5.82 | -21.78 |
| Assam | 7.04 | 6.60 | 5.90 | 5.14 | 5.22 | -11.47 |
| Bihar | 29.07 | 28.25 | 26.95 | 24.46 | 23.10 | -14.28 |
| Chhattisgarh | 5.65 | 5.33 | 5.28 | 4.45 | 4.46 | -15.60 |
| Delhi | 3.19 | 2.94 | 2.71 | 2.26 | 2.06 | -24.07 |
| Gujarat | 12.03 | 11.41 | 11.29 | 10.11 | 9.42 | -16.57 |
| Haryana | 5.17 | 4.88 | 4.76 | 4.16 | 3.91 | -17.87 |
| Himachal Pradesh | 1.23 | 1.14 | 1.05 | 0.95 | 0.88 | -16.59 |
| Jammu & Kashmir | 2.83 | 2.86 | 2.35 | 1.77 | 1.86 | -20.65 |
| Jharkhand | 8.27 | 7.92 | 7.63 | 5.90 | 6.44 | -15.60 |
| Karnataka | 10.99 | 10.34 | 9.95 | 8.32 | 7.46 | -25.00 |
| Kerala | 5.38 | 5.12 | 4.89 | 4.64 | 4.42 | -9.56 |
| Madhya Pradesh | 16.85 | 15.87 | 15.99 | 13.74 | 12.90 | -19.34 |
| Maharashtra | 20.63 | 19.43 | 17.99 | 14.85 | 13.67 | -24.02 |
| Odisha | 8.45 | 7.83 | 7.37 | 6.75 | 6.60 | -10.43 |
| Punjab | 4.96 | 4.49 | 4.11 | 3.69 | 3.27 | -20.35 |
| Rajasthan | 16.49 | 15.59 | 15.41 | 13.09 | 12.70 | -17.57 |
| Tamil Nadu | 11.74 | 10.94 | 10.31 | 8.98 | 8.00 | -22.40 |
| Telangana | 6.64 | 6.01 | 5.64 | 5.17 | 4.70 | -16.57 |
| Uttar Pradesh | 51.35 | 46.06 | 45.62 | 39.36 | 37.45 | -17.91 |
| Uttarakhand | 2.21 | 2.00 | 2.11 | 1.65 | 1.54 | -26.98 |
| West Bengal | 17.43 | 15.78 | 14.05 | 12.38 | 11.55 | -17.79 |
Source: Census, Sample Registration System, IIPS projections.


7.24 States such as Himachal Pradesh, Uttarakhand, Andhra Pradesh and Madhya Pradesh have more than 40 per cent of elementary schools with fewer than 50 students enrolled (Figure 9). Similar trends

exist in Chhattisgarh, Assam and Odisha with large number of schools per capita and small school size. In fact, the number of elementary schools with less than 50 students has increased over the past decade across all major states except Delhi.
7.25 The “optimal” school size varies widely according to terrain and urban clustering, but this sharp increase in number of elementary schools per capita needs to be carefully studied. The time may soon come in many states to consolidate/merge elementary schools in order to keep them viable. Schools located within 1-3 kms radius of each other can be chosen for this purpose to ensure no significant change in access. This would also be in line with the experience of other major economies witnessing a decline in elementary school-going population, such as Japan, China, South Korea, Singapore and Canada, which have implemented policies to merge or close down schools. Note that this is not about reducing investment in elementary education, but an argument for shifting policy emphasis from quantity towards quality and efficiency of education.
(ii) Health Care Facilities
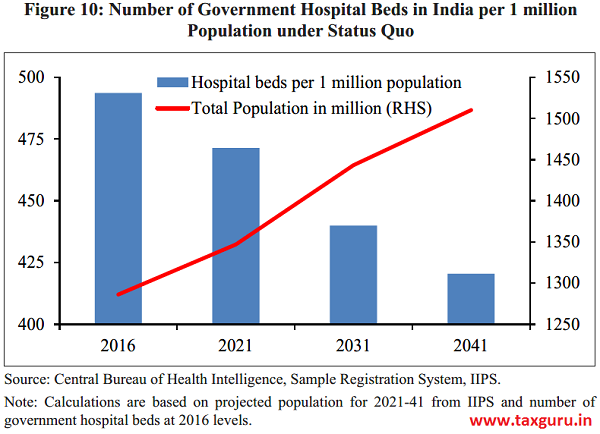
7.26 Access to health care is still a major challenge in India. If India’s hospital facilities remain at current levels, rising population over the next two decades (even with slowing population growth rates) will sharply reduce the per capita availability of hospital beds in India across all major states (Figure 10). India already fares poorly relative to other emerging and developed economies in terms of per capita availability of hospital beds (Figure 11).
7.27 States with high population growth (Table 2) are also the ones with the lowest per capita availability of hospital beds (Figure 12). Hence, there is a straightforward case for expanding medical facilities in these states. For states in the advanced stage of demographic transition, however, the rapidly changing age structure (Table 5) will mean that the type of health care services will have


to adapt towards greater provision of geriatric care. A major problem with planning for the provision of medical facilities is the paucity of specific data, especially on private hospitals. Available data on government hospitals have been used here but it is clear even from basic research that it does not provide a true picture of the quality or quantity of health care in the country.
(iii) Retirement Age
7.28 India’s healthy life expectancy at the age of 60, which is the average number of years a 60-year old person is expected to live in full health taking into account the impact of diseases and injuries, has continually increased over the years for both men and women. Healthy life expectancy at the age of 60 now stands at 12.9 years (12.5 years for males; 13.3 years for females), though it is still much lower than that for other major developed and emerging economies (Figure 13).
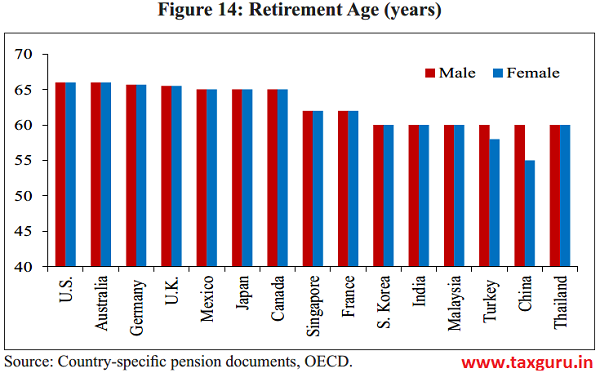
7.29 Due to ageing population and increasing pressure on pension funding, many countries have begun raising the pensionable retirement

age. Countries such as Germany, France and U.S. have increased the retirement age. Some countries such as Australia and U.K. used to allow women to retire earlier than men but have changed the rules to bring them at par. Many countries such as Germany, U.K. and U.S. have signalled that they will keep increasing the retirement age according to a pre-set timeline (Table 7). In the U.K., for example, the state pension age will increase for both men and women to 66 by October 2020. The U.K. government is planning further increases in the retirement age to 67 spanning the years 2026-28 and to 68 during 2044-46.
7.30 Given that life expectancy for both males and females in India is likely to continue rising, increasing the retirement age for both men and women going forward could be considered in line with the experience of other countries (Figure 14). This will be key to the viability of pension systems and would also help increase female labour force participation in the older age-groups. Since an increase in the retirement age is perhaps inevitable, it may be worthwhile signalling this change well in advance – perhaps a
Table 7: Retirement Age Reforms Being Implemented or Under Consideration in Major Economies Country Retirement Age Reforms
| Country | Retirement Age Reforms |
| Germany | Retirement age to increase gradually to 66 by 2023 and to 67 by 2029 |
| U.S. | Pension benefit age to rise gradually to reach 67 for those born in 1960 or later |
| U.K. | State pension age to increase for both men and women to 66 by October 2020, and further to 67 between 2026-28 and to 68 between 2044-46 |
| Australia | Pensionable age scheduled to increase gradually to 67 by 2023 |
| China | Under consideration to raise the retirement age for women by 1 year every three years and for men by 1 year every six years so that by 2045, the retirement age for both men and women would be 65 |
| Japan | Under consideration to raise the retirement age to 70 |
Source: Country-specific pension documents and government press releases
decade before the anticipated shift – so that the workforce can be prepared for it. This will also help plan in advance for pensions and other retirement provisions.
IV. CONCLUSION
7.31 This chapter is not merely an attempt to look at the changing population dynamics of the country but is meant as an illustration of how several of the common working assumptions of economists and policy-makers need to be revisited from time to
time. This is even true for a commonly discussed topic such as the demographic dividend. It is important, therefore, that working assumptions and projections are constantly revised in light of new evidence (especially in the age of big data) for areas such as urbanization, energy requirements, forest cover, water availability, climate change and other long-term factors that have a large impact on the socio-economic context in which government policy interventions play out.
Note:-
1 In the figures, abbreviations used for states are as follows. AP: Andhra Pradesh, AS: Assam, BR: Bihar, CG: Chhattisgarh,
DL: Delhi, GJ: Gujarat, HP: Himachal Pradesh, HR: Haryana, JH: Jharkhand, JK: Jammu & Kashmir, KA: Karnataka, KL: Kerala, MH: Maharashtra, MP: Madhya Pradesh, OR: Odisha, PB: Punjab, RJ: Rajasthan, TL: Telangana, TN: Tamil Nadu, UK: Uttarakhand, UP: Uttar Pradesh, WB: West Bengal.
2 Total fertility rate refers to the total number of children born or likely to be born to a woman of child-bearing age in her lifetime.
3 TFR of 2.1 children per woman is called the replacement level fertility, which is the average number of children a woman would need to have in order for the population to replace itself
4 Since Life Tables for Delhi and Himachal Pradesh are not available for longer periods, appropriate increment in life expectancy at birth for male and female are applied to the UN (2017) forecasts to project life expectancy at birth up to 2041.
5 Since Kerala already has high life expectancy at birth, the maximum life expectancy at birth is assumed to be equal to the current life expectancy at birth of Japan.
6 The average value of sex ratio at birth is around 1.05, i.e. 105 boys born per every 100 girls.
CHAPTER AT A GLANCE
> India is set to witness a sharp slowdown in population growth in the next two decades. Although the country as a whole will enjoy the “demographic dividend” phase, some states will start transitioning to an ageing society by the 2030s.
> A surprizing fact is that population in the 0-19 age bracket has already peaked due to sharp declines in total fertility rates (TFR) across the country. The national TFR is expected to be below replacement rate by 2021.
> Working-age population will grow by roughly 9.7mn per year during 2021-31 and 4.2mn per year in 2031-41.
> The proportion of elementary school-going children, i.e. 5-14 age group, will witness significant declines. Contrary to popular perception, many states need to pay greater attention to consolidating/merging schools to make them viable rather than building new ones.
> At the other end of the age scale, policy makers need to prepare for ageing. This will need investments in health care as well as a plan for increasing the retirement age in a phased manner.
REFERENCES
Brass William, Ansley J. Coale, Paul Demeny, Don F. Heisel, Frank Lorimer, Anatole Romaniuk and Etienne Van De Walle, “The Demography of Tropical Africa”, Princeton University Press (1968).
“Population Projections for India and States 2001-2026”, Report of the Technical Groupon Population Projections constituted by the National Commission on Population. Office of the Registrar General & Census Commissioner of India (2006).
“Revision of World Population Prospects”, UN Population Division (2017).
Gompertz, B, “On the Nature of the Function Expressive of the Law of Human Mortality, and on a New Mode of Determining the Value of Life Contingencies”, Philosophical Transactions of the Royal Society of London (1825).
Cannan E. “The probability of a cessation of the growth of population in England and Wales during the next century”, The Economic Journal (1895).
George MV, Stanley K. Smith, David A. Swanson and Jeff Tayman “Population Projections”, Chapter 21 in Jacob Siegel and David Swanson (eds.), The Methods and Materials of Demography. San Diego: Elsevier Academic Press (2004).
“Projections of the Population by States: 1955 and 1960.” Current Population Reports. Series P-25 No. 56, US Census Bureau, (1952).
Pittenger D, “Projecting State and Local Populations”, Cambridge: Ballinger (1976).
Source- Economic Survey 2018-19 Volume 1


