Sun is the soul of all animate and inanimate -Rig Veda
Energy is vital for development and prosperity of any economy. India, however, lags behind significantly in energy usage: despite accounting for 18 per cent of world’s population, India uses only around 6 per cent of the world’s primary energy. Energy poverty has been more pervasive in India than income poverty: 53 per cent of our population could not access clean cooking in 2017 when compared to 30 per cent for China, four per cent for Brazil and less than one per cent for Malaysia. With an increase of per capita energy consumption by 2.5 times, India will be able to increase its real per capita GDP by US$ 5000 (in 2010 prices). Additionally, if India has to reach the HDI level of 0.8, it has to increase its per capita energy consumption by four times. India’s emphasis on energy efficiency over the decades has helped significantly in serving the country’s energy needs. Energy efficiency programmes have generated cost savings worth more than `50,000 crores and a reduction of about 110 million tons of CO2 emission in 2017-18. While the share of renewables in total generation has increased from 6 per cent in 2014-15 to 10 per cent in 2018-19, India still needs investment in renewable energy of more than US$ 250 billion over the next decade. As electric vehicles represent the next generation in sustainable mobility, India must emphasize on them. Currently, the market share of electric cars is only 0.06 per cent when compared to 2 per cent in China and 39 per cent in Norway. Access to fast charging facilities must be fostered to increase the market share of electric vehicles.
INTRODUCTION
9.1 As witnessed over the past two centuries, energy has been the driving force behind the process of economic development: greater access to energy has fostered economic growth as well as other indicators of human development. India has a per-capita energy consumption of only about one-third of the global average. Within this consumption, access to clean fuel is unevenly distributed spatially in rural vis-à-vis urban areas and socio-economically when seen across income groups. India, therefore, needs to quadruple its per-capita energy consumption to meet the rising aspirations of its citizens. This will also enable India to achieve the human development status of an upper-middle-income country.
9.2 India’s energy needs have been complemented by efforts to use energy efficiently in the last three decades. The overall electricity savings due to adoption of these energy efficiency measures is estimated at 7.21 per cent of the net electricity consumption in 2017-18. Total thermal energy saved is 2.7 per cent of the net thermal energy consumption and 2.0 per cent of the net energy supply during the same period.
9.3 Further, India has also strived to increase the share of energy from sustainable sources. The share of renewables in total generation has increased from 6 per cent in 2014-15 to 10 per cent in 2018-19. Electric vehicles (EVs) represent the next generation in sustainable mobility and need to be encouraged. The adoption rate of electric vehicles has been slow, largely due to the lack of charging infrastructure in the country and the time taken for completely charging the EVs. A policy push is therefore required to devise universal charging standards for the country as a whole and to provide adequate charging infrastructure.
ENERGY FOR PROSPERITY
9.4 Energy is an integral component of the growth process for any economy. The present day developed countries pursued a path of energy-intensive industrial growth to reach the standards of living witnessed by them today. The upper-middle-income countries have also seen per capita energy consumption rise with their rise in per capita incomes. Though India accounts for around 18 per cent of world’s population, it uses only around 6 per cent of the world’s primary energy. India’s per capita energy consumption equals 0.6 tonnes of oil equivalent (toe) as compared to the global per capita average of 1.8 toe. India’s per capita primary energy consumption lags that of the upper-middle-income countries by a considerable margin (Figure 1).

shows that in the initial years of economic development, increase in per capita GDP requires a large increase in primary energy per capita. A comparison can be made between India and China, both of which started from low levels of per capita primary energy consumption as well as per capita GDP. However, we can see that China was able to quickly increase its energy consumption and grew rapidly (Figure 2). In the medium-term, for India to achieve per capita GDP comparable to that of the upper-middle-income countries, we require greater energy resources and that too at a rapidly increasing rate. Energy intensity of India’s GDP has been declining in the recent past, which is reflective of increases in the efficiency of energy use. However, India cannot become an upper-middle-income country without (i) rapidly raising its share of the global energy consumption commensurate with its share of the global population, and (ii) ensuring universal access to adequate modern commercial energy at affordable prices. It is also important to note that India’s energy intensity of GDP started declining at a much lower level of per capita GDP as compared to the developed world. India’s primary energy intensity of GDP started declining since 1991 at per capita GDP of around US$ 578 whereas US primary energy intensity of GDP started declining since 1970 at per capita GDP of around US$ 23,309 (at constant 2010 US$).
9.6 Figure 3 shows the relationship between per capita energy consumption and corresponding real per capita GDP for around 170 countries for the year 2017. A simple linear regression between the two variables indicates that one Gigajoule increase in energy consumption per capita corresponds to an increase of US$ 145 per capita in 2010 prices. Thus, India will have to increase its per capita consumption from the current 24 Gigajoules by 2.5 times to increase its real per capita GDP by US$ 5000 in 2010 prices, which will also enable it to enter the upper-middle income group. This will require huge energy resources that would also need to increase with time.


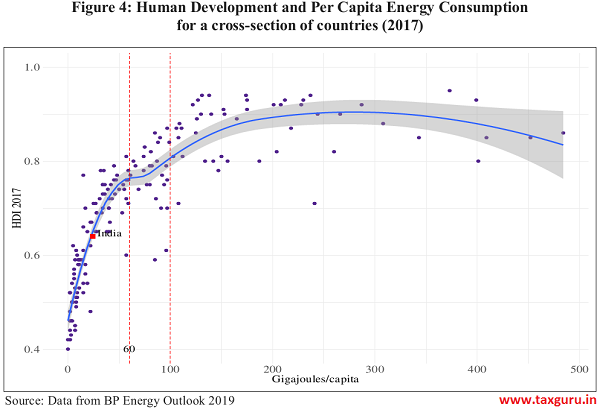
9.7 Access to energy is important not just in its own right but also due to its linkages with other social indicators. The Sustainable Development Goal (SDG) No.7 on Affordable and Clean Energy is closely related to all other SDGs. This is highlighted by the strong relationship between Human Development Index (HDI) and Per capita energy consumption (Figure 4). At low levels of energy consumption, increases in per capita energy consumption leads to considerable increases in human development. The curve fitted to the data indicates that for countries in the sub 100 Gigajoules per capita energy consumption region, small increases in energy consumption correspond to large increases in HDI. A country with 100 Gigajoules of per capita energy consumption has, on an average, HDI of around 0.8 which is considered to be very high human development (http://hdr. undp.org/en/composite/HDI). India had a per capita energy consumption of 24 Gigajoules and a HDI of 0.64 in 2017 i.e., medium human development. India would have to quadruple its per capita energy consumption to reach a HDI of 0.8 and enter the group of countries with high human development.
ACCESS TO ENERGY – ENERGY POVERTY
9.8 There is wide disparity between urban and rural areas in access to energy. A large proportion of the population especially in rural areas relies on non-commercial biomass such as firewood and dung cakes for their cooking/heating needs, thereby exacerbating health concerns due to poor indoor air quality. While the share of Liquefied Petroleum Gas (LPG) as a cooking fuel has increased over the years, the share of households reporting it to be as the primary source of energy for cooking has been low in the rural areas when compared with the urban areas (Figure 5). It is heartening to see a wide acceptance of LPG as the cooking fuel in urban areas.


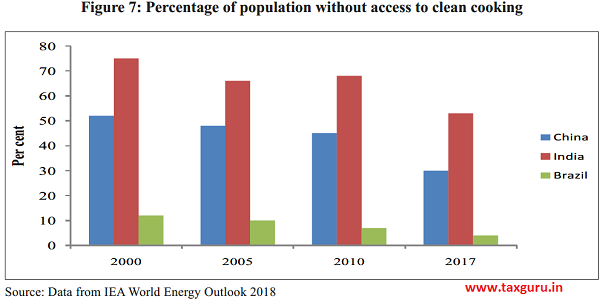
9.9 While there is a large gap in energy access between the rural and urban areas, there remains a wide variation in the energy access between the households at various economic strata. Using the data from latest available consumer expenditure round of National Sample Survey, i.e. 2011-12, we find that around 81 per cent of rural households and 59 per cent of urban households in lowest five percentile classes of expenditure reported firewood & chips as their primary source of energy for cooking (Figure 6). As we move up the expenditure classes, we find that the reliance on firewood and dung cakes keeps falling and the use of LPG gains importance. However, even at the top five percentile classes in the rural areas, around 34 per cent of households in 2011-12, which is the latest year for which this data is available, reported firewood and chips to be the primary source of energy for cooking while only around 50 per cent of these households reported LPG as their primary energy source for cooking. This indicated that the problem of energy poverty has been more pervasive than income poverty. The access to clean cooking fuel has increased considerably in the recent years, especially through the efforts of the Government of India such as the Ujjwala scheme (Figure 7). As per IEA-1(2018), in 2017, 53 per cent of the population in India did not have access to clean cooking when compared with 68 per cent in 2010. However, this remains low when compared with other upper-middle-income countries such as 30 per cent for China, 4 per cent for Brazil and less than 1 per cent for Malaysia.
9.10 Government has been taking conscious efforts to make clean cooking fuel available to households. Pradhan Mantri Ujjwala Yojna was launched in 2016, with the aim to safeguard the health of women and children by providing them with clean cooking fuel. Around 7 crore LPG connections have been provided till April 2019 under the Scheme. Direct Benefit Transfer for LPG consumer (DBTL) scheme namely, ʻPAHAL’, in 54 districts of the country on 15 November, 2014 has also been launched to rationalize subsidies based on approach to cut subsidy leakages. As on 5 March, 2019, 24.39 crore LPG consumers have joined the scheme. LPG consumers, who join the PAHAL scheme, will get the LPG cylinders at non-
subsidized price and receive LPG subsidy (as per their entitlement) directly into their bank accounts. PAHAL has been recognized by the “Guinness Book of World Record” as the World’s Largest Direct Benefit Scheme.
ENERGY EFFICIENCY
9.11 While India focuses in increasing its energy production and consumption, ensuring access to electricity for all and improving living standards, it also strives to ensure that it follows a growth path that delivers sustainable development and protect the environment. A large part of India’s energy story also comes from the various energy efficiency measures that the country has implemented over the years.
9.12 The primary energy intensity of India’s GDP has followed a falling trend over the years (Figure 8). India’s primary energy intensity of GDP has fallen from 0.0004 toe in 1990 to 0.0002 toe in 2017. India understood the importance of energy efficiency measures

reasonably early in its economic development path and has embraced a number of energy efficiency measures in the last three decades. The aim of this section is to provide the reader an analysis of the impact of energy efficiency measures in terms of energy saved, emissions avoided, cost savings realized.
9.13 The term energy efficiency broadly means using lesser amount of energy to produce a given amount of output. For example, a light-emitting diode (LED) light bulb requires less energy than an incandescent light bulb to produce the same amount of light i.e., it is more energy efficient.
9.14 The institutional and legal framework in the country for energy efficiency has been strengthened through the Energy Conservation Act in 2001, which created the Bureau of Energy Efficiency (BEE). The overall size of the energy efficiency market in India is estimated to be US$ 22.81 billion (Energy Efficiency Services Limited (EESL’s Business Plan, 2016-2021). Realizing the potential, Government of India with BEE in the lead undertook a number of schemes for promoting energy efficiency in various sectors across India (Figure 9 and Box 1).

|
Box 1: Energy Efficiency Programmes: A Brief |
|
Standards & Labelling Programme was launched in May, 2006 with an objective of providing the consumer an informed choice about the energy and cost saving potential of the labelled appliances/ equipment being sold commercially. This scheme entails laying down minimum energy performance norms for appliances/equipment, rating the energy performance on a scale of 1 to 5 with 5 being the most energy efficient one. The programme covers 23 appliances out of which 10 appliances are under the mandatory regime while the remaining 13 appliances are under the voluntary regime. Buildings: The Energy Conservation Building Code (ECBC), which sets minimum energy standards for new commercial buildings having a connected load of 100 KW or contract demand of 120 KVA or more, has been updated by BEE in 2017. BEE has also launched the Eco-Niwas Samhita (Part 1: Building Envelope) for residential buildings in December, 2018. Hotels have also been assigned mandatory targets for reducing their energy consumption. Small & Medium Scale Industries: BEE has implemented various energy efficiency demonstration projects in Textile, Bricks and Food Clusters. Post implementation energy audits have also been conducted in these clusters to measure the savings achieved by implementation of Energy Efficient Technologies. Transport: Corporate Average Fuel Efficiency (CAFE) norms for passenger cars have been notified in April, 2015 and the fuel efficiency norms for Heavy Duty Vehicles for Gross Vehicle Weight greater than 12 tonnes were notified in August, 2017. Further, the fuel efficiency norms for light and medium commercial vehicles are under finalization and are being developed for tractors. BEE is also working towards faster adoption of electric vehicles and labelling program for vehicles. Demand Side Management (DSM) Programmes: BEE had launched its demand side management schemes covering the areas on Agriculture, Municipal, and Distribution Companies (DISCOMs). Under the Agriculture DSM (AgDSM), MoU has been signed between Indian Council of Agricultural Research (ICAR) and BEE to create awareness for energy efficient pump sets and its operational practices. In order to tap the energy savings potential of municipalities, BEE undertook nation-wide awareness programmes to address energy efficiency in water pumping, sewage pumping, street lighting and public buildings across Urban Local Bodies (ULBs) in the country. BEE is carrying out preparation of DSM Action Plan, load research study of DISCOMs and capacity building of DISCOM officials across the country. Industries: Perform Achieve and Trade (PAT) scheme has been launched for industries, in which mandatory targets are assigned to energy intensive industries for reducing the energy consumption. This is followed by conversion of excess energy savings into tradable instruments called Energy Saving Certificates (ESCerts). PAT cycle-I was completed in 2015 with a saving of 8.67 Million Tonne of Oil Equivalent (MTOE) and mitigation of about 30 million tonne of CO2 emission. Platform for trading of ESCerts was launched in September, 2017. In total, about 12.98 lakh ESCerts were traded at a cost of about `100 crore. PAT Cycle II commenced from April, 2016 in which 621 Designated Consumers (DC) were notified. PAT scheme is being implemented on a rolling cycle basis i.e. inclusion of new sectors/DCs every year. PAT cycle-III was notified with effect from April, 2017 and PAT cycle — IV was notified with effect from 1 April 2018 and PAT cycle -V has commenced from April 2019. Presently under PAT scheme, there are over 800 units participating and by 2020 it is expected that they will be able to achieve energy savings of about 20 MTOE and mitigation of about 70 million tonnes of CO2 emission. Lighting: With a view to tap the immense potential of LED lamps in reducing the energy requirement the Unnati Jyoti by Affordable LEDs for All (UJALA) programme was launched on 5th January, 2015 with a target to replace 770 million incandescent bulbs with LED bulbs. It was estimated that this would lead to annual energy savings of 100 billion kWh by March, 2019. Energy Efficiency Services Limited (EESL) has been designated as the implementing agency for this programme. LED bulbs under UJALA are distributed at subsidized rates through special counters set up at designated places in different cities across the country. For domestic lights, EESL service model enables domestic households to procure LED lights at an affordable price, with the option of paying the cost of procurement through easy instalments from their electricity bill. Outreach: The partnership and involvement of consumers is equally important, through behavioural change, in sustaining efficient use of energy and avoidance of wastage. A campaign has been initiated to educate people for conserving energy in air-conditioning application by maintaining optimum temperature settings. BEE has already issued guidelines to large commercial establishment recommending temperature setting between 24° C-26° C without compromising comfort levels. These simple actions have the potential to save energy up to 20 per cent apart from rendering associated health and environment benefits. |
Impact of Energy Efficiency Programmes
9.15 The implementation of various energy efficiency programmes has witnessed exceptional performance in terms of reducing energy consumption thereby leading to lower greenhouse gas (GHG) emissions and cost savings. According to a BEE study, overall, this saving has resulted in total cost savings worth Rs. 53,000 crore (approximately) in 201718 and contributed in reducing 108.28 Million Tonnes of CO2 emission. The contribution is largely from three major programmes – PAT, UJALA and Standard & Labelling (Figures 10 and 11). The overall electricity savings due to energy efficiency measures is 7.21 per cent of the net electricity consumption in 2017-18, total thermal energy saved is 2.7 per cent of the net thermal energy consumption and 2.0 per cent of the net energy supply.


Energy Saving Potential of Various Sectors
9.16 Going forward, the sectors with possible energy savings need to be identified and estimated for effective policy and programme interventions to realize the potential savings. The energy saving potential in various demand sectors has been estimated by BEE using three scenarios (Table 1).
Table 1: Three Scenarios for estimating energy saving potential
| Assumptions by 2031 | Technological Improvement & penetration | Policy/program/ scheme initiatives | Change in Fuel mix |
| Scenario 1: Least effort | No technological change and no new technology penetration | No further implementation of Programs | Current fuel mix |
| Scenario 2: Moderate effort | Moderate/Business as Usual (BAU) technological improvements and technology penetration as per govt./other agencies target | Successful achievement of program targets | Moderate/BAU fuel mix shift from fossil fuel to Renewable Energy(RE)/electricity based consumption |
| Scenario 3: Aggressive effort | Aggressive technological improvements and penetration over govt./ other agencies target | Over achievement of program targets | Aggressive fuel mix shift towards RE based consumption in sector (if applicable) |
9.17 In light of the above scenarios, the table below shows India’s energy saving potential in various demand sectors in 2031. Industrial sector stands out with maximum energy saving potential (Table 2).
Table 2: India’s energy saving potential in various demand sectors in 2031.
| Sector | Energy Consumption – 2031 (Least Effort) |
Moderate Savings- 2031 | Aspirational Savings – 2031 | ||
| Mtoe | Mtoe | per cent | Mtoe | per cent | |
| Agriculture | 64.4 | 5.7 | 9 | 9.9 | 15 |
| Transport | 232.9 | 15.8 | 7 | 23.8 | 10 |
| Domestic | 98.6 | 12.1 | 12 | 15.1 | 15 |
| Commercial | 29.5 | 4.9 | 17 | 6.4 | 22 |
| Municipal | 8.0 | 0.9 | 12 | 1.5 | 19 |
| Industries | 443.4 | 47.5 | 11 | 72.3 | 16 |
| Total (mtoe) | 876.8 | 86.9 | 10 | 129.0 | 15 |
| Total (TWh) | 10198 | 1010 | 10 | 1500 | 15 |
Source: Bureau of Energy Efficiency
Note: TWh=Terawatt-hour
It is vividly clear that there is still great potential to be realized in terms of energy efficiency in various demand sectors. As a country committed to implement the Paris Agreement on Climate Change and SDGs, it is necessary to prepare and plan strategies to unlock the potential to achieve the energy efficiency potential, which should include favourable regulatory structures, strengthened institutional framework, innovative financial structures for affordable financing, use of technology, and increased stakeholder engagement. The existing approaches must be reviewed and a new portfolio of strategies planned to strengthen energy efficiency across all sectors in the country.
SUSTAINABILITY OF ENERGY GENERATION
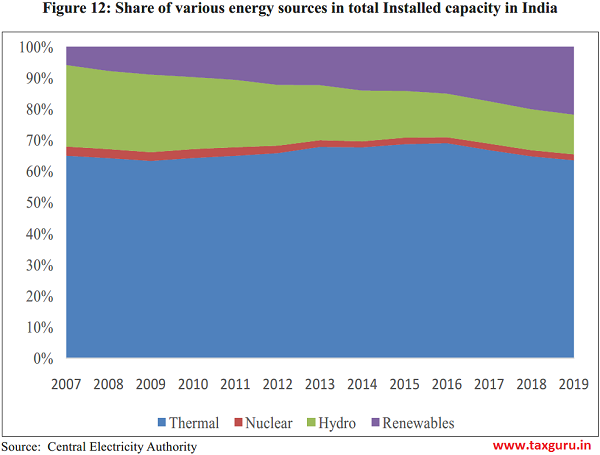
9.18 Globally, focus has been gradually shifting to non-fossil fuel sources for electricity generation. Despite this, coal remains the largest source of electricity generation mix globally, with 38 per cent market share in 2018 (IEA, 2019). In terms of generation capacity, at the end of 2018, global renewable generation capacity amounted to 2351 GW that constituted around a third of total installed electricity capacity (IRENA, 2019). A look at India’s installed capacity for the last decade can tell us the importance that thermal energy has played in meeting India’s electricity needs (Figure 12).
9.19 Almost 60 per cent of India’s installed capacity is in thermal power out of which the main component is the coal based thermal power plants. India’s Nationally Determined Contribution (NDC) under the Paris Agreement states that India will
achieve 40 per cent installed capacity of power from non-fossil fuels by 2030. While there has been tremendous increase in the renewable energy capacity, fossil fuels, especially coal, would continue to remain an important source of energy. Further, it may not be advisable to effect a sudden abandonment of coal based power plants without complete utilisation of their useful lifetimes as it would lead to stranding of assets that can have further adverse impact on the banking sector. Further, considering the intermittency of renewable power supply, unless sufficient technological breakthrough in energy storage happens in the near future, it is unlikely that thermal power can be easily replaced as the main source of energy for a growing economy such as India. As such, base load power would have to be continued to be provided by the thermal power plants. Given the sustainable energy objectives of the country and the importance that coal based power plants entail, there is a need for building capacity for cleaner and more efficient coal technologies. Also important is the economy’s ability to generate greater output from available energy resources and its resource endowments.
9.20 A comprehensive energy policy should take into consideration the economies of both coal and renewables as they are interdependent. They are substitutes for each other as a source of energy but are complementary in keeping the flow to the grid stable as coal generation represents a stable source of power while renewable energy may be variable.
POTENTIAL OF RENEWABLE ENERGY
9.21 While increasing access to energy is important, it is also imperative that this comes at much lower costs to the environment than it has happened historically in advanced economies. As observed above, there has been arguably a transformation in the energy mix in India. Renewable energy sources are a strategic national resource. Harnessing these resources is a part of India’s vision to achieve social equity and energy transition with energy security, a stronger economy, and climate change mitigation. Union Budget 2018-19 announced zero import duty on components used in making solar panels to give a boost to domestic solar panel manufacturers. Government has also offered various financial incentives for off-grid and decentralized renewable energy systems and devices for meeting energy needs for cooking, lighting and productive purposes. Thus, progressively declining costs, improved efficiency and reliability have made renewable energy an attractive option for meeting the energy needs in a sustainable manner and helping India pursue its low carbon development pathway.
9.22 In this regard, India has been undertaking one of the world’s largest renewable energy expansion programmes in the world. The share of renewable energy is progressively increasing in the Indian electricity mix. The share of renewables (excluding hydro above 25 MW) in total generation was around 10 per cent in the year 2018-19 compared to around 6 per cent in 2014-15. Now globally India stands 4th in wind power, 5th in solar power and 5th in renewable power installed capacity. The cumulative renewable power installed capacity (excluding hydro above 25 MW) has more than doubled from 35 GW on 31 March 2014 to 78 GW on 31 March 2019. In addition, around 27 GW renewable power capacity is under installation and over 38 GW under bidding. The target is to achieve an installed capacity of renewable based power of 175 GW by the year 2022.
9.23 Government has been taking a slew of measures for the renewable energy sector. Traditionally, renewable energy has been supported through various fiscal and financial incentives. As the viability of renewable energy has improved drastically in the recent times, tariff discovery is made through reverse auctioning process. The solar tariff has come down from around Rs. 18/kWh in 2010 to Rs. 2.44/ kWh in bids conducted in 2018. Similarly for wind power, the tariff has declined from an average of Rs. 4.2/kWh in 2013-14 to Rs. 2.43/ kWh in December 2017. Therefore, the wind power cumulative capacity has exceeded 35.6 GW.
9.24 Recent years have seen rapid growth in installed solar generating capacity along with significant improvements in technology, price, and performance. Moreover, creative business models have spurred investment in this sector. The initial target of the National Solar Mission upto the year 2022, was to install 20 GW solar power, which was further enhanced to 100 GW in early 2015. The solar power installed capacity has increased around 1000 times from 25 MW as on 31 March, 2011 to 28.18 GW as on 31 March, 2019.
9.25 Priority has been accorded to seamless integration of renewables into the grid and better grid stability. In order to facilitate smooth integration of increasing share of renewables into the national grid, Green Energy Corridor project continues to be in operation. Eleven Renewable Energy Management Centres are already at different stages of installation.
9.26 Kisan Urja Suraksha Evam Utthaan Mahabhiyan (KUSUM) scheme has been launched for providing financial and water security to farmers and for de-dieselization of the farm sector. The scheme envisages around 2.75 million solar pumps and, on a pilot basis, 1 GW decentralized solar power plants in uncultivable lands of farmers to enhance income of farmers.
9.27 Broad estimates suggest that additional investment in renewable plants for upto the year 2022 (without transmission lines) would be about US$ 80 billion at today’s prices and an investment of around US$ 250 billion would be required for the period 2023-2030. Thus, on an annualized basis, investment opportunity for over US$ 30 billion per year is expected to come up for the next decade and beyond.
9.28 India has great potential for hydro power generation. However, the utilisation of hydro power for meeting the power generation needs have been limited. India has a hydro potential of around 145320 MW, out of which 45400 MW have been utilised. As we move towards greater energy requirements in future, this source of energy, which is climate friendly compared to traditional sources of power, can play a major role. However, high tariffs have been a major obstacle. To encourage the hydro sector, a new Hydro Policy has been approved which includes recognising large hydropower projects as a renewable energy source. Further, tariff rationalization measures have been undertaken, including providing flexibility to the developers to determine tariff by back loading of tariff after increasing project life to 40 years, increasing debt repayment period to 18 years and introducing escalating tariff of 2 per cent, budgetary support for funding flood moderation component of hydropower projects on a case-to-case basis, and budgetary support for funding cost of enabling infrastructure i.e. roads and bridges on a case-to-case basis.
9.29 While access to greater and cleaner energy resources and increasing the efficiency of energy resources are important, another area that has tremendous potential is electric mobility.
ELECTRIC VEHICLES (EVs) IN INDIA
9.30 With the world’s second largest population and an area of 3.3 million square kilometers, it is not difficult to understand how important the transport sector is for the Indian economy. In India, transport sector is the second largest contributor to CO2 emissions after the industrial sector. Road transport accounts for around 90 per cent of the total emissions in the transport sector in India (MOEF&CC, 2018). Increasing vehicle ownership, as is evident from Figure 13, has also meant that the demand for the fossil fuels for these vehicles has also increased. Given the large import dependence of the country for petroleum products, it is imperative that there be a shift of focus to alternative fuels to support our mobility in a sustainable manner.
9.31 While the government has given an impetus to the promotion of quality public transport, especially through the introduction of metro projects in various major cities, a shift to electric mobility in road transport can lead to beneficial results. India could also emerge as a hub for manufacturing of such vehicles. With this view, a “National Electric Mobility Mission Plan 2020 (NEMMP)” was conceived with an objective to achieve sales of 60-70 lakh units of total EVs by 2020. In 2015, the Faster Adoption and Manufacturing of Electric vehicles (FAME) scheme was launched to fast-track the goals of NEMMP with an outlay of Rs. 795 crore. The initial outlay was for a period of 2 years, commencing from 1 April 2015, which was extended up to 31 March, 2019. FAME India Phase II has been launched, with effect from 1 April 2019, with a total outlay of Rs. 10,000 Crore over the period of three years. Emphasis in this phase is on electrification of public transportation.
9.32 In addition to the initiatives of the Government of India, several states, including Karnataka, Kerala, Telangana, Maharashtra and Andhra Pradesh, Uttar Pradesh, Uttarakhand, have drafted EV policies to complement the national policy

and address state-specific needs. Andhra Pradesh has set a target of 10 lakh EVs by 2024 while Kerala has set a target of 10 lakh EVs by 2022. Maharashtra has announced its draft EV Policy, 2018 to increase the number of registered EVs in the state to 5 lakh. Telangana has targeted 100 per cent electric buses for intracity, intercity and interstate transport for its state transport corporation. Uttarakhand’s EV policy has focused on the manufacturing of EVs in the state with incentives for manufacturers of EVs in the MSME sector (NITI Aayog, 2019).
9.33 Globally, the sales of electric cars have been rising at a fast pace from just over 2000 units being sold in 2008 to over 10 lakh in 2017. More than half of the sales were in China (IEA-2, 2018). The market share of electric cars is around 2 per cent in China while it is around 39 per cent in Norway. Electrification of two-wheelers and buses has also picked up pace in the recent years. In 2017, global sales of electric buses were about 1 lakh and sales of two-wheelers are estimated at 3 crore. China accounted for a major part of these sales. Charging infrastructure has also kept pace with almost 30 lakh chargers at homes and workplaces and about 430,151 publicly accessible chargers worldwide in 2017. However, only around 25 per cent of these were fast chargers (IEA-2, 2018).
9.34 In India, electric two wheelers have been the major part of EV sales with sales of around 54,800 in 2018 (NITI Aayog, 2019). Compared to this, sales of electric cars have been only around 2000 in 2017 (IEA-2, 2018). Indian market share of electric cars is a meagre 0.06 per cent. According to the Society of Manufacturers of Electric Vehicles (SMEV), Uttar Pradesh topped the list of the states with highest EV sales of around 6878 units in 2017-18, followed by Haryana at 6,307 units and Gujarat at 6,010 electric vehicles. Maharashtra reported sales of around 4,865 EV units, while West Bengal came in fifth with sales of 4,706 units. Figure 14 showcases the sales of electric cars which includes Battery Electric Vehicles (BEVs) and Plug-in Hybrid Electric Vehicles (PHEVs) in India.
9.35 Various incentives have been provided to the buyers and users of electric vehicles in different countries to encourage their uptake. Norway, which has the highest share of electric cars has provided generous incentives to EV buyers and disincentives to the use of conventional vehicles. These include exemption from VAT, tax incentives on import and purchase of EVs, waiver of toll and ferry fees, free parking, etc. Closer home, Chinese government has issued a new energy vehicle (NEV) credit mandate that sets a minimum requirement regarding the production of new energy vehicles (PHEVs, BEVs and FCEVs), with some flexibility offered through a credit trading mechanism in the car industry. Every manufacturer is required to earn minimum NEV credits either through producing or importing NEVs or through the purchase of NEV credits from other manufacturers who have excess credits. Additionally, the subsidy program- with a consistent focus on the investment intensity of the charging and battery infrastructure – seems to have driven the increasing Chinese market share in EVs.
9.36 Given the various incentives given in the different countries, it is only natural to ask whether these incentives have had any impact on the uptake of electric vehicles. While a number of studies seem to indicate that incentives have been effective, some studies have indicated their ineffectiveness and have shown that charging infrastructure is a more important determinant of EV uptake (Hardman et al., 2017). Figure 15 presents the density of publicly accessible chargers and the corresponding market shares of electric

cars for some countries for which the data was available. Fitting a line through the scatter, we find that the market share of EVs is positively related to the availability of chargers and a larger availability of chargers corresponds to a greater adoption of EVs. The market share of EVs increases with increasing availability of charging infrastructure. This is primarily due to the limited driving range of batteries in the EVs. It, therefore, becomes important that adequate charging stations are made available throughout the road networks. In India, the limited availability of charging infrastructure seems to be a major impediment to increased adoption of EVs.
9.37 Another major impediment is that of time taken for completely charging EVs, compared to conventional vehicles. Even fast chargers can take around half an hour to charge an electric car while slow chargers could take even 8 hours. It is, therefore, an important policy issue to come up with universal charging standards for the country as a whole to enable increased investment in creation of such infrastructure. It is equally important to provide information on public chargers to the users of EVs through online maps and other means such as physical signage. This will encourage increased ease of adoption of EVs. Also, since the battery is the heart of any EV, development of appropriate battery technologies that can function efficiently in the high temperature conditions in India need to be given utmost importance (NITI Aayog, 2018).
9.38 The country’s economy is growing and would continue to grow at a rapid pace in the coming years. This presents a great opportunity for the automobile industry as the demand for automobiles would only increase. Given the commitments that India has made on the climate front as a nation and the increasing awareness of the consumers on environmental aspects, it is likely that larger and larger share of automobile sector would be in the form of electric vehicles. According to NITI Aayog (2019), if India reaches an EV sales penetration of 30 per cent for private cars, 70 per cent for commercial cars, 40 per cent for buses, and 80 per cent for 2 and 3 wheelers by 2030, a saving of 846 million tons of net CO2 emissions and oil savings of 474 MTOE can be achieved. It also provides us an opportunity to grow as a manufacturing hub for EVs, provided policies are supportive. While various incentives have been provided by the government and new policies are being implemented, it is important that these policies not only focus on reducing the upfront costs of owning an EV but also reduce the overall lifetime costs of ownership.
WAY FORWARD
9.39 Energy is the mainstay of the development process of any economy. The priority for the government is ensuring access to sustainable and clean energy sources. Given the close link between energy consumption and various social indicators, this attains even greater importance. Compared to the income dimension of poverty, its energy dimension is even more severe. Government of India initiated a big step in the form of the Pradhan Mantri Ujjwala Yojana, providing access to around 7 crore households under the scheme. The task now is to ensure that households with LPG continue to use the clean fuel for cooking purposes through continued refilling. In terms of household electrification, India has achieved almost 100 per cent with electrification of 21.44 crore households. Not only does India have to meet the energy needs of the future, it has to do so in a more sustainable manner. While renewable energy capacity has been expanded manifold, fossil fuel based energy is likely to continue to be an important source of power.
9.40 Overall, energy efficiency is a strategy that can lead to a win-win situation through better utilisation of energy resources. Future policy direction should orient itself to enhanced energy efficiency programmes in different sectors of the economy as well as technological solutions to better utilise the natural resource endowments of the country for greater prosperity. EVs hold enormous potential for India not only because it is environment friendly but also because India can emerge as a hub of manufacturing of EVs generating employment and growth opportunities. It may not be unrealistic to visualise one of the Indian cities emerging as the Detroit of EVs in the future. Appropriate policy measures are needed to lower the overall lifetime ownership costs of EVs and make them an attractive alternative to conventional vehicles for all consumers.
9.41 To conclude, India’s economic future and prosperity is dependent on her ability to provide affordable, reliable and sustainable energy to all her citizens.
CHAPTER AT A GLANCE
> India with a per-capita energy consumption of about one-third of the global average will have to increase its per capita energy consumption at least 2.5 times to increase its real per capita GDP by $5000 per capita, in 2010 prices, to enter the upper-middle income group.
> Additionally, if India has to reach the HDI level of 0.8, which corresponds to high human development, it has to quadruple its per capita energy consumption.
> India has set ambitious targets for renewable energy and has been undertaking one of the world’s largest renewable energy expansion programmes in the world. Now, globally India stands 4th in wind power, 5th in solar power and 5th in renewable power installed capacity.
> Energy efficiency programmes in India have generated cost savings worth more than Rs. 50,000 crore and a reduction in about 11 crore tonnes of CO2 emission.
> The share of renewables in total electricity generation has increased from 6 per cent in 2014-15 to 10 per cent in 2018-19 but thermal power still plays a dominant role at 60 per cent share.
> The market share of electric vehicles is only 0.06 per cent in India when compared to 2 per cent in China and 39 per cent in Norway. Access to fast charging facilities must be fostered to increase the market share of electric vehicles.
REFERENCES
Ghaniet. al (2014). Ejaz Ghani, Arti Grover Goswami and William R. Kerr: “Spatial Dynamics of Electricity Usage in India, Policy Research Working Paper 7055“, World Bank Group
Hardman et. al. (2017). “The effectiveness of financial purchase incentives for battery electric vehicles – A review of the evidence, Renewable and Sustainable Energy” Reviews Vol 80, pages 1100-1111.
IEA-1. (2018). “World Energy Outlook 2018“. Retrieved from International Energy Agency: https://www.iea.org/weo2018/
Energy Efficiency Services Limited. 2018, “Energy Efficiency Market In India PRGFEE & Successful ESCO Model“: https://www. aeee.in/wp-content/uploads/2018/04/EESL_ Ashish-Jindal.pdf
IEA-2. (2018). “Global EV Outlook“. Retrieved from International Energy Agency: https://webstore.iea.org/global-ev-outlook-2018
IEA (2019). “Global Energy and CO2 Status
Report“: www.iea.org/geco/electricity/zIRENA (2019). “IRENA Annual Renewable Capacity Statistics 2019“
MoEF&CC. (2018). “Second Biennial Update Report to the United Nations Framework Convention on Climate Change“. Ministry of Environment, Forest and Climate Change, Government of India.
NITI Aayog. (2018). NITI Aayog & World Energy Council. “Zero Emission Vehicles (ZEVs): Towards a Policy Framework, 2018“
NITI Aayog. (2019). “NITI Aayog & Rocky Mountain Institute. India’s electric mobility transformation, 2019“
Source- Economic Survey 2018-19 Volume 1


