INTRODUCTION
Various biases that are emphasised in the developing science of behavioural finance have a significant impact on individual investor behaviour. As a result, the purpose of this study is to determine the impact of behavioural biases on a single parent’s financial decisions. Behavioural finance is a newer field that aims to blend behavioural and psychological theory with classic economic and financial theory to explain why people make irrational financial decisions. It is a well-known stock market word for investment options used all over the world. The study of the impact of psychology and sociology on monetary practitioners’ behaviour is known as behavioural finance. It’s crucial to investigate why people buy and sell stocks without conducting fundamental research or acting impulsively while making financial decisions.
In the current scenario, the investment behaviour of diverse people, whether they are single parents or have a family, is a very important to be discussed to have an almost smooth living.
Even though they encounter numerous problems as a single parent, getting their finances in order might help to alleviate the situation. Because the present investment is complete, having a handle on their funds can make the path a little simpler later. Single parents’ savings are invested in assets based on their risk and return requirements, safety, liquidity, investment avenues available, various financial institutions, and so on. It’s crucial to look at how people save money and invest for the long run so that they can establish and prioritise their financial goals.
RESEARCH METHODOLOGY
The majority of qualitative data was used to classify analytical approaches.
Qualitative research method: Questions about why and how people behave, as well as the reasons for it, are addressed. It contains detailed information on human behaviour. This study method is frequently utilised to gain a better understanding of their feelings and experiences.
In general, qualitative data is broad and can be gathered through literature reviews, interviews, questionnaires, or observations. The study is being done in order to better understand single-parent earners’ savings and investing patterns, as well as the impact of behavioural finance on their decisions.
SCOPE OF THE RESEARCH
Emphasis has been given on the investment pattern on various people belonging to different income strata, including different genders, family pattern, age groups.
OBJECTIVES OF THE STUDY
Following are the objectives:
(a) To understand the type of investment of different groups of people
(b) To understand whether “age” acts as a big factor in investment
(c) To understand the percentage of savings done and how much they tend to invest
(d) To understand whether they get any tax benefit out of investing
(e) Whether they encourage investing, and in which spheres.
DATA COLLECTION
The primary data was gathered via a Google Form that was disseminated to the participants. Questions with multiple choices, are included in the questionnaire.
The required material for the report was gathered from a variety of secondary sources of data, including articles from journals, newspapers, and other publications, as well as research papers.
SAMPLING DESIGN
This method of sampling is appropriate since it allows us to select respondents based on the objective of the sample when we need a specific sort of sample/respondents. Judgment, selective, or subjective sampling are all terms used to describe this technique.
Individuals from various income categories, ages, genders, and with other family requirements, for example, are the target population.
SAMPLING FRAME
(a) Questionnaire method: Google Forms were sent.
(b) Sample size: The Google Form was sent to 35 different people.
(c) Sample area: All over India
LIMITATIONS OF THE STUDY
(a) The responses are influenced by the respondents’ biases and preconceptions.
(b) The results of this study will be based only on the data provided by the sample respondents. As a result, universal investment behaviour may not be viable to generalise.
ANALYSIS AND INTREPRETATION
Table 1: Gender
Interpretation: Gender plays a very important role while investing. From the below table and pie chart, it can be well determined that, out of 35 people, 18 respondents were males and the rest 17 were females, which means that 49% were females and 51% were females.
| Male | Female |
| 18 | 17 |
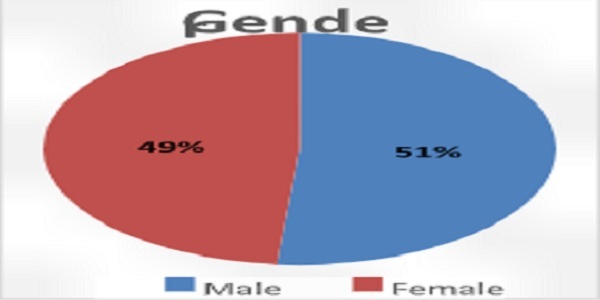
Table 2: Age
Interpretation: The age of the responder is necessary since it may have an impact on the respondent’s spending habits. The majority of the responders are between the ages of 36 and 55. The remaining sample is nearly evenly split between the three age groups of 20-30, 31-40, and Over 50. There are 35 people in the sample.
| 25-35 | 36-45 | 46-55 | 56-65 | Above 65 |
| 5 | 10 | 10 | 3 | 7 |

Table 3: Profession
Interpretation: Profession is another important criterion, as it determines the source of the primary income. From the below table and pie chart, it can be well analysed that most of the respondents were self-employed, and only 2 respondents were housewives.
| Government Employee | Private Employee |
Self Employed | Housewife | Public Ltd. Co. Employee |
| 7 | 9 | 11 | 2 | 6 |
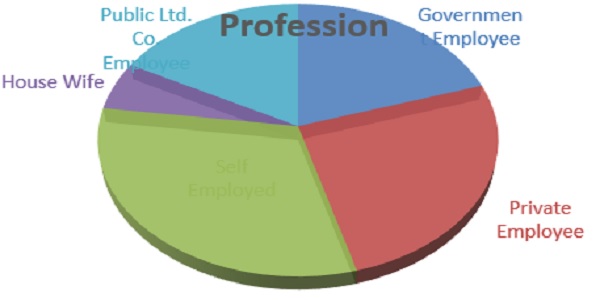
Table 4: Income
Interpretation: From the below table and pie chart it can be well analysed that most of the respondents belonged to the income strata of Rs. 65,001 and above per month, and only 5 respondents belonged to the income strata of less than Rs. 25,000 per month.
| Less than Rs. 25,000 | Rs. 25,001-45,000 | Rs. 45,001-65,000 | Rs. 65,001-85000 | Above Rs. 85,000 |
| 5 | 6 | 6 | 9 | 9 |
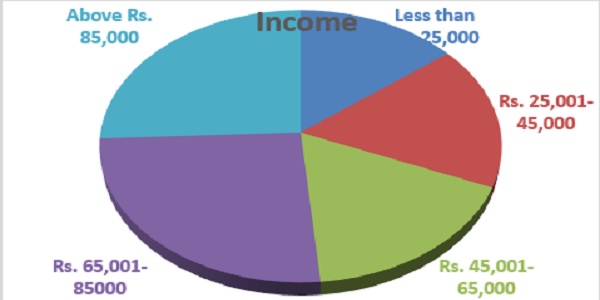
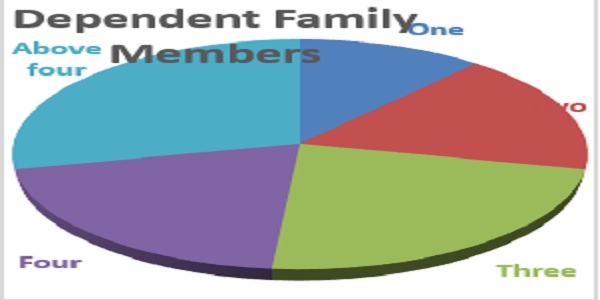
Table 5: Dependent Family Members
Interpretation: In order to make investments, it is very important to understand how many family members are dependent on that person, as the person has to make his investment decisions in that particular manner, as straight jacket formula can lead to a huge loss. The below table and pie chart well depicts that our of 35 respondents, 10 respondents had members who had to cater to the needs for more than 4 members, and 4 respondents had to take care of only one person.
| One | Two | Three | Four | Above four |
| 4 | 6 | 8 | 7 | 10 |
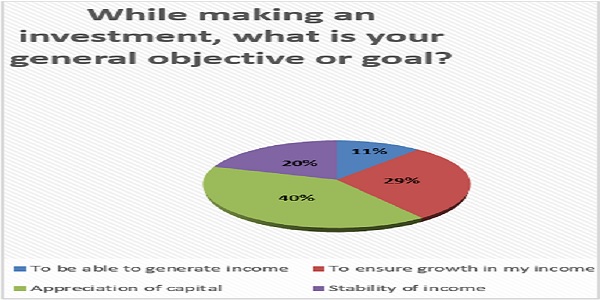
Q1. While making an investment, what is your general objective or goal?
Interpretation: From the above question, it was found out that most of the people (40%) prefer investing in order to appreciate the capital that has been invested.
| To be able to generate income | To ensure growth in my income | Appreciation of capital |
Stability of income |
| 4 | 10 | 14 | 7 |
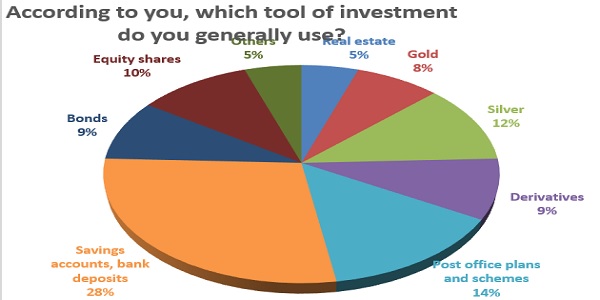
Q2. According to you, which tool of investment do you generally use?
Interpretation: The above question had a mixed option. Here, the people were allowed to choose multiple options. Therefore, it was found out that the investors mostly prefer investing in savings accounts and bank deposits. This could be because the principle amount is quite safe and the return is sure, as compared to equity shares, gold, silver, etc.
| Real estate | Gold | Silver | Derivatives | Post office plans and schemes | Savings accounts, bank deposits | Bonds | Equity shares | Others (Not specified) |
| 4 | 6 | 9 | 7 | 11 | 22 | 7 | 8 | 4 |
Q3. What kind of time horizon do you generally choose for your investments?
Interpretation: From the above question, it was found out that most of the people (31%) usually prefer investing for a period of 1 to 5 years. This is mainly because from the above question, it was found out that people usually prefer investing in savings accounts and bank deposits and Post office plans and schemes, which usually has a longer maturity period.
| 1 day | 1 week | 1 month | 1 year | 1 to 5 years | More than 5 years |
| Nil | 4 | 8 | 9 | 11 | 3 |

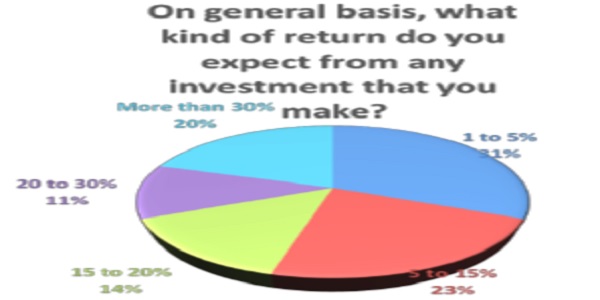
Q4. On general basis, what kind of return do you expect from any investment that you make?
Interpretation: From the above question, it can be understood that the investors mainly prefer a return of about 1 to 5%. This is mainly because from the above question, it was found out that people usually prefer investing in savings accounts and bank deposits and Post office plans and schemes, and as the risks are lower in this sort of investment, therefore, the returns are low too. This is also because higher the risk, higher the returns, and vice versa.
| 1 to 5% | 5 to 15% | 15 to 20% | 20 to 30% | More than 30% |
| 11 | 8 | 5 | 4 | 7 |
Q5. If you are given a choice, then what percentage of your total income would you be willing to invest?
Interpretation: From the above question, it can be interpreted that, people mostly prefer investing up to 20% of their income. This could be because of the risks that are involved while investing in shares, and the higher maturity period, as most of them cater to more than 4 people in their family.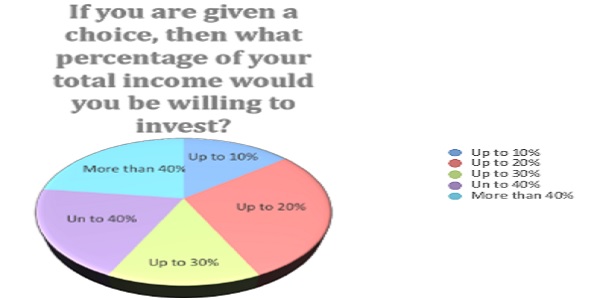
| Up to 10% | Up to 20% | Up to 30% | Up to 40% | More than 40% |
| 5 | 10 | 5 | 7 | 8 |
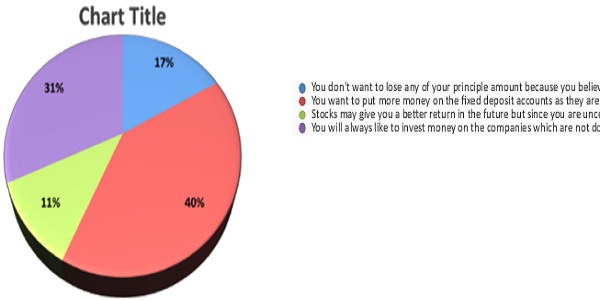
Q 6. What is your attitude towards investing money?
Interpretation: From the above question, it was depicted that most of the people want to put more money on the fixed deposit accounts as they are relatively safe, which can be understood as the risks are much lower as compared to other forms of investments.
| You don’t want to lose | You want to put more | Stocks may give you | You will always like |
| any of your principle | money on the fixed | a better return in the | to invest money on |
| amount because you | deposit accounts as | future but since you | the companies which |
| believe that is the | they are relatively | are uncertain about | are not doing too well |
| biggest loss | safe | your future you will like to focus on the present more | right now but has good prospects of growth as that gives as opportunity to gain money |
| 6 | 14 | 4 | 11 |
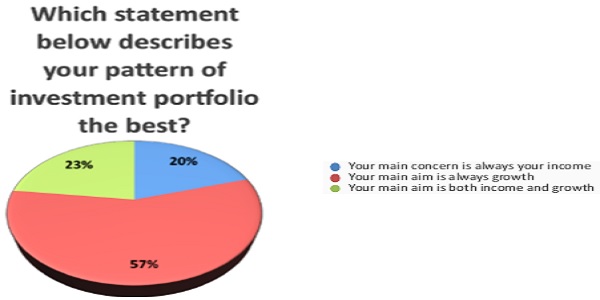
Q7. Which statement below describes your pattern of investment portfolio the best?
Interpretation: From the above question, it can be analysed that people mostly prefer investing to make a growth in their portfolio.
| Your main concern is always your income | Your main aim is always growth | Your main aim is both income and growth |
| 7 | 20 | 8 |
Q8. How much risk do you think you can take?
Interpretation: From the above question, it can be analysed that, mostly people are risk aversive, and therefore, investors prefer investing in savings accounts and post offices.
| You love taking risk | You like to go for a mixture of risk and caution | You hate taking risks completely |
| 8 | 9 | 18 |

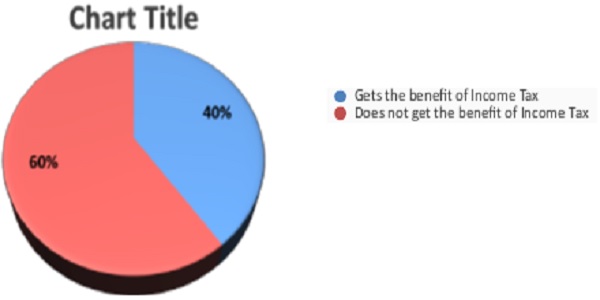
Q9. Do you get tax benefits?
Interpretation: From the above question, it can be interpreted that only 1 person out of 35 respondents does not get tax benefits. This is because, as per the new Finance Act, 2021, the investors will not be getting the benefit of Section 80C of Income Tax Act, 1961, known as Equity Linked Savings Scheme (ELSS). All mutual funds can only allot units to investors after they receive an applicant’s subscription money in their respective Scheme Collection Account, according to the new rules governing Unit Allotment in mutual funds. As a result, depending on the bank from where they are making the payment, various applicants/investors are receiving their units on different dates and at different Net Asset Values (NAVs).
| Gets the benefit of Income Tax | Does not get the benefit of Income Tax |
| 14 | 21 |
INFERENTIAL STATISTICS
Inferential statistics are strategies for generalising about the populations from whom surveys were collected. As a result, it’s critical that the sample is representative of the entire population. The tool for accomplishing this is sampling. It is often regarded as one of statistics’ most important branches.
Inferential statistics are based on the notion that sampling is subject to mistake and that no one sample can fully represent the complete population. The methods of inferential statistics are as follows:
(a) The estimation of parameter: The estimation of a parameter entails utilising a statistic from a sample to make a statement about a specified population parameter.
(b) Testing of statistical hypotheses: This is where you can describe research questions using the data you’ve obtained.
CHI-SQUARE TEST
The Chi-Square test is extensively used to evaluate correlations between two or more category variables. Variables might be categorical (qualitative) or quantitative (quantitative) (numerical). The assumptions of the Chi-square test are as follows:
(a) The categories are mutually exclusive, which means that any subject can only belong to one.
(b) The information should be presented in the form of frequencies or counts for each class, rather than percentages.
(c) The information should be presented in the form of frequencies or counts for each class, rather than percentages.
(d) Chi-square cannot be utilised when more than 20% of the predicted frequencies have a value of less than 5. To address this issue, follow these steps: Either combine the categories only if they are relevant, or gather more information.
Objective of the test: To determine if there is a link between income and investment %.
Table: The dependency of investment on income level: Observed frequency Test Procedure.
| Income Levels (per | <10% | >40% | 10-20% | 20-30% | Grand Total |
| Less than Rs.
25,000 |
0 | 2 | 2 | 1 | 5 |
| Rs. 25,001-
45,000 |
3 | 2 | 1 | 1 | 7 |
| Rs. 45,001-
65,000 |
2 | 1 | 2 | 1 | 6 |
| Rs. 65,001-
85,000 |
2 | 3 | 4 | 3 | 12 |
| Above Rs.
85,000 |
1 | 2 | 1 | 1 | 5 |
| Grand Total | 8 | 10 | 10 | 7 | 35 |
Construction of Test Statistics: We calculate Expected Frequencies under the Null Hypothesis, which assumes that there is no association between the two variables, and then compare observed and expected frequencies. H0 (H0=income level and % of investment is not significantly associated) is not rejected if both are the same or very nearby. Because we are correct in our assumptions.
Formula: Expected Frequency= (Row Total*Column Total)/Grand Total
Table: The dependency of investment on income level: Expected Frequency
| Income Levels (per | <10% | >40% | 10-20% | 20-30% | Grand Total |
| Less than Rs.
25,000 |
1.142 | 1.428 | 1.428 | 1 | 5 |
| Rs. 25,001-
45,000 |
1.60 | 2 | 2 | 1.4 | 7 |
| Rs. 45,001-
65,000 |
1.60 | 2 | 2 | 1.40 | 6 |
| Rs. 65,001-
85,000 |
1.371 | 1.114 | 1.714 | 1.20 | 12 |
| Above Rs.
85,000 |
2.742 | 3.428 | 3.428 | 2.40 | 5 |
| Grand Total | 8 | 10 | 10 | 7 | 35 |
Chi-Square test= 0.127652, by using the formula CHISQ.TEST() in the Excel sheet. This means that the expected frequency and the observed frequency of the dependency of investment on income level are quite similar in nature.
Since there are 5 classes, therefore, the degree of freedom which is (N-1) is (5-1) = 4
Conclusion: Through these tables, it can be well depicted that higher will be the income of the people, more will be the eagerness to invest in different spheres of tools of investments.
Objective of this test: To analyze whether there is a relationship between the type of investment and the risk-taking ability.
Table: Type of investment and risk-taking ability: observed frequency
| Risk taking ability | Real estate | Silver | Derivatives | Post office plans and schemes | Savings accounts, bank deposits | Bonds | Equity shares | Others | Total |
| High | 0 | 0 | 2 | 4 | 3 | 4 | 1 | 1 | 15 |
| Low | 1 | 0 | 1 | 1 | 0 | 0 | 1 | 1 | 5 |
| Moderate | 4 | 1 | 3 | 2 | 2 | 1 | 1 | 1 | 15 |
| Total | 5 | 1 | 6 | 7 | 5 | 5 | 3 | 3 | 35 |
Construction of Test Statistics: Under the Null Hypothesis, which assumes that the values have no relation between the two variables. We calculate Expected Frequencies and then compare observed frequencies with expected frequencies. If both are the same or very close, then H0 (H0=income level and % of investment which is not significantly associated) is not rejected. Because our Assumptions are true.
Table: Type of investment and risk-taking ability: expected frequency
| Risk taking ability | Real estate | Silver | Derivatives | Post office plans and schemes | Savings accounts, bank deposits | Bonds | Equity shares | Others | Total |
| High | 2.142 | 0.428 | 2.571 | 3 | 2.142 | 2.142 | 1.285 | 1.285 | 15 |
| Low | 0.714 | 0.142 | 0.857 | 1 | 0.714 | 0.714 | 0.428 | 0.428 | 5 |
| Moderate | 2.142 | 0.428 | 2.571 | 3 | 2.142 | 2.142 | 1.285 | 1.285 | 15 |
| Total | 5 | 1 | 6 | 7 | 5 | 5 | 3 | 3 | 35 |
The expected frequency counts are computed separately for each level of one categorical variable at each level of the other categorical variable.
Chi-Square test= 0.616346, by using the formula CHISQ.TEST() in the Excel sheet. This means that the expected frequency and the observed frequency of the type of investment and risk-taking ability are not similar in nature.
Since there are 3 classes, therefore, the degree of freedom which is (N-1) is (3-1) = 2
Conclusion: Through these tables, we can well analyse that, people usually want to invest in low-risk oriented tools of investments like Post office plans and schemes and Savings accounts, bank deposits.
The objective of the test: To analyze whether there is a relationship between annual income and risk-taking ability.
Table: Annual income and risk-taking ability: observed frequency
| Income bracket | High | Low | Moderate | Total |
| Less than Rs.
25,000 |
0 | 3 | 2 | 5 |
| Rs. 25,001-
45,000 |
1 | 4 | 2 | 7 |
| Rs. 45,001-
65,000 |
1 | 3 | 2 | 6 |
| Rs. 65,001-
85,000 |
2 | 4 | 6 | 12 |
| Above Rs. | 2 | 1 | 2 | 5 |
| Total | 6 | 15 | 14 | 35 |
Construction of Test Statistics:
Under the Null Hypothesis, we calculate Expected Frequencies and then compare observed frequencies with expected frequencies. If both are the same or very close, then H0 (H0=income level and % of investment which is not significantly associated) is not rejected. Because our Assumptions are true.
The expected frequency counts are computed separately for each level of one categorical variable at each level of the other categorical variable.
Table: Annual income and risk-taking ability: expected frequency
| Income bracket | High | Low | Moderate | Total |
| Less than Rs.
25,000 |
1 | 2.142 | 2 | 5 |
| Rs. 25,001-
45,000 |
1.20 | 3 | 2.80 | 7 |
| Rs. 45,001-
65,000 |
1.028 | 2.571 | 2.40 | 6 |
| Rs. 65,001-
85,000 |
2.057 | 5.142 | 4.80 | 12 |
| Above Rs. | 1 | 2.142 | 2 | 5 |
| Total | 6 | 15 | 14 | 35 |
Chi-square test= 0.834656, by using the formula CHISQ.TEST() in the Excel sheet. This means that the expected frequency and the observed frequency of annual income and risk-taking ability are not similar in nature.
Since there are 5 classes, therefore, the degree of freedom which is (N-1) is (5-1) = 4
Conclusion: From the above tables, it can be understood that people usually prefer to take risk (risk oriented), and people who have a lower income, are risk aversive.
SUGGESTIONS
The survey is mostly based on people who cater to the needs of more than 4 people in the family, therefore, it stands important to understand the psychology of them. When people consider investing their funds, they need a clear image of the possibilities accessible to them, and most investors rely on web-based information or try to obtain information from friends and family members for this.
When it comes to investing their hard-earned money, though, they should seek advice from a professional and proceed with caution. Also, based on your expectations and need for the investment, it is critical to appropriately discern between short-term and long-term goals and invest accordingly.
Finally, if they have more than 2-3 dependents in their household, they should seek out low risk investing opportunities.
CONCLUSION
The way of investing of different groups of people with different income strata, it becomes extremely important to understand the psychology of their investment strategy. Especially, people who cater to the needs of more than 4 people, it becomes risker to invest in equity shares, due to the presence of higher risks. It is necessary to distinguish between short-term and longterm goals and to invest accordingly. You can determine the risk you can afford to accept while investing based on your income and other sources of income in your family.