Introduction: The Ministry of Finance recently announced a significant milestone in GST revenue collection for March 2024, recording the second-highest monthly collection at ₹1.78 lakh crore. This article delves into the details of this achievement, analyzing the growth trajectory and implications of this robust performance.
Detailed Analysis:
1. March 2024 GST Revenue:
-
- The Gross GST revenue for March 2024 reached ₹1.78 lakh crore, showcasing an impressive 11.5% year-on-year growth.
- Notably, domestic transactions contributed significantly to this surge, with a remarkable 17.6% increase in GST collection.
- The net GST revenue, after refunds, stood at ₹1.65 lakh crore, indicating a substantial 18.4% growth compared to the same period last year.
2. FY 2023-24 Performance:
-
- The fiscal year 2023-24 witnessed an outstanding performance, with total gross GST collection surpassing ₹20.18 lakh crore.
- This represents an impressive 11.7% growth compared to the previous fiscal year, with an average monthly collection of ₹1.68 lakh crore.
- The net GST revenue for the fiscal year stood at ₹18.01 lakh crore, reflecting a substantial 13.4% growth over the same period last year.
3. Breakdown of Collections:
-
- The breakdown of March 2024 collections includes CGST, SGST, IGST, and Cess components, highlighting positive trends across all segments.
- Similar positive trends were observed throughout the fiscal year, emphasizing the consistency and robustness of GST revenue collection.
4. Inter-Governmental Settlement:
-
- The Central Government’s settlement of IGST collections to CGST and SGST for March 2024 amounted to ₹43,264 crore and ₹37,704 crore, respectively.
- For the entire fiscal year, the settlements totaled ₹4,87,039 crore to CGST and ₹4,12,028 crore to SGST, further strengthening state revenues.
5. State-wise Analysis:
-
- Detailed tables present the state-wise growth of GST revenues during March 2024, showcasing varying growth percentages across different regions.
- Additionally, post-settlement SGST figures for each state offer insights into the distribution of revenue post-collection.
Conclusion: The Ministry of Finance’s report on the March 2024 GST revenue highlights a remarkable achievement, indicating robust growth and consistency in tax collection. With positive trends observed across various components and states, this performance underscores the resilience and effectiveness of India’s GST regime. As the government continues its efforts to streamline tax administration and enhance compliance, such milestones pave the way for sustained economic growth and fiscal stability.
*****
Ministry of Finance
Second highest monthly Gross GST Revenue collection in March at ₹1.78 lakh crore; Records 11.5% y-o-y growth (18.4% on net basis)
Yearly gross revenue ₹20.18 lakh crore; 11.7% growth (13.4% on net basis)
Posted On: 01 APR 2024 3:41PM by PIB Delhi
Gross Good and Services Tax (GST) revenue for March 2024 witnessed the second highest collection ever at ₹1.78 lakh crore, with a 11.5% year-on-year growth. This surge was driven by a significant rise in GST collection from domestic transactions at 17.6%. GST revenue net of refunds for March 2024 is ₹1.65 lakh crore which is growth of 18.4% over same period last year.
Strong Consistent Performance in FY 2023-24: FY 2023-24 marks a milestone with total gross GST collection of Rs. 20.18 lakh crore exceeding ₹20 lakh crore, a 11.7% increase compared to the previous year. The average monthly collection for this fiscal year stands at ₹1.68 lakh crore, surpassing the previous year’s average of ₹1.5 lakh crore. GST revenue net of refunds as of March 2024 for the current fiscal year is ₹18.01 lakh crore which is a growth of 13.4% over same period last year.
Positive Performance Across Components:
Breakdown of March 2024 Collections:
- Central Goods and Services Tax (CGST): ₹34,532 crore;
- State Goods and Services Tax (SGST): ₹43,746 crore;
- Integrated Goods and Services Tax (IGST): ₹87,947 crore, including ₹40,322 crore collected on imported goods;
- Cess: ₹12,259 crore, including ₹996 crore collected on imported goods.
Similar positive trends are observed in the entire FY 2023-24 collections:
- Central Goods and Services Tax (CGST): ₹3,75,710 crore;
- State Goods and Services Tax (SGST): ₹4,71,195 crore;
- Integrated Goods and Services Tax (IGST): ₹10,26,790 crore, including ₹4,83,086 crore collected on imported goods;
- Cess: ₹1,44,554 crore, including ₹11,915 crore collected on imported goods.
Inter-Governmental Settlement: In the month of March, 2024, the Central Government settled ₹43,264 crore to CGST and ₹37,704 crore to SGST from the IGST collected. This translates to a total revenue of ₹77,796 crore for CGST and ₹81,450 crore for SGST for March, 2024 after regular settlement. For the FY 2023-24, the central government settled ₹4,87,039 crore to CGST and ₹4,12,028 crore to SGST from the IGST collected.
The chart below shows trends in monthly gross GST revenues during the current year. Table-1 shows the state-wise figures of GST collected in each State during the month of March, 2024 as compared to March, 2023. Table-2 shows the state-wise figures of post settlement GST revenue of each State till the month of March, 2024.
Chart: Trends in GST Collection
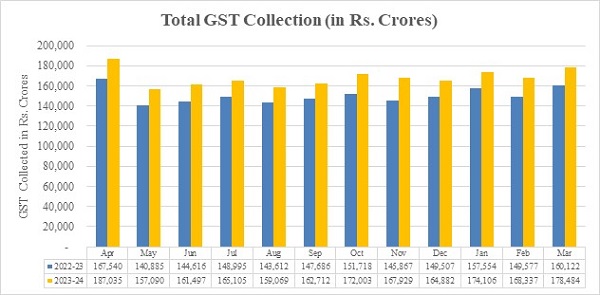
Table 1: State-wise growth of GST Revenues during March, 2024[1]
| State/UT | Mar-23 | Mar-24 | Growth (%) |
| Jammu and Kashmir | 477 | 601 | 26% |
| Himachal Pradesh | 739 | 852 | 15% |
| Punjab | 1,735 | 2,090 | 20% |
| Chandigarh | 202 | 238 | 18% |
| Uttarakhand | 1,523 | 1,730 | 14% |
| Haryana | 7,780 | 9,545 | 23% |
| Delhi | 4,840 | 5,820 | 20% |
| Rajasthan | 4,154 | 4,798 | 15% |
| Uttar Pradesh | 7,613 | 9,087 | 19% |
| Bihar | 1,744 | 1,991 | 14% |
| Sikkim | 262 | 303 | 16% |
| Arunachal Pradesh | 144 | 168 | 16% |
| Nagaland | 58 | 83 | 43% |
| Manipur | 65 | 69 | 6% |
| Mizoram | 70 | 50 | -29% |
| Tripura | 90 | 121 | 34% |
| Meghalaya | 202 | 213 | 6% |
| Assam | 1,280 | 1,543 | 21% |
| West Bengal | 5,092 | 5,473 | 7% |
| Jharkhand | 3,083 | 3,243 | 5% |
| Odisha | 4,749 | 5,109 | 8% |
| Chhattisgarh | 3,017 | 3,143 | 4% |
| Madhya Pradesh | 3,346 | 3,974 | 19% |
| Gujarat | 9,919 | 11,392 | 15% |
| Dadra and Nagar Haveli and Daman & Diu | 309 | 452 | 46% |
| Maharashtra | 22,695 | 27,688 | 22% |
| Karnataka | 10,360 | 13,014 | 26% |
| Goa | 515 | 565 | 10% |
| Lakshadweep | 3 | 2 | -18% |
| Kerala | 2,354 | 2,598 | 10% |
| Tamil Nadu | 9,245 | 11,017 | 19% |
| Puducherry | 204 | 221 | 9% |
| Andaman and Nicobar Islands | 37 | 32 | -14% |
| Telangana | 4,804 | 5,399 | 12% |
| Andhra Pradesh | 3,532 | 4,082 | 16% |
| Ladakh | 23 | 41 | 82% |
| Other Territory | 249 | 196 | -21% |
| Center Jurisdiction | 142 | 220 | 55% |
| Grand Total | 1,16,659 | 1,37,166 | 18% |
Table-2: SGST & SGST portion of IGST settled to States/UTs April-March (Rs. in crore)
| Pre-Settlement SGST | Post-Settlement SGST[2] | |||||
| State/UT | 2022-23 | 2023-24 | Growth | 2022-23 | 2023-24 | Growth |
| Jammu and Kashmir | 2,350 | 2,945 | 25% | 7,272 | 8,093 | 11% |
| Himachal Pradesh | 2,346 | 2,597 | 11% | 5,543 | 5,584 | 1% |
| Punjab | 7,660 | 8,406 | 10% | 19,422 | 22,106 | 14% |
| Chandigarh | 629 | 689 | 10% | 2,124 | 2,314 | 9% |
| Uttarakhand | 4,787 | 5,415 | 13% | 7,554 | 8,403 | 11% |
| Haryana | 18,143 | 20,334 | 12% | 30,952 | 34,901 | 13% |
| Delhi | 13,619 | 15,647 | 15% | 28,284 | 32,165 | 14% |
| Rajasthan | 15,636 | 17,531 | 12% | 35,014 | 39,140 | 12% |
| Uttar Pradesh | 27,366 | 32,534 | 19% | 66,052 | 76,649 | 16% |
| Bihar | 7,543 | 8,535 | 13% | 23,384 | 27,622 | 18% |
| Sikkim | 301 | 420 | 39% | 839 | 951 | 13% |
| Arunachal Pradesh | 494 | 628 | 27% | 1,623 | 1,902 | 17% |
| Nagaland | 228 | 307 | 35% | 964 | 1,057 | 10% |
| Manipur | 321 | 346 | 8% | 1,439 | 1,095 | -24% |
| Mizoram | 230 | 273 | 19% | 892 | 963 | 8% |
| Tripura | 435 | 512 | 18% | 1,463 | 1,583 | 8% |
| Meghalaya | 489 | 607 | 24% | 1,490 | 1,713 | 15% |
| Assam | 5,180 | 6,010 | 16% | 12,639 | 14,691 | 16% |
| West Bengal | 21,514 | 23,436 | 9% | 39,052 | 41,976 | 7% |
| Jharkhand | 7,813 | 8,840 | 13% | 11,490 | 12,456 | 8% |
| Odisha | 14,211 | 16,455 | 16% | 19,613 | 24,942 | 27% |
| Chhattisgarh | 7,489 | 8,175 | 9% | 11,417 | 13,895 | 22% |
| Madhya Pradesh | 10,937 | 13,072 | 20% | 27,825 | 33,800 | 21% |
| Gujarat | 37,802 | 42,371 | 12% | 58,009 | 64,002 | 10% |
| Dadra and Nagar Haveli and Daman and Diu | 637 | 661 | 4% | 1,183 | 1,083 | -8% |
| Maharashtra | 85,532 | 1,00,843 | 18% | 1,29,129 | 1,49,115 | 15% |
| Karnataka | 35,429 | 40,969 | 16% | 65,579 | 75,187 | 15% |
| Goa | 2,018 | 2,352 | 17% | 3,593 | 4,120 | 15% |
| Lakshadweep | 10 | 19 | 93% | 47 | 82 | 75% |
| Kerala | 12,311 | 13,967 | 13% | 29,188 | 30,873 | 6% |
| Tamil Nadu | 36,353 | 41,082 | 13% | 58,194 | 65,834 | 13% |
| Puducherry | 463 | 509 | 10% | 1,161 | 1,366 | 18% |
| Andaman and Nicobar Islands | 183 | 206 | 12% | 484 | 528 | 9% |
| Telangana | 16,877 | 20,012 | 19% | 38,008 | 40,650 | 7% |
| Andhra Pradesh | 12,542 | 14,008 | 12% | 28,589 | 31,606 | 11% |
| Ladakh | 171 | 250 | 46% | 517 | 653 | 26% |
| Other Territory | 201 | 231 | 15% | 721 | 1,123 | 56% |
| Grand Total | 4,10,251 | 4,71,195 | 15% | 7,70,747 | 8,74,223 | 13% |
****

Author Bio


