3.11 (Shrimad Bhagvad Gita)
Creating sustainable systems requires a good understanding of the basic
principle of mutuality and inter-dependence
Following payment defaults by subsidiaries of Infrastructure Leasing and Financing Services and by Dewan Housing Finance Limited, investors in Liquid Debt Mutual Funds (LDMFs) ran collectively to redeem their investments. In fact, the defaults triggered panic across the entire gamut of NBFC-financiers, thereby causing a funding (liquidity) crisis in the NBFC sector. This chapter highlights that problems faced by the NBFCs stemmed from their over-dependence on short-term wholesale funding from the Liquid Debt Mutual Funds. While such reliance works well in good times, it generates significant risk to NBFCs from the inability to roll over the short-term funding during times of stress. An asset-side shock not only exacerbates the Asset Liability Management (ALM) problem but also makes investors in LDMFs jittery and thereby leads to a redemption pressure that is akin to a “bank run.” This run on LDMFs then precipitates the refinancing (rollover) risk for NBFCs and further exacerbates the initial problems caused on the asset side. A dynamic health index (Health Score) is constructed that captures these risks and can be used as an early warning system to anticipate liquidity crisis in an NBFC. Policy makers can use this tool to monitor, regulate and avert financial fragility in the NBFC sector.
8.1 The liquidity crunch in the shadow banking system in India (Box 1) took shape in the wake of defaults on loan obligations by major Non-Banking Financial Companies (NBFCs). Two subsidiaries of Infrastructure Leasing & Financial Services (IL&FS) defaulted on their payments in the period from June to September 2018, while Dewan Housing Finance Limited (DHFL) did so in the period from June to August 2019. Both these entities defaulted on non-convertible debentures and commercial paper obligations for amounts of approximately ` 1500-1700 crore.
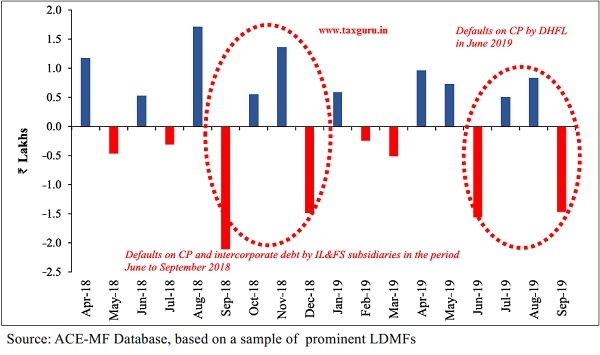
8.2 In response to the defaults, mutual funds started selling off their investments in the NBFC sector to reduce exposure to stressed NBFCs. A case in point is DSP Mutual Fund selling DHFL commercial papers (CPs) worth ` 300 crore at a steep discount in September 2018.1 Panic-stricken investors in debt mutual funds started pulling out their investments in these funds rapidly. Coinciding with the news of payment defaults by IL&FS and DHFL being known to the wider market, the months of September 2018 and June 2019 saw the highest net outflows from LDMFs and money market funds, as shown in Figure 1.
Figure 1: Net Inflows – Liquid Debt Mutual Funds (LDMFs) & Money Market Funds (Rs. Crore)
8.3 On June 4, 2019, the net asset value of debt funds, which held debt instruments issued by the stressed NBFCs, fell by 53 per cent in one day when news about its default became public.2 The drop in net asset value was due to the twin effects of debt mutual funds writing off their investments in stressed NBFCs and asset sales at fire sale prices to meet unexpected high redemptions.
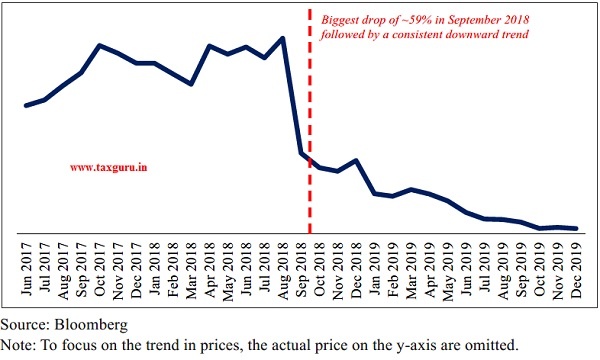
8.4 The impact of these defaults was not limited to debt markets. There was a sharp decline in the equity prices of stressed NBFCs as equity market participants anticipated repayment troubles at these firms a few months in advance of actual defaults. As illustrated in Figure 2, the equity prices in stressed NBFCs showed a consistent downward trend from May 2018. Interestingly, the plot shows that the equity prices dipped dramatically in September 2018.
8.5 Therefore, both debt and equity investors suffered a massive erosion in wealth due to the defaults. To get a sense of the quantum of losses, debt mutual funds with exposure to stressed NBFCs lost approximately ` 4000 crore after adjusting for recoveries in the aftermath of defaults.3 Debt mutual funds, facing increasing redemptions, were hesitant to finance the NBFC sector. This, in turn, led to the difficulty of NBFCs to raise funds, which took a toll on the overall credit growth in the Indian economy and a decline in GDP growth.
8.6 Given the significant economic impact of the liquidity crisis on the domestic economy, it would be a fruitful exercise to
Figure 2: Trend in Equity Prices of stressed NBFC (July 2017- December 2019)
investigate whether there were any early warning signs of stress in the NBFC sector. An index is developed to estimate the financial fragility of the NBFC sector and it was found that it can predict the constraints on external financing (or refinancing risk) faced by NBFC firms. This index is called as the Health Score, which ranges between -100 to +100 with higher scores indicating higher financial stability of the firm/sector. The Health Score employs information on the key drivers of refinancing risk such as Asset Liability Management (ALM) problems, excess reliance on short-term wholesale funding (Commercial Paper) and balance sheet strength of the NBFCs.
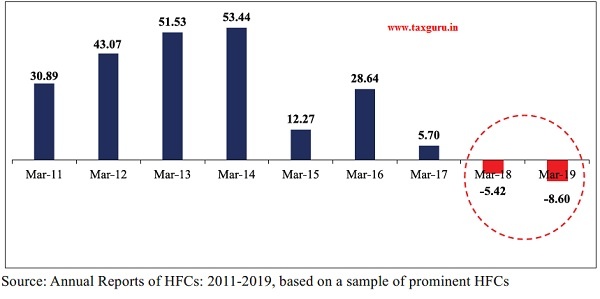
8.7 The Health Score provides a good diagnostic for the problems in the NBFC sector. For instance, figure 3 shows that
Figure 3: Health Score of a stressed NBFC
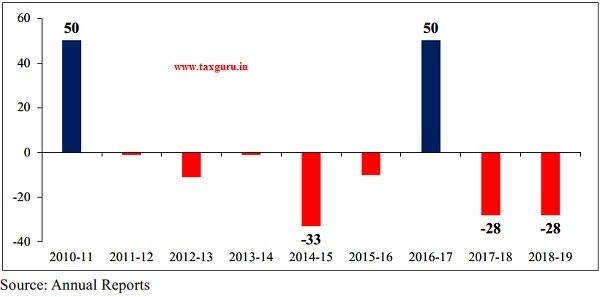
the Health Score of a stressed NBFC was consistently low throughout the period 201119 with a sharp decrease in 2017-18. Hence, the Health Score of the stressed NBFC over the entire eight- year period provided significant early warning signals.
8.8 Figure 4, which highlights the ALM problem in the stressed NBFC and Figure 5, which highlights the over-dependence of the NBFC on short-term wholesale funding, show adverse trends in the refinancing risk faced by the NBFC. Except for 2011 and 2017, Figure 4 shows that ALM mismatch in the shorter tenures was negative for all the years coincinding with the years when the Health Score of the NBFC was low.
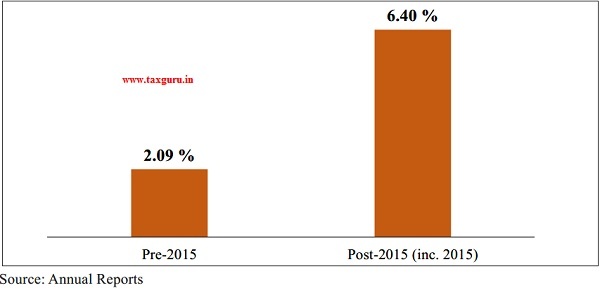
8.9 Figure 5 highlights that for the post- 2015 period, the average reliance on short-term wholesale funding increased steeply by more than 200 per cent relative to pre-2015. Given the long term duration of assets of the stressed NBFC, this over dependence on commercial paper funding created exposure to refinancing risk. This is also consistent
Figure 4: ALM Profile (Assets – Liabilities as a percentage of Total Assets) of a stressed NBFC
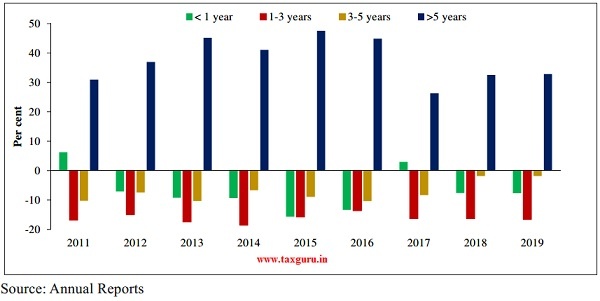
Figure 5: Reliance on Short-Term Wholesale Funding (Commercial Paper as a percentage of Borrowings) of a stressed NBFC
with the Health Scores of the stressed NBFC which have been very low for three out of four years post-2015.
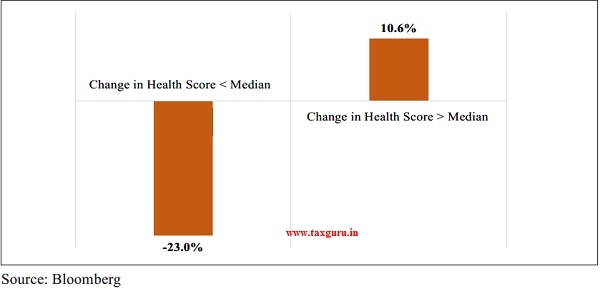
8.10 Figure 6 further validates the use of the Health Score by showing that it is a leading indicator of stress at a stressed NBFC. It was observed that if the year-over-year change in Health Score is higher (lower) than the median, the cumulative abnormal returns for of a stressed NBFC stock was higher (lower). Cumulative abnormal returns net out the impact of other confounding factors that affect stock markets and are thereby able to capture the pure effect of events relating to a particular stock or set of stocks. This indicates that equity markets reacted favorably to impovement in Health Scores.
Figure 6: Cumulative Abnormal Returns vs. Change in Health Score of a stressed NBFC
8.11 Turning to the Housing Finance Companies (HFCs), it was found that the Health Score of the HFC sector also exhibited a declining trend post 2013-14, as indicated in Figure 7. The trend of the Health Score showed early warning signs, well before the HFC sector eventually faced constraints on external financing from 2017-18 onwards. Again, this confirms that the Health Score is a leading indicator of stress in the HFC sector.
Figure 7: Health Score of HFC Sector
8.12 These diagnostic plots on the Health Scores of a stressed NBFC and the HFC sector indicate that the Health Score can serve the critical role of predicting refinancing related stress faced by the financial firms in advance. It can serve as an important monitoring mechanism to prevent such problems in future. Furthermore, disaggregating the components and examining their trends can shed light on how to regulate NBFCs.
8.13 Other than its utility as a leading indicator of stress in the NBFC sector, the Health Score can also be used by policy makers to allocate scarce capital to stressed NBFCs in an optimal way to alleviate a liquidity crisis.
8.14 To summarize, redemption pressure faced by debt mutual funds is akin to a “bank run”, which is a characteristic of any crisis in the financial sector. The redemption pressure gives rise to refinancing risk (rollover risk) for NBFCs, thereby affecting the real sector. The extent of refinancing risk faced by NBFCs is fundamentally driven by their reliance on short-term wholesale funding. The chapter analyze the mechanisms through which the reliance on short-term wholesale funding is manifested with an aim to develop a quantifiable measure (Health Score) that can predict stress in the NBFC sector.
BOX 1: THE SHADOW BANKING SYSTEM
To quote (Ghoshet al., 2012), “Shadow banking comprises a set of activities, markets, contracts and institutions that operate partially (or fully) outside the traditional commercial banking sector and are either lightly regulated or not regulated at all. A shadow banking system can be composed of a single entity that intermediates between end-suppliers and end-users of funds, or it could involve multiple entities forming a chain”. Shadow banks do not have explicit access to central bank liquidity. The shadow banking system is highly levered with risky and illiquid assets while its liabilities disposed to “bank runs”.
The focus in this chapter is on three important segments of the shadow banking system in India, namely, Non-Banking Housing Finance Companies (HFCs), Retail Non-Banking Financial Companies (Retail-NBFCs) and Liquid Debt Mutual Funds (LDMFs). The NBFC sector is lightly regulated as compared to the traditional banking system consisting of public and private sector banks and other financial institutions. However, the regulation in NBFC sector has evolved over time with prudential norms discouraging deposit-taking by NBFC (Reserve Bank of India (RBI), 1998) and encouraging the entry of non-deposit-taking NBFCs (RBI, 2006). The combination of these two effects has led to a steady decline in the share of deposits and increase in wholesale funding in the funding sources of the NBFCs. The wholesale funding sources of the NBFCs comprise mainly of banks (primarily via term loans and rest through non-convertible debentures and commercial paper) and debt mutual funds (via non-convertible debentures and commercial paper).
CONCEPTUAL FRAMEWORK OF ROLLOVER RISK
8.15 Financial institutions rely on short-term financing to fund long-term investments. This reliance on short-term funding causes an asset liability management (ALM) problem because asset side shocks expose financial institutions to the risk of being unable to finance their business.
8.16 More specifically, in the context of the liquidity crisis in the NBFC sector, a conceptual framework is built based on the following insights:
(i) NBFCs raise capital in the short-term (1-3 months) commercial paper (CP) market at a lower cost, as compared to the long term (5-10 years) non-convertible debenture (NCD) market but face the risk of rolling over the CP debt at short frequencies of a few months.4 The frequent repricing exposes NBFCs to the risk of facing higher financing costs and, in the worst case, credit rationing. Such refinancing risks are referred as Rollover Risk.
(ii) When an asset-side shock reduces expected future cashflows for an NBFC, it adversely affects the ALM problem in the NBFC and thereby risk perceptions about the NBFC.
(iii) Such a shock amplifies the NBFC’s problems when its liability structure is over-dependent on short-term wholesale funding such as commercial paper, which requires frequent refinancing.
(iv) The LDMF sector is a primary source of short-term wholesale funds in the NBFC sector. Thus, the NBFC sector is intricately connected with the Liquid Debt Mutual Fund (LDMF) sector.5
(v) This interconnectedness is a channel for the transmission of systemic risk from the NBFC sector to the LDMF sector. Shocks in the NBFC sector may lead to concerted redemptions by investors in the LDMF sector at fire-sale prices. Faced with this situation, LDMFs may withdraw funding to the NBFC sector when refinancing is due. Such a reinforcing cycle can quickly turn into a vicious cycle, leading to a liquidity crisis in the NBFC sector. More technically, systemic risk is transmitted from the NBFC sector to the LDMF sector and vice-versa, i.e., interconnectedness causes systemic risk transmission between an NBFC sector and the LDMF sector.
(vi) In general, if the quantum of defaults is large enough (as was the case with IL&FS and DHFL), it can spread panic among the investors in CP leading to concerted redemptions in the LDMF sector (systemic risk within the LDMF sector). Moreover, the liquidity crunch in an NBFC adversely affects risk perceptions about other NBFCs when they are due for rolling over their CP obligations. Hence, Rollover risk, initially contained within a few NBFCs may rapidly spillover and affect the entire NBFC sector (systemic risk within the NBFC sector).
(vii) The key drivers of the redemption problem in the LDMF sector, and thereby the Rollover Risk problem in the NBFC sector, are threefold: The first risk stems from the magnitude of the ALM problem in the NBFC. The second risk originates from the interconnectedness of the NBFC with the LDMF sector. This risk depends on the extent to which an NBFC relies on short-term wholesale funding and the liquidity buffers in the LDMF sector to absorb redemption pressure. The third risk stems from the inherent resilience of the NBFC, as reflected in the strength of the balance sheet, which allows it to absorb shocks in the first place.
(viii) These three risks work in tandem to cause Rollover Risk. At the time of refinancing their CP obligations, the NBFCs having stronger balance sheets are successful in rolling over CPs, albeit at a higher cost. Other NBFCs with weaker balance sheets face higher default probabilities and find it difficult to access the CP market at affordable rates or are unable to raise money at all, i.e., they are unable to avoid default.
(ix) At the most fundamental level, the root cause of the liquidity crisis in the NBFC sector can be traced to the over-dependence of NBFCs on the short-term wholesale funding market. This factor works through two channels, a direct channel and an indirect channel. First, an increase in short-term wholesale funding causes a direct effect by increasing the amount of funding that is subject to frequent repricing, and therefore, Rollover Risk. Second, there are indirect effects in that an increase in short-term wholesale funding influences the two key drivers of Rollover Risk – it worsens the ALM mismatch problem and increases the degree of interconnectedness of the NBFC sector with the LDMF sector. In addition, if the NBFC’s balance sheet strength is suspect, Rollover Risk is further exacerbated. In short, overdependence on short-term wholesale funding has direct and indirect impact on Rollover Risk.
8.17 Figure 8 illustrates the drivers of rollover risk in the NBFC sector. Redemptions pressures in the LDMF sector are exacerbated when NBFCs face an asset-side shock and experience an ALM problem, which gets compounded due to interconnectedness and lack of balance sheet resilience. Faced with redemption pressures, the LDMF sector is reluctant to roll over loans to the NBFC sector (Rollover Risk), causing a liquidity crunch in the NBFC sector.
Figure 8: Rollover Risk Schematic ( NBFC Sector)

8.18 To develop policy implications, financial metrics were employed to estimate the drivers of Rollover Risk and weigh them appropriately based on their relative contribution to Rollover Risk. This procedure helps to generate a measure of the health of an NBFC. This measure is called as the Health Score, which is an indicator of potential rollover risk issues faced by an NBFC. The validity of this indicator as a predictor of future performance is also tested using market data.
DIFFERENCES BETWEEN HFCs AND RETAIL-NBFCs
8.19 The NBFC sector analysis is conducted for two sub-sectors: (i) Housing Finance Companies (HFCs) and (ii) Retail-NBFCs. To analyse the HFC sector, select a set of the five largest HFCs is selected which control, on average, ~82 per cent of the non-banking housing finance sector with an on-book portfolio of ` 8.6 lakh crore as of 31 March 2019. These five HFCs, therefore, are representative of the non-banking housing finance sector in India. To analyse the Retail-NBFC sector, a set of fifteen private sector NBFCs operating in the retail credit segment were selected for analysis. These fifteen NBFCs have assets under management (AUM) of ` 6.8 lakh crore while the total AUM of the industry including PSUs is ` 9.1 lakh crore as of 31 March 2019. These fifteen Retail-NBFCs, therefore, control ~75 per cent of the market and serve as a good proxy for the Retail-NBFC sector. The fifteen Retail-NBFCs are classified into large, medium and small-sized Retail-NBFCs based on assets under management to analyse firm size effects.
8.20 The drivers of Rollover Risk differ between HFCs and Retail-NBFCs are demonstrated first due to the following reasons. First, HFCs hold much longer duration assets (housing loans, developer loans etc.,) as compared to Retail-NBFCs, which hold medium-term assets (auto, consumer durables, gold loans, etc.,). HFCs face a greater gap between the average maturity of their assets and liabilities, as compared to Retail-NBFCs, which typically provide loans of shorter duration in the form of working capital loans to MSME, automobile financing loans or gold loans. Thus, asset side shocks cause significant deterioration in the asset liability mismatch of the HFCs, but they induce less of an adverse impact on asset liability mismatch of Retail-NBFCs.
8.21 Second, Retail-NBFCs rely much more on the short-term wholesale funding market as compared to HFCs. For the sample, the average level of CP as a percentage of borrowings in HFCs was 8.50 per cent while that in Retail-NBFCs was 12.74 per cent from March 2015 till March 2019. Thus, HFCs are less exposed to interconnectedness risk, as compared to Retail-NBFCs. For computing the Rollover Risk score of Retail-NBFCs data is collected on the month-on-month portfolio holdings of the top fifteen LDMFs’ in the Retail-NBFC sector and their overall corpus from March 2014 till March 2019. These fifteen LDMFs control ~70 per cent of the assets under management of the LDMF sector and are representative of the risks emanating out of the Retail-NBFC and the LDMF sector interconnectedness. For computing the redemption risk in the LDMF sector, data is collected on the portfolio holdings of the LDMFs by asset class (i.e., cash, G-secs, T-bills, CP, CD, NCD, and corporate debt). Source of data for LDMFs is the ACE-Mutual Fund database.
8.22 Given these two differences, it is argued that the key drivers of the redemption problem in the LDMF sector (and the rollover problem for NBFCs) differ between HFCs and Retail-NBFCs. The implication of these factors is that the key drivers of Rollover Risk for HFCs are ALM Risk and Financial and Operating Resilience, whereas, for Retail-NBFCs, Interconnectedness Risk and Financial and Operating Resilience are the key drivers of Rollover Risk. A more detailed analysis is presented in next section to support these arguments.
RISKS FROM ASSET LIABILITY MANAGEMENT MISMATCH
8.23 This risk arises in most financial institutions due to a mismatch in the duration of assets and liabilities. Liabilities are of much shorter duration than assets which tend to be of longer duration, especially loans given to the housing sector. This mismatch implies that an NBFC must maintain a minimum amount of cash or cash-equivalent assets to meet its short-term obligations.
8.24 If cash flows from the long-term assets are inadequate to meet its immediate debt obligations, an NBFC can still repay its obligations by issuing fresh CP to avoid defaulting. However, such a refinancing strategy works well only when there are no asset side shocks or liability side shocks.
8.25 During periods of stress, there may be a significant drop in periodic cash flows that would normally arise from an NBFC’s longterm assets. This exacerbates Rollover Risk. NBFCs that maintain adequate cash buffers and do not have asset liability management problems are able to survive through the stress period as they can meet their obligations without having to tap the wholesale funding market. This implies that they have much lower Rollover Risk.
8.26 For HFCs, which invest in significantly longer duration (15 to 20-year horizon) assets, the key driver of Rollover Risk is the ALM risk. ALM risk arises if the future contractual cash inflows from loan assets are not enough to meet the future contractual cash outflows from debt obligations. The cash flows are split into multiple buckets based on the duration of assets and liabilities and the difference between expected inflows and outflows is measured. This difference is normalized by dividing the difference by total assets for meaningful comparison across years. Negative asset liability gap in short tenor buckets can lead to defaults if there is a shock to the asset/liability side and the firm is unable to roll over its debt obligations.
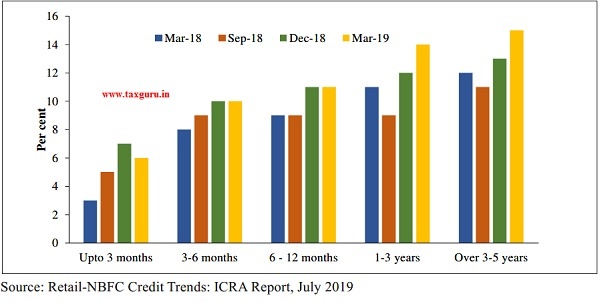
8.27 Figure 9 (a & b) illustrates that the ALM risk is more problematic for HFCs based on a quarter-on-quarter comparison of trends in ALM for the HFC and Retail-NBFC sector. HFCs short term liabilities (up to maturities of 3 years) are clearly greater than their assets in these maturity buckets. Therefore, HFCs face significant rollover risk due to their ALM mismatch problem. In contrast, for Retail-NBFCs, the assets are greater than their liabilities with respect to the profile of cashflows for all maturity buckets. The Rollover Risk stemming from ALM mismatch is, therefore, lower for Retail-NBFCs.
RISKS FROM INTERCONNECTEDNESS
8.28 Interconnectedness Risk is a measure of the transmission of systemic risk between an NBFC and the LDMF sector that arises from two factors. First, if the LDMF sector, on average, holds concentrated positions in the CPs of a specific stressed NBFC, it may lead to a greater redemption risk from their own investors who fear rise in default probabilities due to deterioration of asset quality of the NBFC. This factor is measured by the LDMF sector’s average exposure to CP issued by the NBFC.
8.29 Second, LDMFs are subject to run risk or redemption risk from their investors if their cash holdings do not account for extreme tail events. Thus, low levels of cash holdings in the LDMF sector, on average, diminish the ability of the LDMF sector to absorb redemption pressures.
8.30 The combined impact of these two factors are referred to as the Interconnectedness Risk, which increases the likelihood of concerted redemption by investors across the entire LDMF sector,
Figure 9: ALM Profile (a) HFC Sector
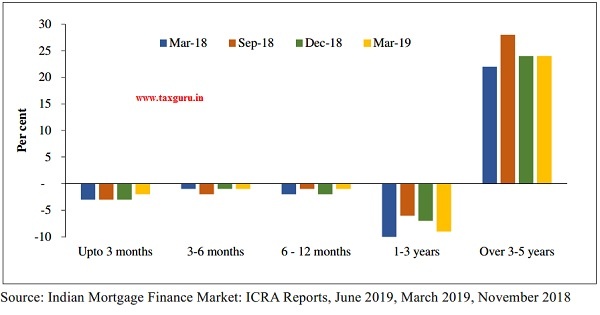
(b) Retail-NBFC Sector
leading to fire sales of LDMF assets. These redemptions increase Rollover Risk in a vicious cycle for the stressed NBFCs.
8.31 To shed light on the first factor driving Interconnectedness Risk, a comparison of the average dependence of the HFC sector and the Retail-NBFC sector on the LDMF sector is provided, as shown in Figure 10. This dependence is measured by the average of the ratio of commercial paper of the specific HFC/Retail-NBFC held by the LDMF sector and the total commercial paper holdings of the LDMF sector in the overall HFC/Retail- NBFC sector. Then the dependence over the HFC/Retail-NBFC sectors is averaged and the figures are tracked from 2014 till 2019.
Figure 10: YoY Average Dependence of HFC/Retail-NBFC Sectors on the LDMF Sector
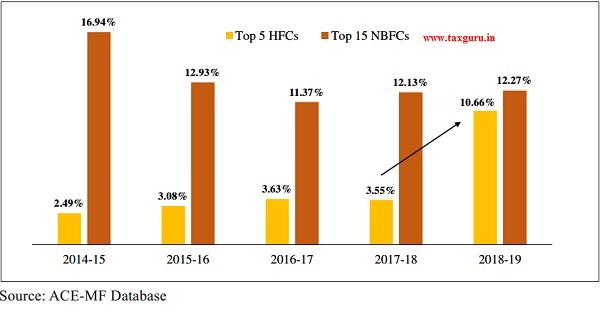
8.32 The average dependence for the HFC sector from March 2014 till March 2019 was 4.68 per cent while the average dependence for the Retail-NBFC sector during the same period was 13.13 per cent. Although the average dependence of HFCs had spiked in financial year 2019, the dependence was lower than that of Retail-NBFCs in 4 out of 5 years in the chapter.
Figure 11: Liquidity Buffer of Top 15 LDMFs (percentage of Assets under Management)
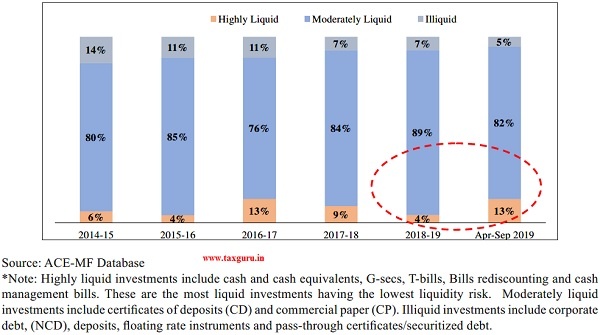
8.33 Turning to the second factor driving Interconnectedness Risk, the asset class wise holdings of the LDMFs in sample from March 2014 till March 2019 is plotted, as shown in Figure 11. The proportion of highly liquid investments such as cash, G-secs etc., is a measure of the Liquidity Buffer in the LDMF sector. Higher the Liquidity Buffer, lower is the redemption risk faced by the LDMFs and by extension the Rollover Risk faced by HFCs/Retail-NBFCs. A steep jump in the average level of highly liquid investments of LDMFs post the IL&FS and DHFL defaults was observed, probably in anticipation of higher than usual redemptions.
Figure 12: Cash (Percentage of Borrowings)

FINANCIAL AND OPERATING RESILIENCE
8.34 Liquidity crunch in debt markets often leads to credit rationing. Credit rationing results when firms with robust financial and operating performance get access to credit while the less robust ones are denied credit. Firms with robust financial and operating performance can withstand a prolonged period of liquidity crunch if they choose not to raise funds from debt mutual funds.
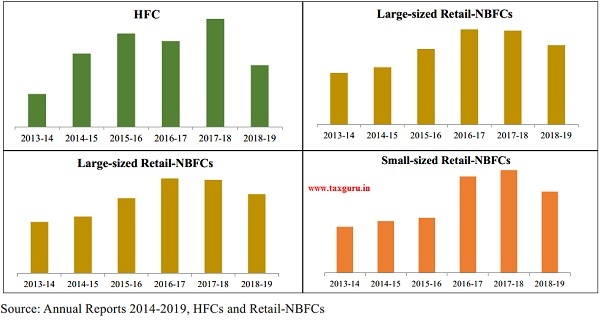
8.35 Measures of financial resilience of NBFCs are commercial paper (CP) as a percentage of borrowings, Capital Adequacy Ratio (CAR) and provisioning policy, while measures of operating resilience are cash as a percentage of borrowings, loan quality and operating expense ratio (Opex Ratio). As an example, the trends in cash as a percentage of borrowings which is a measure of operating resilience for NBFCs is plotted, as shown in Figure 12.
8.36 From 2015-16 onwards, large and medium-sized Retail-NBFCs had lower operating resilience, measured by cash as a percentage of borrowings, as compared to HFCs and small-sized NBFCs.
RELIANCE ON SHORT-TERM WHOLESALE FUNDING
8.37 As pointed out earlier, it is argued that the fundamental factor that influences Rollover Risk can be traced to the overdependence of the NBFC sector on the short-term wholesale funding market. First, greater short-term funding implies a greater exposure to repricing risk (direct channel). Second, both the key drivers of Rollover Risk, ALM Risk and the Interconnectedness Risk increase when short-term funding increases (indirect channel).
8.38 This issue is investigated by comparing the reliance on short-term wholesale funding (CP as a percentage of liabilities) of HFCs and Retail-NBFCs, as shown in Figure 13. It was observed that the average level of commercial paper in sources of funds was 5-6.5 per cent for the HFC sector and large-sized Retail-NBFCs while it was 11.5-12.5 per cent for medium and small-sized Retail-NBFCs. While the HFC sector is less exposed to short-term wholesale funding, one must recognize that given the much longer duration of their assets, a lower 5-6.5 per cent exposure is sufficiently high to influence ALM Risk but not high enough to affect Interconnectedness Risk. In contrast, small and medium Retail-NBFCs have high exposure to short-term wholesale funding which makes Interconnectedness Risk an important driver of Rollover Risk without causing ALM problems. The large Retail-NBFCs are in a better position as their exposure to short-term wholesale funding is low enough to keep both ALM Risk and Interconnectedness Risk within reasonable levels.
Figure 13: Commercial Paper as a percentage of Liabilties
8.39 Hahm, Shin and Shin (2013) have found that legacy banks with more reliance on deposit funding are safer than banks that depend heavily on wholesale funding. Defaults on wholesale funding obligations by NBFCs in September 2018 and more recently in June 2019 exposed the risks of heavy reliance on wholesale funding sources, consistent with the findings of Hahm, Shin and Shin (2013).
ROLLOVER RISK SCHEMATICS OF HFCs/RETAIL-NBFCs
8.40 Figures 14 and 15 provide the modified schematics of the conceptual framework underlying the drivers of Rollover Risk in the HFC and the Retail-NBFC sectors. These schematics highlight the difference in the mechanism through which asset side shocks affect Health Score of HFCs and Retail-
Figure 14: Rollover Risk Schematic (HFCs)
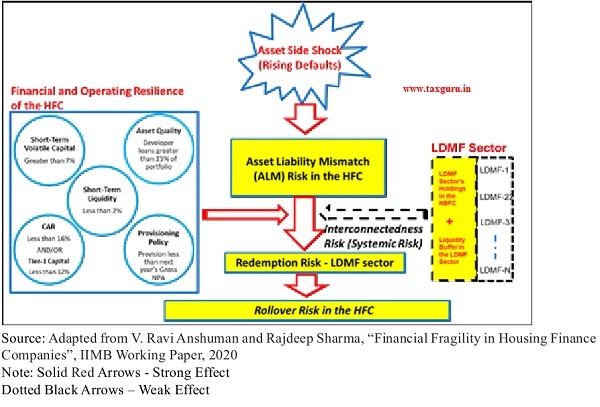
Figure 15: Rollover Risk Schematic (Retail-NBFCs)
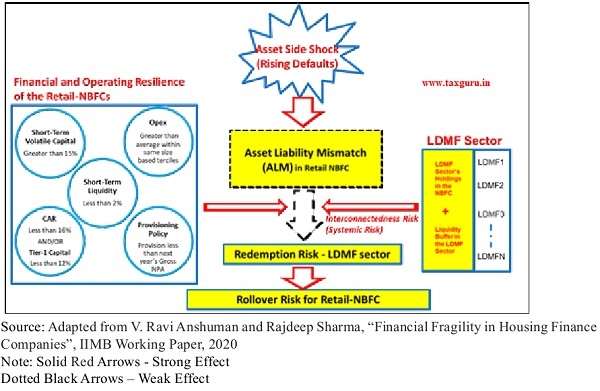
NBFCs, respectively. More specifically, the schematic for the HFC sector highlights the ALM Risk and the Financial and Operating Resilience as strong effects while the Interconnectedness Risk as a weak effect. On the other hand, in the schematic for the Retail-NBFC sector, the ALM Risk, is highlighted as a weak effect, but the Interconnectedness Risk and the Financial and Operating Resilience are strong effects.
DIAGNOSTIC TO ASSESS FINANCIAL FRAGILITY
8.41 In this section, a methodology is developed to estimate a dynamic health index for an individual NBFC (referred to this index as the Health Score). The sample consists of data on HFCs from March 2011 till March 2019 and Retail-NBFCs from March 2014 till March 2019. The fifteen Retail-NBFCs is divided into three equal sized groups based on the size of their loan books as there is significant variation in the size of the loan book among the fifteen firms. This helps to differentiate between the Retail-NBFCs in terms of their Health Scores while controlling for loan book size. There is not much variation in size among the five HFCs in the sample and thus the five HFCs are treated as representative of the HFC sector.
8.42 Overall, it was found that the Health Score for the HFC sector exhibited a declining trend post 2014. By the end of 2018-19, the health of the overall sector had worsened considerably. The Health Score of the Retail-NBFC sector was consistently below par for the period 2014 till 2019. Further, the large Retail-NBFCs had higher Health Scores but among the medium and small Retail-NBFCs, the medium size Retail-NBFCs had a lower Health Score for the entire period from March 2014 till March 2019.
8.43 Finally, the change in Health Score is demonstrated as a significant predictor of future abnormal returns of these stocks/ portfolios. The Health Score, therefore, can serve as a timely indicator of future performance of these firms.
HEALTH SCORE (HFCs)
8.44 Based on the relative contribution to Rollover Risk, the key drivers of Rollover Risk are combined for HFCs into a composite measure (Health Score). ALM Risk and Financial and Operating Resilience are the most important constituents of the Health Score of HFCs, as shown earlier in the Health Score schematic for the HFC sector. As discussed, Interconnectedness Risk was low for the HFC sector and, therefore, not a key driver of Rollover Risk for these firms.
8.45 Metric 1 captures ALM Risk, while Metrics 2-6 capture the Financial and Operating Resilience of HFCs. Metrics 2, 5 and 6 are measures of Financial Resilience and Metrics 3 and 4 are measures of Operating Resilience for the HFCs.
8.46 In Box 2, definitions of each of the metrics is provided, which affect Health Score of HFCs. There may be metrics other than the ones considered here that may explain Health Score of HFCs, but the most important ones are focussed in this chapter. Box 3 provides a short description of the method used to arrive at the Health Score for the HFC sector.
BOX 2: Key Metrics affecting Health Scores of HFCs
Metric 1: ALM Profile – ALM Profile is measured by the difference between assets and liabilities in each cash flow bucket normalized by the total assets of the HFC.
Metric 2: Short-Term Volatile Capital – This is measured by CP as a percentage of borrowings of the HFC.
Metric 3: Asset Quality – This is measured by the ratio of retail loans to the overall loan portfolio of the HFC.
Metric 4: Short-term Liquidity – This is measured by the percentage of cash to the total borrowings of the HFC.
Metric 5: Provisioning Policy – This is measured by the difference between provision for bad loans made in any financial year and the gross non-performing assets (NPA) in the subsequent financial year.
Metric 6: Capital Adequacy Ratio (CAR) – This is the sum of Tier-I and Tier-II capital held by the HFC as a percentage of Risk-Weighted Assets (RWA).
8.47 The Health Score can range from -100 to +100 with higher scores indicating lower Rollover Risk. A Health Score of 0 is a neutral score, not risky, but not too safe either.
A benchmark of 50 is used, above which the individual HFC/Sector may be deemed to be sufficiently safe.
BOX 3: Weighting Scheme to determine the Health Score of HFCs
Weights are assign to each of the six metrics defined in Box 2. The assigned weights are subjective, and the sum of the weights is 100 points. To capture the relative contributions of each of the metrics to Health Score, maximum weight of 50 points is assigned to ALM Risk (Metric 1) and 50 points to Financial and Operating Resilience (Metrics 2-6). The 50 points to Financial and Operating Resilience are further broken down, with 20 points to Metric 2, 10 points each to Metrics 3-4 and 5 points each to Metrics 5-6.
For each of the five HFCs, a Health Score is computed based on Metrics 1-6. The variables defining each metric are compared with pre-defined thresholds, which reflect the level of the variable for an HFC facing average Rollover Risk. The maximum possible score for a metric is the weight assigned to that metric (for example, 50 for ALM Risk).
For computing the Health Score for the HFC sector as of 31st March in any financial year, the AUM (Assets under Management) weighted average of the scores obtained for each of the Metrics 1-6 is computed and added upon. Using this approach, the Health Score is computed at the end of each financial year from March 2011 till March 2019 for the overall HFC sector.
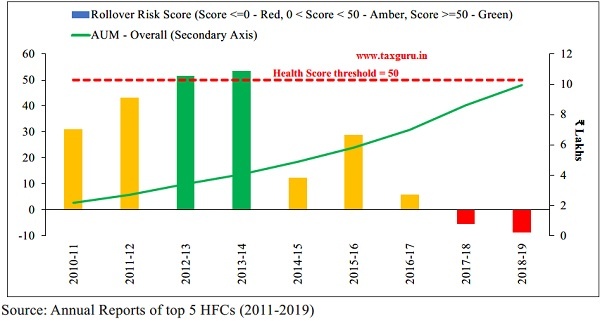
8.48 Figure 16 plots the trends in Health Scores for the HFC sector as of 31st March each year from 2011 till 2019. The start of the decrease in Health Score for the HFC sector followed soon after the real estate sector slowdown in 2013-14. The dynamics of the Health Score for a stressed NBFC have been provided in Figure 3 to illustrate the validity of Health Score. It is evident from figure 3, that the Health Score declined significantly from 2015 onward. However, AUM of the HFC sector continued to increase substantially during this period. Taken together, these trends suggest a build-up of risk that does not bode well for the HFC sector in the future.
Figure 16: Health Score and Portfolio Trends (HFC Sector)
HEALTH SCORE (RETAIL-NBFCs)
8.49 Based on the relative contribution to Rollover Risk, the key drivers ofRollover Risk are combined for Retail-NBFCs’ to compute the Health Score. Interconnectedness Risk between an NBFC and the LDMF sector and Financial and Operating Resilience are the most important constituents of Health Score of Retail-NBFCs, as shown earlier in the Health Score schematic for the Retail-NBFC sector. Interconnectedness Risk arises from both the LDMF sector exposure to CP issued by Retail-NBFCs (Metric 1) and Liquidity Buffer levels in the LDMF Sector (Metric 2). The analysis is also illustrated that ALM Risk was low for the Retail-NBFC sector and, therefore, not a key driver of Rollover Risk for these firms.
8.50 Metrics 1 and 2 capture the Interconnectedness Risk and Metrics 3-7 capture the Financial and Operating Resilience of Retail-NBFCs. Metrics 3, 6 and 7 are measures of Financial Resilience while Metrics 4 and 5 are measures of Operating Resilience for the HFCs. Together, they reflect the Financial and Operating Resilience of Retail-NBFCs.
BOX 4: Key Metrics affecting Health Scores of Retail-NBFCs
Metric 1: LDMF sector exposure to CP issued by Retail-NBFCs – This is measured by the average of the ratio of commercial paper of the specific HFC/Retail-NBFC held by the LDMF sector and the total commercial paper holdings of the LDMF sector in the overall HFC/Retail-NBFC sector.
Metric 2: Liquidity Buffer levels in the LDMF Sector – This is measured by the average proportion of highly liquid investments such as cash, G-secs etc., that are held by the LDMFs.
Metric 3: Short-Term Volatile Capital – This is measured by CP as a percentage of borrowings of the Retail-NBFC.
Metric 4: Operating Expense Ratio (Opex Ratio) – This is measured by the operating expenses in a financial year divided by the average of the loans outstanding in the current financial year end and previous financial year end. Opex Ratio is an indicator of efficiency of a Retail-NBFC.
Metric 5: Short-term Liquidity – This is measured by the percentage of cash to the total borrowings of the Retail-NBFC.
Metric 6: Provisioning Policy – This is measured by the difference between provision for bad loans made in any financial year and the gross non-performing assets (NPA) in the subsequent financial year.
Metric 7: Capital Adequacy Ratio (CAR) – This is the sum of Tier-I and Tier-II capital held by the Retail-NBFC as a percentage of Risk-Weighted Assets (RWA).
BOX 5: Weighting Scheme to determine the Health Score of Retail-NBFCs
Weights are assigned to each of the seven metrics defined in Box 4. The assigned weights are subjective, and the sum of the weights is 100 points. To capture the relative contributions of each of the metrics to Health Score, 50 points to Interconnectedness Risk (25 points each to Metrics 1 and 2) and 50 points to Financial and Operating Resilience (Metrics 3-7). The 50 points to Financial and Operating Resilience are further broken down, with 20 points to Metric 3, 10 points each to Metrics 4-5 and 5 points each to Metrics 6-7.
For each of the fifteen Retail-NBFCs, the Health Score is computed based on the scores of Metrics 1-7. The variables defining each metric are compared with pre-defined thresholds, which reflect the level of the variable for a Retail-NBFC that is facing average Rollover Risk.
The maximum possible score for a metric is the weight assigned to that metric (for example, 50 for Interconnectedness Risk). The sum of the scores obtained for all seven metrics for a Retail-NBFC is its Health Score. The Health Score is computed in each of the financial years from 2014-15 till 2018-19 for each of the fifteen Retail-NBFCs’ in the sample. Although some of the metrics for Retail-NBFCs and HFCs are same, the thresholds for these common metrics differ. In this way, different nature of assets and liabilities of HFCs and Retail-NBFCs is accounted in the Health Score computation.
8.51 In Box 4, definitions of each of the metrics is provided which affect Health Score of Retail-NBFCs. There may be metrics other than the ones considered here that may explain Rollover Risk of Retail-NBFCs, but the chapter tried to capture the most important ones in this chapter. Box 5 provides a brief description of the method used to arrive at the Health Score for the Retail-NBFC sector.
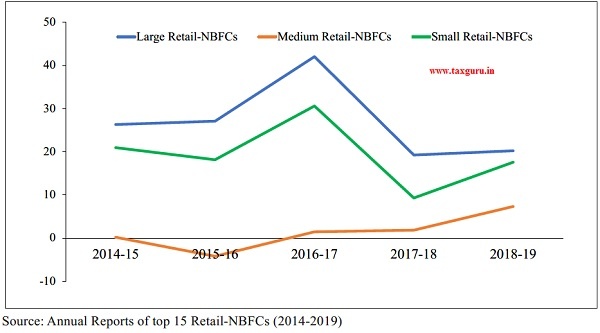
8.52 The sample of fifteen Retail-NBFCs’ is divided into three equal sized groups based on the loan book size to examine Health Scores within each sub-class of Retail-NBFCs. For each group, the average Health Score of the five firms within the group is computed. As in the case of HFCs, the Health Score of Retail-NBFCs can range from -100 to +100 with higher scores indicating lower Rollover Risk. A Health Score of 0 is a neutral score, not risky, but not too safe either. A benchmark of 50 is used, above which the individual Retail-NBFC/Sector may be deemed to be sufficiently safe. Figure 17 plots the trends in average Heath Score for the three size-based groups of Retail-NBFCs. Among the three size-based groups, it was observed that medium-sized Retail-NBFCs had low Health Score almost throughout the period. The Health Score of large-sized Retail-NBFCs started declining post 2016-17.
8.53 Figure 17 shows that size is not always inversely related to Rollover Risk exposure. Throughout the period, it was evident that, on average, smaller sized Retail-NBFC had higher Health Scores than the medium-sized ones. Hence, targetting liquidity enhancements based on size, would be a sub-optimal capital allocation strategy.
Figure 17: Average Health Scores (Retail-NBFCs)
PREDICTIVE POWER OF HEALTH SCORE
Housing Finance Companies (HFCs)
8.54 In this section, an attempt is made to understand whether the year-over-year (YoY) change in Health Score of individual HFCs has any predictive power on future abnormal stock returns of these firms. This test is useful in validating the Health Score as an early warning signal. The annual reports for each financial year are generally released in the period from July to August each year. The dates of release, however, vary for each of the HFCs. Information in the annual reports that provide insights on the Health Score of the HFC should gradually reflect in the share price over horizon of a few months as the information is absorbed by active traders. If the Health Score is a forward-looking measure of the prospects of the HFCs, the YoY change in Health Score should explain future abnormal returns of their stocks.
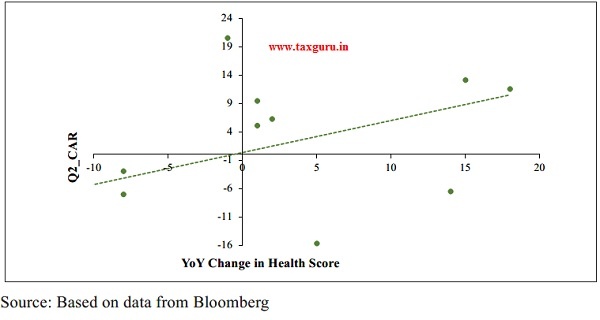
8.55 Given the uncertainty on the date of release of annual reports of the HFC and the time required for the information to be reflected in future stock price movements/ returns of these firms, the price effect is estimated using the cumultaive return of an NBFC’s stock from July to September (Q2) of each year from 2011 till 2018. The contemporaneous NIFTY 500 index returns is subtracted to compute the abnormal returns on a weekly basis. The cumulative abnormal return (Q2_CAR) is calculated by adding the weekly abnormal returns every week from July to September (~ 12 weeks in a year).
8.56 Q2_CAR is calculated in this way for all the five HFCs for each year from 20112018. Based on the year of listing of the five HFCs’in the sample, a set of 32 Q2_CAR values are obtained and the corresponding Health Scores of individual HFCs.
8.57 Figure 18 shows a scatter plot of Q2_ CAR and YoY Change in Health Scores of the HFC sector in the sample. The positively sloped trend line in the scatter plot confirms the ex-ante expectation that an improvement in the YoY Health Score should result in an increase in future short-term cumulative abnormal returns of the HFC stocks.
Figure 18: Cumulative Abnormal Returns (Q2_CAR) vs YoY Change in Health Score (HFCs)

RETAIL-NBFCs
8.58 In this section an attempt is made to understand whether the year-over-year (YoY) change in Health Score of individual Retail-NBFCs has any predictive power on future abnormal stock returns of these firms. Q2_CAR for the fifteen Retail-NBFCs is computed in exactly the same way as done for HFCs (illustrated in sub-section 4.3.1) for each year from 2015-2019.
8.59 A set of Q2_CAR values and corresponding Health Scores for each of the fifteen Retail-NBFCs is obtained. The fifteen Retail-NBFCs are classified into three terciles comprising of large, medium and small NBFCs. An equally weighted portfolio of size-based NBFC stocks is constructed and the Q2_CAR is computed for the three size-based portfolios for each of the years from 2015 till 2019. Corresponding to each Q2_CAR value for the three portfolios, the average Health Score is computed of the constituent set of Retail-NBFCs.
8.60 Figure 19 shows a scatter plot of Q2_ CAR and YoY Change in Health Scores of the three size-based portfolios. The positively sloped trend line in the scatter plot confirms the ex-ante expectation that an improvement in the YoY Health Score should result in an increase in future short-term cumulative abnormal returns of the three portfolios.
Figure 19: Cumulative Abnormal Returns (Q2_CAR) vs YoY Change in Health Score (Retail-NBFCs)
POLICY IMPLICATIONS
8.61 The above analysis suggests that firms in the NBFC sector are susceptible to rollover risk when they rely too much on the on the short-term wholesale funding market for financing their investments in the real sector. The following policy initiatives can be employed to arrest financial fragility in the shadow banking system:
(i) Regulators can employ the Health Score methodology presented in this analysis to detect early warning signals of impending rollover risk problems in individual NBFCs. Downtrends in the Health Score can be used to trigger greater monitoring of an NBFC. Furthermore, an analysis of the trends in the components of the Health Score can shed light on the appropriate corrective measures that should be applied to reverse the adverse trends.
(ii) When faced with a dire liquidity crunch situation, as experienced recently, regulators can use the Health Score as a basis for optimally directing capital infusions to deserving NBFCs to ensure efficient allocation of scarce capital.
(iii) The above analysis can also be used to set prudential thresholds on the extent of wholesale funding that can be permitted for firms in the shadow banking system. Such a norm would be consistent with macro prudential regulations that are required to internalize the systemic risk concerns arising due to an individual NBFC’s financing strategy. These norms could be countercyclically adjusted because the seeds of a liquidity crunch are sown during good times.
CHAPTER AT A GLANCE
> Motivated by the current liquidity crunch the NBFC sector, this chapter investigates the key drivers of Rollover Risk of the shadow banking system in India.
> The over-dependence on short-term wholesale funding exacerbates Rollover Risk.> The key drivers of Rollover Risk are: ALM Risk, Interconnectedness Risk and Financial and Operating Resilience of an NBFC.
> Using a novel scoring methodology, Rollover Risk is quantified for a sample of HFCs and Retail-NBFCs (which are representative of their respective sectors) and thereby compute a diagnostic (Health Score).
> The Health Score for the HFC sector exhibited a declining trend post 2014. By the end of FY2019, the health of the overall sector had worsened considerably.
> The Health Score of the Retail-NBFC sector was consistently below par for the period 2014 till 2019.
> Larger Retail-NBFCs had higher Health Scores but among medium and small Retail- NBFCs, the medium size ones had a lower Health Score for the entire period from March 2014 till March 2019.
> The above findings suggest that the Health Score provides an early warning signal of impending liquidity problems.
The analysis find significant evidence that equity markets react favourably to increase in Health Score of individual HFCs and Retail-NBFCs, thereby confirming the validity of Health Score as an early warning signal.
> Thus, the analysis provides a dynamic leading indicator of the financial health of firms in the NBFC sector, after incorporating the macroprudential externalities of their investment and financing decisions.
> Policy makers intending to revive the shadow banking channel of growth can use this analysis to efficiently allocate liquidity enhancements across firms (with different Health Scores) in the NBFC sector, thereby arresting financial fragility in a capital-efficient manner.
REFERENCES
“Chernenko, S., and Sunderam A., ‘Frictions in Shadow Banking: Evidence from the Lending Behavior of Money Market Mutual Funds’, The Review of Financial Studies, 2014,”
“Hahm, Shin and Shin, ‘Non-Core Bank Liabilities and Financial Vulnerability’, Journal of Money, Credit and Banking, 2013,”
“Acharya V.V., Khandwala H., and Oncu T.S., ‘The Growth of a Shadow Banking System in Emerging Markets: Evidence from India’, Journal of International Money and Finance, 2013,”
“Ghosh, S., Del Mazo I.G., and Inci O. R., ‘Chasing the Shadows: How Significant Is Shadow Banking in Emerging Markets?’, Economic Premise, Washington, World Bank, 2013,”
“M.T Kusy and W.T Ziemba, ‘A Bank Asset and Liability Model’, Working Paper, 1983,”
“S. Bokhari, D. Geltner and A. Minne, ‘A Bayesian Structural Time Series Approach to Constructing Rent Indexes: An Application to Indian Office Markets’, Working Paper, 2017,”
V. Ravi Anshuman and Rajdeep Sharma, “Financial Fragility in Housing Finance Companies”, IIMB Working Paper, 2020
V. Ravi Anshuman and Rajdeep Sharma, “Financial Fragility in Retail-NBFCs”, IIMB Working Paper, 2020
Notes:
1 Economic Times article titled “DHFL Paper Sale by DSP triggered panic” dated 22nd September 2018.Notes:
2 NewsClick article titled “Mutual Funds in Trouble as Housing Finance Firm DHFL Defaults on Debt Repayment” dated 6th June 2019.
3 LiveMint article titled “Debt Mutual Funds: Quantum of Loss and Solace” dated 29th April 2019.
4 For one of the largest HFCs, the rate of interest on CP was 7.01% – 8.00% while that on NCD was 10.01 – 11.95%, as of 31 March 2019.
5 The share of CP issued by NBFCs that are subscribed to by mutual funds was the highest (79.7% as of 31 March 2019) among all classes of subscribers (Retail-NBFC Credit Trends: ICRA Report, July 2019). Among mutual funds, LDMFs have the highest share of investments in CP (~80% on average), which is highlighted in Figure 11, sub-section 3.2. Together, these two facts suggest that the LDMF sector is a primary source of short-term wholesale funds in the NBFC sector.


