All through organized history, if you wanted prosperity you had to have cities. Cities are places that attract new people with new ideas.
– Jane Jacobs, author of “Cities and the Wealth of Nations”
Everyone wants decentralisation, but only until his level.
– Quote attributed to Professor Raja Chelliah
New analysis of recent data for 21 Indian cities suggests a strong correlation between the capacities–resource and people–of urban local bodies (ULBs) and their service delivery. ULBs could clearly raise more resources even allowing for constraints that straitjacket them. Technology, especially satellite imagery, can play an important role. Empowering cities will be critical but the political economy challenges from state governments are considerable, raising interesting questions for Finance Commissions. It may well be that a few successful models will provide the impetus for wider change. Cities, like states, must compete with each other to unleash dynamism. To competitive federalism India must add competitive sub-federalism.
I. INTRODUCTION
14.1 The great and perceptive documenter of cities, Jane Jacobs, argued that cities are complex, organic, humming entities that tend to defy the attempts of planners and architects to impose order. But that should not lead to fatalistic inaction because for India, urbanisation is rapidly on the rise. As recently as 1991, there were only 220 million Indians living in cities, equivalent to about one-quarter of the population. By 2011, there were no less than 380 million, living in around 8,000 cities/towns1, at least 53 of which were home to over 1 million people. Urban Indians now form about one-third of the population – and they produce more than three-fifths of the country’s GDP.
14.2 By all accounts, urbanisation will define the trajectory of Indian development. The exodus of rural Indians into the cities over the coming decades will pose tremendous challenges for government, particularly the municipalities who will be primarily responsible for providing the services that the new migrants – and established residents – will need. Success in overcoming these challenges will be vital if the nation is to seize the opportunities that migration to the centres of economic activity can create. But how have Indian Urban Local Bodies (ULBs) performed and what are the tools needed for them to succeed? This chapter attempts a preliminary assessment.
14.3 What is clear is this: just as with competition between states is becoming a powerful dynamic of change and progress, that dynamic must extend to competition between states and cities, and between cities. Cities that are entrusted with responsibilities, empowered with resources, and encumbered by accountability can become effective vehicles for unleashing dynamism so that to competitive federalism India can add, and rely on, competitive sub-federalism.
II. BACKGROUND
14.4 Contrary to perception, India’s urbanisation rate appears to have been similar to that in other countries. Figure 1 plots the latest urbanisation rate against per capita GDP for a group of emerging and developing countries. India is not far away from the average positive relationship. Similarly the evolution of the urbanisation rate for India is also not unusual. Figure 2 plots the urbanisation rate for three countries at different levels of per capita GDP. It can be seen that countries have followed a pattern of urbanisation where the level of urbanisation has increased with the per capita GDP. Therefore a large part of the difference in the levels of urbanisation seen between India and China can be mainly attributed to the different levels of development of each country. Contrary to perception, India and China have had very similar trends of urbanisation.
14.5 If the magnitude of Indian urbanisation is not special, the patterns of urban size seem to be, in the sense of not adhering to Zipf’s Law. The law claims that the city with the largest population in any country is generally twice as large as the next-biggest; three times the size of the third biggest, and so on. In other words, the nth ranked city would be 1/nth the size of the largest city. This has been shown to hold true for many countries but not so for India.
14.6 A plot between the logarithms of city rank and city population illustrates the point. Figures 3a to 3c present plots for the United States, Brazil and India, along the lines set out by Chauvin et. al. (2016). For countries where Zipf’s Law holds, the plot should be a straight line with a slope coefficient of -1. The results for the US and Brazil are indeed close to this Law, as their coefficients are -1.4 and -1.28, respectively, with an R2 around
Figure 1. Per capita GDP and Urbanisation (2015)
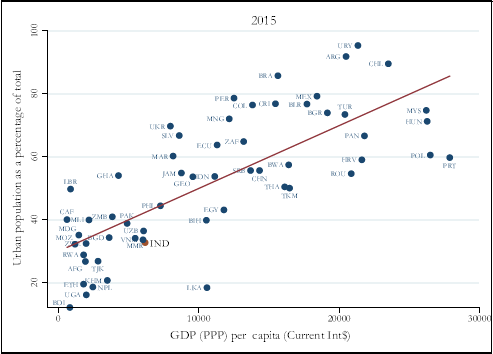
Source: World Development Indicators and United Nations, Department of Economic and Social Affairs, Population Division (2014). World Urbanisation Prospects: The 2014 Revision.
Figure 2. Per capita GDP and Urbanisation
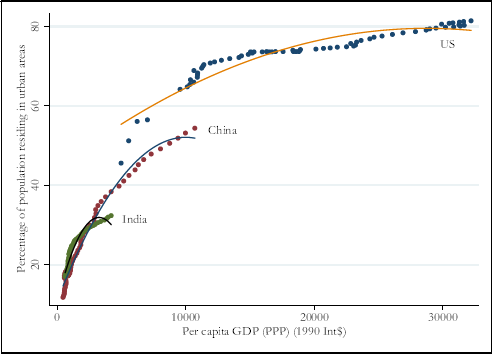
Source: Maddison Project database, Penn World Tables and United Nations, Department of Economic and Social Affairs, Population Division (2014). World Urbanisation Prospects: The 2014 Revision.
Figure 3 . Zipf’s Law: City/UA population and city/UA population ranks
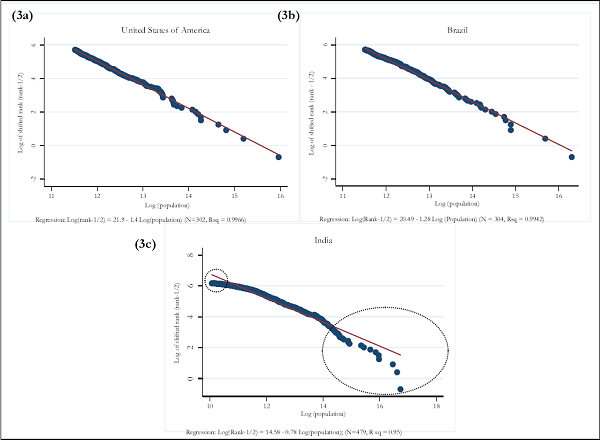
Source: (Figure 3a to 3c): Urban Agglomeration (UA) population for India from Census 2011, City population for US and Brazil from United Nations Statistics Division, Demographic Yearbook 2015.
0.99 in both cases. But the plot for India is concave, with a slope coefficient of -0.78 and an R2 of 0.95. This implies that many of the smaller cities are unusually small (they lie below the line of best fit in Figure 3c). And contrary to what one might think, so are the bigger ones.
14.7 There are many reasons why the large cities are unusually small. One explanation might be that their infrastructure is overburdened. Another is that India is land-scarce relative to most countries, discouraging migration particularly because distorted land markets render rents unaffordable. By 2050, its land-to-population ratio will have declined fourfold relative to 1960, and India will be amongst the most land-scarce countries in the world (Kapur et. al., 2014). Further mobility in India is limited by strong place-based preferences embedded in deep social networks in India (Chauvin et. al., 2016).
14.8 In the coming years, these anomalies are likely to be rectified. That is, India’s urbanisation rate should begin to converge with those in similar emerging markets, rising to 40 per cent by 2030. And much of this urban growth is likely to take place in the bigger cities, possibly bringing the country in line with Zipf’s Law. This will create opportunities – and risks.
III. KEY CHALLENGES
14.9 The primary responsibility for development of urban areas lies with the state governments and the municipal corporations, municipalities and nagar pan chayats, commonly known as urban local bodies (ULBs). These levels of government face major and inextricably linked problems: poor governance capacities, large infrastructure deficits and inadequate finances.
14.10 ULBs face a governance challenge. Cities do not have a single city government or a local self-government, leading to functional overlap. There is a significant fragmentation of responsibilities and service delivery across a gamut of institutions: the municipality, state departments (Police, PWD, Health, Education, Housing), and parastatal agencies or civic agencies reporting directly to the state government. There are also transparency/ accountability issues, as even the most basic information on ULBs finances and quality of basic services is lacking in many cities, in part because implementation of the e- Governance initiative has also not been uniform.
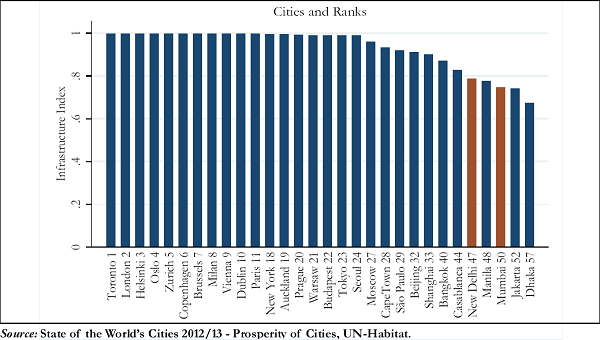
14.11 The second challenge is the infrastructure deficit. Productive and healthy urbanisation requires efficient public services delivery. But every Indian city faces serious challenges related to water and power supply, waste management, public transport, education, healthcare, safety, and pollution. To take just one example, the report based on the WHO/UNICEF Joint Monitoring Programme (2015 report and MDG Assessment) on access to sanitation shows that as against the Millennium Development Goal (MDG) target of 77 per cent, India has managed to provide access to only 63 per cent of the population by 2015. As per the ranking of global cities based on urban infrastructure (State of World Cities 201 2/13), New Delhi and Mumbai are placed at 47th and 50th positions, respectively (Figure 4), showing comparatively lower levels of infrastructure in these cities.
14.12 According to the High Powered Expert Committee (HPEC) appointed by the Ministry of Urban Development (MoUD), about $ 39 lakh crore (at 2009-10 prices) was required for creation of urban infrastructure over the next 20 years. Out of this total, about $ 17 lakh crore (44 per cent) was needed for roads and $ 8 lakh crore (20 per cent) for services such as water supply, sewerage, solid waste management and storm water
Figure 4. Ranking of select cities as per Infrastructure Index
drains. In addition to these investments, the requirement for operation and maintenance (O&M) was separately estimated to be $ 20 lakh crore.
14.13 Addressing this infrastructure deficit will require resources, some of which could come from the Centre and the states. The Fourteenth Finance Commission (FFC) has recommended a grant of around $ 87,000 crore to the municipalities for the period 2015-20, constituting assistance of around $ 500 per capita per annum on average.
14.14 The rest of the required funds would have to come from local resources. But raising sufficient resources has not proved easy. The 74th Constitutional Amendment Act of 1992 provides for the ULBs as the third tier of government and ‛recommends’ that state governments assign them a set of 18 functions under the Twelfth Schedule. The amendment, however, leaves it to the discretion of state legislatures to devolve finances so that ULBs can fulfil these functions. Twenty-five years on, there are glaring inter-state disparities in terms of devolution of functional and financial powers to the ULBs. Some states have not even allowed the municipalities to levy property taxes.
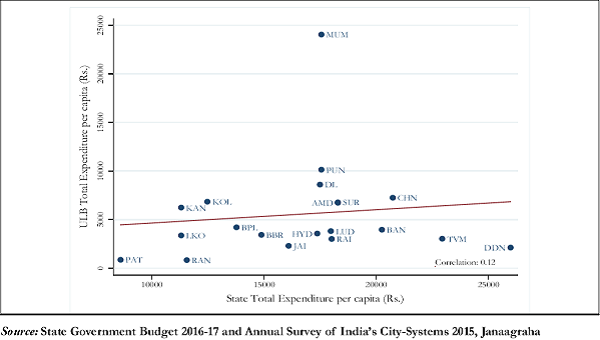
14.15 Figure 5 shows the problem this has created. In principle, one would expect a clear relationship between expenditures of state governments and local bodies. If their respective roles were well-defined, both types of spending would rise together as incomes increased; if their roles were changing, spending would be inversely related, as one level of government substitutes for the other in providing services to the population. The figure shows that neither relationship really holds. There is much greater variation across states than across cities in expenditure per capita. What is most striking is the low level of ULB per capita expenditure as compared to state per capita expenditure, with a few exceptions such as Mumbai, Kanpur, and Kolkata. Either states are not devolving adequate financial resources to ULBs or ULBs are not raising these resources on their own.
Figure 5. State per capita expenditure and ULB per capita expenditure
14.16 Moreover, even when powers have been devolved, exercising them has proved difficult. Municipal own income comes from taxes; user fees; and domestic borrowing:
- While property tax is the most important constituent of own revenues, there are problems of low coverage, low rates, low collection efficiency, and lack of indexation of property values, making it a non-buoyant source of revenue. The study on municipal finances conducted by the FFC indicated that per capita revenue from property taxes was $ 1677 at most, with a low of just $ 42.
- ULBs by and large have not been able to levy adequate user charges to cover even the operation and maintenance costs.
- Issuing municipal bonds has been challenging owing to the poor state of ULB finances and governance.