1. Indians on The Move
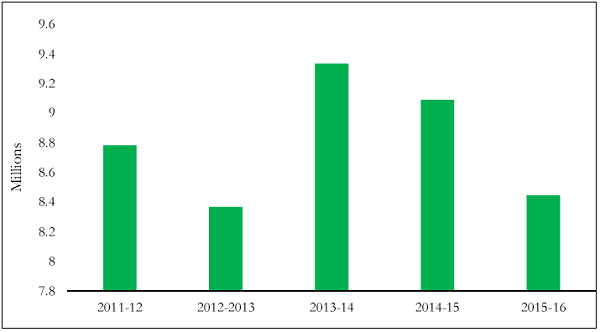
New estimates based on railway passenger traffic data reveal annual work-related migration of about 9 million people, almost double what the 2011 Census suggests.
Annual New Migrants (in millions)
2. Biases in Perception
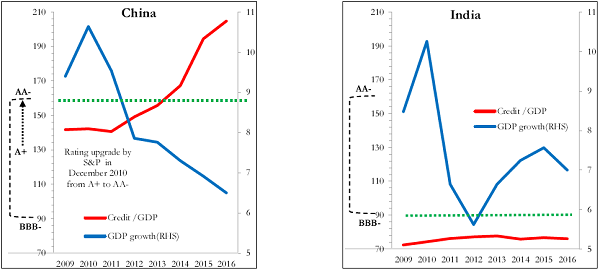
China’s credit rating was upgraded from A+ to AA- in December 2010 while India’s has re-mained unchanged at BBB-. From 2009 to 2015, China’s credit-to-GDP soared from about 142 percent to 205 percent and its growth decelerated. The contrast with India’s indicators is striking.
Poor Standards: Ratings Agencies – China and India
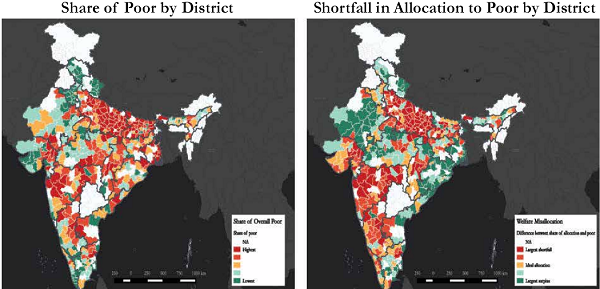
3. New Evidence on Weak Targeting of Social Programs
Welfare spending in India suffers from misallocation: as the pair of charts show, the districts with the most poor (in red on the left) are the ones that suffer from the greatest shortfall of funds (in red on the right) in social programs. The districts accounting for the poorest 40% receive 29% of the total funding.
4. Political Democracy but Fiscal Democracy?
India has 7 taxpayers for every 100 voters ranking us 13th amongst 18 of our democratic G-20 peers.
Taxpayers per 100 Voters
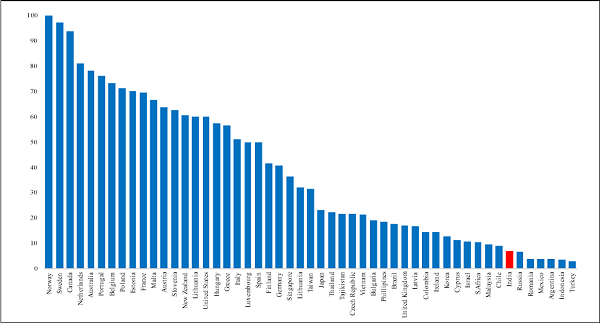
5. India’s Distinctive Demographic Dividend
India’s share of working age to non-working age population will peak later and at a lower level than that for other countries but last longer. The peak of the growth boost due to the demographic dividend is fast approaching, with peninsular states peaking soon and the hinterland states peaking much later.
Demographic Dividend in Indian States and Other Emerging Economies
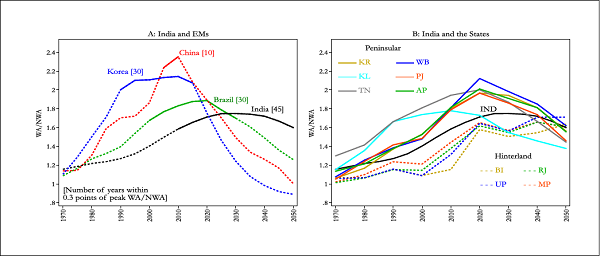
6. India Trades More Than China and a Lot Within Itself
As of 2011, India’s openness – measured as the ratio of trade in goods and services to GDP has far overtaken China’s, a country famed for using trade as an engine of growth. India’s internal trade to GDP is also comparable to that of other large countries and very different from the caricature of a barrier-riddled economy.
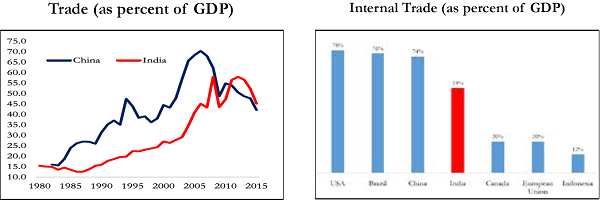
7. Divergence within India, Big Time
Spatial dispersion in income is still rising in India in the last decade (2004-14), unlike the rest of the world and even China. That is, despite more porous borders within India than between countries internationally, the forces of “convergence” have been elusive.
Unconditional Convergence in GDP per capita
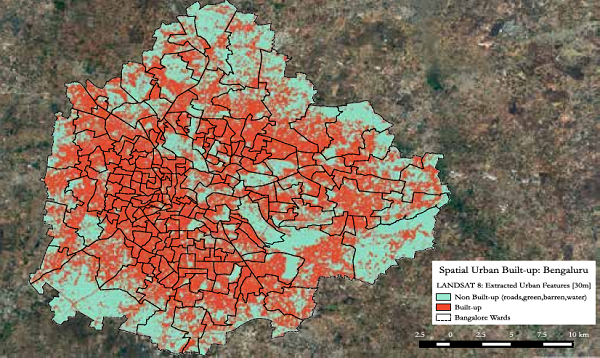
8. Property Tax Potential Unexploited
Evidence from satellite data indicates that Bengaluru and Jaipur collect only between 5% to 20% of their potential property taxes.
Spatial Urban Built-Up Extent: Bengaluru