On 8th February 2024, the Ministry of Finance, Government of India, unveiled a comprehensive White Paper on the Indian Economy, marking a significant milestone in the country’s economic discourse. This document, rich in data and analysis, is designed to serve multiple purposes: it is a report card on past and current economic performance, a manifesto of ongoing policies, and a vision statement for the future trajectory of the Indian economy. In a world still grappling with the aftereffects of the COVID-19 pandemic, geopolitical tensions, and the urgent need for sustainable development, this White Paper is timely, providing insights into India’s strategy to navigate these challenges and seize the opportunities of a rapidly changing global landscape.
Macroeconomic Stability
A cornerstone of the White Paper is its focus on India’s macroeconomic stability. Amidst global economic fluctuations, India has emerged as a beacon of stability, characterized by strong growth rates, controlled inflation, and a robust balance of payments situation. This section of the document meticulously details the government’s balanced approach towards fiscal management, emphasizing the dual objectives of stimulating growth through public investment and maintaining fiscal prudence to ensure long-term sustainability.
The resilience of the Indian economy is attributed to a series of reforms aimed at enhancing fiscal responsibility, including the implementation of a targeted fiscal deficit roadmap and the establishment of the Monetary Policy Committee (MPC) to anchor inflation expectations. The White Paper proudly notes the achievement of a declining trend in the fiscal deficit as a percentage of GDP, while highlighting the increase in capital expenditure to fuel infrastructure-led growth.
Structural Reforms
The narrative on structural reforms outlines a transformative agenda that has been instrumental in reshaping the Indian economic landscape. The White Paper delves into the specifics of landmark reforms such as the Goods and Services Tax (GST), which unified the country into a single market, the Insolvency and Bankruptcy Code (IBC) that redefined corporate distress resolution, and a series of labor and agricultural reforms aimed at enhancing productivity and efficiency.
This section also examines the liberalization of the FDI regime, facilitating a surge in foreign investments across sectors. Through detailed analysis, the document showcases how these reforms have not only improved India’s position on global indices like the Ease of Doing Business but also fostered a more competitive and vibrant economic environment conducive to growth and innovation.

Digital Transformation
Digital transformation is heralded as a game-changer for the Indian economy, with the White Paper elaborating on the government’s initiatives to harness technology for economic development. It highlights the success of the digital payments revolution, underpinned by the Unified Payments Interface (UPI), which has democratized access to financial services and catalyzed a shift towards a cashless economy.
Further, the document discusses the role of fintech in bridging the gap between traditional banking services and the unbanked population, thus enhancing financial inclusion. The digitization of government services, through platforms like the Digital India initiative, has streamlined processes, reduced corruption, and made public services more accessible to citizens. The White Paper posits that digital infrastructure is now as crucial as physical infrastructure for economic development, underscoring the government’s commitment to investing in and expanding digital services across the country.
Sustainability and Green Growth
Sustainability forms a pivotal theme of the White Paper, reflecting India’s commitment to aligning economic growth with environmental preservation. The document outlines India’s strategies for transitioning towards renewable energy, with ambitious targets for solar and wind energy capacity. It also highlights investments in sustainable urban infrastructure, water conservation, and waste management systems as part of a broader green growth strategy.
The White Paper emphasizes India’s active participation in international climate agreements and its role in global environmental governance. Through case studies and policy analysis, it illustrates the potential for green technologies to not only mitigate environmental challenges but also open up new avenues for economic growth and job creation.
Future Roadmap
Looking towards the future, the White Paper articulates a vision for India’s economic growth that is inclusive, sustainable, and resilient. It identifies key areas for action, including enhancing the manufacturing sector’s contribution to GDP, boosting exports, and fostering a culture of innovation and entrepreneurship.
The document underscores the importance of investing in human capital, through reforms in education and healthcare, to harness India’s demographic dividend. It also points to the need for further reforms in governance and regulatory frameworks to create a more business-friendly environment that can attract investment and spur economic activity.
Conclusion
The White Paper on the Indian Economy is a testament to the government’s strategic thinking and policy direction aimed at navigating the complexities of contemporary economic challenges while laying the groundwork for future prosperity. It provides a detailed analysis of the Indian economy’s current state, the effectiveness of policies implemented, and the challenges and opportunities that lie ahead.
As India aspires to become a $5 trillion economy, this document serves as a blueprint for the path forward, emphasizing the importance of macroeconomic stability, structural reforms, digital transformation, and sustainability. The White Paper is not just a reflection on the economy but a vision document that aims to mobilize the collective efforts of policymakers, businesses, and citizens towards achieving sustainable and inclusive growth. As such, it is a critical resource for anyone seeking to understand or engage with the Indian economic landscape in these dynamic times.
*****
GOVERNMENT OF INDIA
MINISTRY OF FINANCE
White Paper on the Indian Economy
AN OVERVIEW
In 2014 when we formed the government, the economy was in a fragile state; public finances were in bad shape; there was economic mismanagement and financial indiscipline, and there was widespread corruption. It was a crisis situation. The responsibility to mend the economy step by step and to put the governance systems in order was enormous. Our government refrained from bringing out a white paper on the poor state of affairs then. That would have given a negative narrative and shaken the confidence of all, including investors. The need of the hour was to give hope to the people, to attract investments, both domestic and global and to build support for the much-needed reforms. The government believed in ‘nation-first’ and not in scoring political points. Now that we have stabilised the economy and set it on a recovery and growth path, it is necessary to place in the public domain the seemingly insurmountable challenges – left behind as a legacy by the UPA Government. “Every challenge of the pre-2014 era was overcome through our economic management and our governance. These have placed the country on a resolute path of sustained high growth. This has been possible through our right policies, true intentions, and appropriate decisions.”1
The objectives of the “White Paper”
- First, it seeks to apprise the Hon’ble Members of the Parliament and the people of India, of the nature and extent of governance, economic and fiscal crises that were bequeathed on this government when it assumed office in 2014.
- Second, it informs the Honourable Members of the Parliament and the public about the policies and measures that our government took to restore the health of the economy and make it vigorous and capable of fulfilling the growth aspirations of the people in the present and in the Amrit Kaal.
- Third, in doing so, it hopes to generate a wider, more informed debate on the paramountcy of national interest and fiscal responsibility in matters of governance over political expediency.
- Fourth, “to commit ourselves to national development, with new inspirations, new consciousness, new resolutions, as the country opens up immense possibilities and ”2
The white paper uses the term “U PA Government” for the government led by Dr. Manmohan Singh elected to office in 2004, and “our Government” for the NDA Government led by Shri Narendra Modi, elected to office in 2014.
In Part 1, the macroeconomic situation of India under the UPA government is discussed, where double-digit inflation, ailing banking sector following excessive lending during the boom phase, and high policy uncertainty marred India’s business climate, dented its image and the people’s confidence about their future, despite the Vajpayee-led NDA government having handed over a healthy and resilient economy with high growth potential in 2004. The part also discusses the mismanagement and short-sighted handling of the public finances during FY04-FY143. There were numerous scams bringing colossal revenue losses for the exchequer and fiscal and revenue deficits spiralling out of control. In 2014, our government inherited a deeply damaged economy whose foundations had to be rebuilt to enable self-sustaining long-term economic growth.
Part 2 gives current status of the various corruption scams of the UPA government.
Part 3 shows how we turned the economy around, rebuilt the country’s image and rekindled people’s hopes and aspirations for a better future. Now, the nation marches ahead with self-confidence and self-belief.
PART 1: The Economy in 2014 – An Inheritance of Loss
From a healthy economy in 2004 to a stagnant economy in 2014
1. The UPA Government inherited a healthy economy ready for more reforms, but made it non-performing in its ten years. In 2004, when the UPA government began its term, the economy was growing at 8 per cent (with industry and services sector growth above 7 per cent each and a resuscitating agriculture sector growth above 9 per cent in FY04) amidst a benign world economic environment. The Economic Survey of 2003-04 noted,
“The economy appears to be in a resilient mode in terms of growth, inflation, and balance of payments, a combination that offers large scope for consolidation of the growth momentum with continued macroeconomic stability.“4
2. Ironically, the UPA leadership, which seldom fails to take credit for the 1991 reforms, abandoned them after coming to power in 2004. Even as the country was standing at the cusp of emerging as a powerful economy, little was done by the UPA government to build upon the strong foundation laid by the previous NDA government. In the years between 2004 and 2008, the economy grew fast, thanks to the lagged effects of the reforms of the NDA government and favourable global conditions. The UPA government took credit for the high growth but did little to consolidate it. The failure to take advantage of the years of high growth to strengthen the budget position of the government and invest in infrastructure to boost future growth prospects stood exposed. As aptly put by a noted economist,
“The high growth and low inflation of the first five years were due mainly to the global economic boom of 2002-07 and the wide-ranging, productivity-enhancing economic reforms carried out prior to 2004. The UPA government’s economic policies were mediocre to start with and worsened increasingly as the decade evolved.“5
3. Worse, the UPA government, in its quest to maintain high economic growth by any means after the global financial crisis of 2008, severely undermined the macroeconomic According to economic observers, the economy reeled under profound mismanagement and indifference.
“Fundamentally, the decade of the UPA government failed to undertake economic, social, and administrative reforms to strengthen India’s long-term economic potential, despite the golden opportunity offered by the years of high growth and investment“6.
4. One such foundation that was severely weakened by the UPA government was price Inflation raged between 2009 and 2014 and the common man bore the brunt. High fiscal deficits for six years between FY09 and FY14 heaped misery on ordinary and poorer households. Over the five-year period from FY10 to FY14, the average annual inflation rate was in double digits. Between FY04 and FY14, average annual inflation in the economy was 8.2 per cent (Chart 1).
Chart 1: Inflation trend in UPA years
Source: International Monetary Fund
Bad Debts in the Banking System
5. The banking crisis was one of the most important and infamous legacies of the UPA When the Vajpayee-led NDA government took office, the Gross Non-Performing Assets (GNPA) ratio in Public Sector banks was 16.0 per cent, and when they left office, it was 7.8 per cent. In September 2013, this ratio, including restructured loans, had climbed to 12.3 per cent largely because of political interference by the UPA government in the commercial lending decisions of public sector banks (Chart 2). Worse, even that high percentage of bad debts was an underestimate.
Chart 2: Rise in Non-Performing Assets during the UPA years
Source: Chart 2.13, Financial Stability Report, Reserve Bank of India, Issue No. 8, December 2013.
6. The banking crisis in 2014 was massive, and the absolute sum at stake was too large. Gross advances by public sector banks were only ₹ 6.6 lakh crore in March 2004. In March 2012, it was ₹ 39.0 lakh crore. Further, not all problem loans were recognised. There was much under the hood. According to a Credit Suisse report published in March 2014, the top 200 companies with an interest coverage ratio of less than one owed about ₹ 8.6 lakh crore to banks. Nearly 44 per cent of those loans (₹ 3.8 lakh crore) were yet to be recognised as problem assets. That alone would have added another 6.7 per cent to the GNPA ratio. In 2018, in a written response to a Parliamentary Panel, a former Governor of the Reserve Bank of India, stated,
“a larger number of the bad loans were originated in the period 2006-2008.”7
Elevated external vulnerability
7. In an era where capital flows dominate, India’s external vulnerability shot up because of over-dependence on external commercial borrowings (ECB). During the UPA government’s tenure, ECB rose at a compounded annual growth rate (CAGR) of 21.1 per cent (FY04 to FY14), whereas in the nine years from FY14 to FY23, they have grown at an annual rate of 4.5 per cent. No surprise, therefore, that our economy was in a vulnerable position in 2013 when the US dollar rose sharply. The UPA government had compromised external and macroeconomic stability, and the currency plunged in 2013. From its high to low, against the US dollar between 2011 and 2013, the Indian rupee plunged 36 per cent (Chart 3).
Chart 3: The free fall of the Indian rupee between 2011 and 2013
Note: Chart shows USD per INR. Source: FRED
Foreign Exchange Crunch and the FCNR(B) Window
8. The famous Foreign Currency Non-Resident (FCNR(B)) deposit window for NRIs was actually a call for help when there was a large depletion of the foreign exchange Under the UPA government, foreign exchange reserves had declined from around USD 294 billion in July 2011 to around USD 256 billion in August 2013. By end-September 2013, forex reserves were just enough to finance little over 6 months of imports, down from 17 months in end-March 2004. Forex reserve to external debt ratio tanked from 95.8 per cent in FY11 to 68.8 per cent in FY14. To salvage an ever-worsening situation, the Reserve Bank of India (RBI) opened a special window for FCNR (B) to attract USD deposits at a high premium in August-September 2013.
9. The costly solution to the above self-created predicament reeked of a re-run of 1991 when India had to approach the IMF for assistance during a Balance of Payments crisis. However, a dubious distinction from 1991 is that the amount raised from NRIs through FCNR(B)(USD 26.6 billion) was 12 times the 1991 IMF bailout (USD 2.2 billion)! The redemption of this high-cost dollar debt was left behind for discharge in FY16, a liability that has since been honoured by our government without disruption.
Mismanagement of public finances
10. The UPA Government’s response to the 2008 Global Financial Crisis – a fiscal stimulus package to combat the spill-over effects – was much worse than the problem it sought to It was way beyond the capacity of the Union Government to finance and sustain. Interestingly, the stimulus did not seem to bear any correlation with the outcomes it sought to achieve because our economy was not unduly affected by the crisis. During the GFC, India’s growth slowed to 3.1 per cent in FY09 but recovered swiftly to 7.9 per cent in FY10 (Table 1). A cross-country analysis using IMF data on real GDP growth during and after the GFC corroborates the fact that the impact on the Indian economy was relatively limited compared to other developed and developing economies. There was no need for the continuation of the misguided stimulus beyond one year.
Table 1: India was not badly affected by GFC 2008
The UPA government’s Finance Minister, in one of his speeches in 2011, admitted as much:
India, unlike most other economies, was not seriously affected by the financial turmoil of 2008 in the developed world͙. 8
11. Under the UPA government, public finances were brought to a perilous state. For six consecutive years between FY09 to FY14, the ratio of India’s Gross Fiscal Deficit (GFD) to Gross Domestic Product (GDP) was at least 4.5 per cent. It was between 4.5 per cent and 5 per cent of GDP in three out of the six years, between 5 per cent and 6 per cent in one, and more than 6 per cent in two years. The revenue deficit rose more than four times from 07 per cent of GDP in FY08 to 4.6 per cent in FY09. It rose further to 5.3 per cent in FY10, declined slightly to 3.3 per cent in FY11, and rose again to 4.5 per cent in FY12.
12. Run-away fiscal deficits led the economy to the fiscal precipice. It was no surprise that the Kelkar Committee for Fiscal Consolidation9, constituted by the UPA Government, aptly described the fiscal situation during FY 2012-13. A relevant excerpt is as follows:
“The Indian economy is presently poised on the edge of a fiscal precipice, making corrective measures aimed at speedy fiscal consolidation an imperative necessity if serious adverse consequences stemming from this situation are to be averted in an efficient and timely manner. A careful analysis of the trends in the current year, 2012-13, suggests a likely fiscal deficit of around 6.1 per cent, which is far higher than the budget estimate of 5.1 per cent of GDP, if immediate mid-year corrective actions are not taken. Runaway fiscal deficits, leading to unsustainable levels of public debt, can cause diverse forms of macroeconomic imbalances varying with the means through which the deficit is financed.”
13. If what we saw as concerning, what we could not see was more troublesome. The Kelkar Committee was right to hint at the underlying deficit being higher than the budgeted deficit. It was the case before FY13 as well. The special bonds in lieu of cash subsidy issued to the Oil Marketing Companies, Fertiliser Companies and Food Corporation of India by the UPA government totalled a little over ₹ 1.9 lakh crore in the five years from FY06 to FY10. Their inclusion in the subsidy bill for each year would have swelled the fiscal deficits and revenue deficits, as shown in Chart 4.
Chart 4: Fiscal and Revenue Deficits: Seen and Unseen
Source: Various budget documents, MoSPI (Back series at 2011-12 prices)
14. As a result of its fiscal mismanagement, the UPA government’s fiscal deficit ended up being far higher than it had expected, and it subsequently ended up borrowing 27 per cent more from the market than what it had budgeted for in 2011-12 (Chart 5). This was after three years of the global financial crisis when the government should have been fiscally consolidating rather than spending more than the budgeted estimate.
Chart 5: Large Overrun of 2011-12 Fiscal Numbers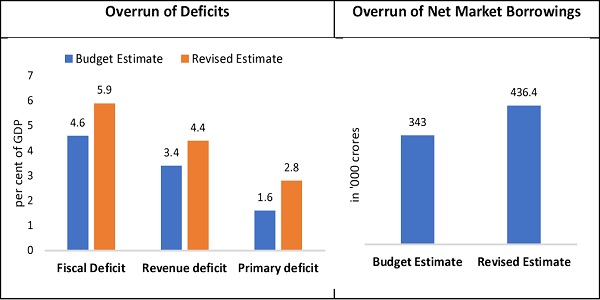
Source: Union Budget for FY2013
15. The fiscal deficit burden became too big to bear, for the economy.
Hence, it is important to delve deeper to understand the excessive unproductive government borrowings, ineffective spending strategies and revenue losses to the exchequer resulting from policy failures in the fiscal years 2005 to 2014.
Steep Rise in market borrowings of the Central Government
16. In the pretext of responding to the impact of the global financial and economic crisis (while arguing, at the same time, that India was not affected by the crisis), the UPA government expanded its borrowing and did not relent at all. As per RBI, “the size of the government’s net market borrowing programme (dated securities) increased nearly 9.7 times in eight years to ₹ 4.9 trillion in 2012-13. In addition, the government resorted to additional funding of ₹ 1.16 trillion through 364-day treasury bills)”10
Misplaced priorities and the conspicuous neglect of infrastructure and asset creation
17. Not only did the UPA Government borrow heavily from the market, but the funds raised were applied unproductively. This aspect is evident when we evaluate the quantity, quality and timing of the expenditure by the government during 2004-2014. Capital Expenditure, which finances public investment in infrastructure, was deprioritised in those 10 years, thereby creating long-term constraints for the economy and compromising its growth potential. As shown in Chart 6, capital expenditure as a per cent of total expenditure (excluding interest payments) halved from 31 per cent in FY04 to 16 per cent in FY14. The economy remained supply-constrained during the UPA government’s tenure. Combined with the consistent boost to aggregate demand from excessive deficits, it resulted in higher inflation, higher current account deficit and an overvalued currency, all of which climaxed in 2013 when the Indian rupee buckled under the weight of such imprudent policies. Public expenditure was geared towards short-term populist measures.
Chart 6: A Capital Indifference
Source: Budget documents
18. The conspicuous neglect of infrastructure creation and challenges of the logistical constraints caused industrial and economic growth to stumble. The UPA government admitted its failure to build infrastructure for the future. In an affidavit submitted to the Supreme Court in response to a Public Interest Litigation, the UPA Government stated that out of around 40000 kilometres of National highways added, 24000 kilometres of national highways were added during the NDA regime from 1997 to 2002. Thereafter, in the past ten of UPA years only about 16,000 kilometres have been added.11
19. The Reserve Bank’s reports also pointed towards excessive revenue expenditure by the UPA government. The Report on Macroeconomic and Monetary developments published by RBI in April 2009 stated that ‘the growth in Government Final Consumption Expenditure (GFCE) picked up sharply during the third quarter of 2008-09 reflecting the Sixth Pay Commission payout, expenditure on agricultural debt waiver, oil and fertiliser subsidies, and counter-cyclical fiscal measures’12. However, it is noteworthy that a large proportion of the enhanced revenue expenditure expansion during this period was announced before the GFC. The GFC gave a fig leaf to the UPA Government to cover up their excessive revenue expenditure done for political gains without yielding any economic benefits for the society.
20. Poor policy planning and execution also resulted in large unspent funds for many social sector schemes during the UPA years, which in turn crippled the effectiveness of the government’s schemes. Across the 14 major social and rural sector ministries13, a cumulative of ₹ 94,060 crore of budgeted expenditure was left unspent over the period of UPA Government (2004-14), which amounted to 6.4 per cent of the cumulative budget estimate during that period (Chart 7). In contrast, under the NDA government (2014-2024), ₹ 37,064 crore of the budgeted expenditure, which is less than 1 per cent of the cumulative budget estimate was left unspent.
Chart 7: Underspending in 14 major social and rural ministries
(Budgeted expenditure- Actual expenditure)
Note: Underspending denotes the difference of actual expenditure from budgeted expenditure. For the year FY24, it is the difference between revised estimate of expenditure and budget estimate; BE denotes Budget estimates. Source: Budget documents
21. Health expenditure remained a pain point for Indian households under the UPA The fact that out-of-pocket expenditure (OOPE) comprised 64.2 per cent of total health expenditure (THE) of India in FY14 (with little improvement over 69.4 per cent OOPE as a percentage of THE in FY05) meant that health expenditure kept drilling holes in the pockets of the Indian citizenship, besides being a pathway to poverty for poorer households.
22. The government’s prioritisation of unproductive spending meant that significant funds were allocated towards consumption rather than productive investment. For instance, the recommendations of the Sixth Central Pay Commission, which were implemented before the GFC, implied a net financial implication of ₹ 7,975 crore for FY09, along with additional arrears payment of ₹ 18,060 crore14. The Agricultural Debt Waiver and Debt Relief scheme (ADWD) of 2008 entailed a fiscal cost of ₹ 52,000 crores (0.9 per cent of GDP).15 A World Bank Policy research working paper has assessed the impact of the debt waiver initiative. Contrary to the expectations, the paper finds no evidence of improved investment, consumption or increased wages resulting from the scheme. Instead, the study reveals that the banks, after getting reimbursed by the Government for the full amount of loans written off under the program, reallocated credit away from the high default districts to districts with lower default rates. Also, the borrowers in high-default districts (even the creditworthy ones) started defaulting in larger numbers after the relief program, indicating strategic default in anticipation of more lenient credit enforcement or similar politically motivated credit market interventions in the future.16
To quote an economist,
“The government has been following a timid approach to tackle economic problems. Its focus has been more on populist policies to win votes instead of thinking of the future and promoting investment to boost growth,”; “Instead of concentrating on doling out subsidies for votes, it should have focused on expediting investment in big infrastructure projects.“17
23. Such was the lack of consideration for long-term national development that even the critical issue of defence preparedness was hampered by policy paralysis. Weak leadership and a consistent lack of intent and action resulted in defence under- By 2012, shortage of combat-ready equipment and ammunition was a chronic issue plaguing our forces. One would also recall the long-drawn process of procurement of fighter aircraft that never reached any conclusion. Even the decision to provide bullet-proof jackets and night vision goggles to Indian Army soldiers was kept hanging for years18.
24. Ban on industrial development in coastal districts. The seas, the Ocean and the Coastal Zones are very important because of their biodiversity and their economic potential. The UPA Government made a maze of regulations which stifled the economic growth and development of the 83 coastal districts, by being mostly restrictive in nature. This made it extremely difficult for communities and districts in coastal regions to reap the benefits of expanding economic activity. This notification also paralyzed the tourism sectors in these districts. Furthermore, the introduction of the CRZ norms by the UPA government also tightened their control on development projects in the coastal districts, thus choking their available options for promoting economic growth. Our Government brought in a balance consideration of Environmental and Developmental priorities.
Wastage of public resources sent the economy into a funk
25. The UPA government’s decade of governance (or its absence) was marked by policy misadventures and scams such as non-transparent auction of public resources (coal and telecom spectrum), the spectre of retrospective taxation, unsustainable demand stimulus and ill-targeted subsidies and reckless lending by the banking sector with undertones of favouritism, etc. The 2G spectrum scam involving 122 telecom licenses that had sliced ₹ 1.76 lakh crore off the exchequer as per the estimates of the Comptroller and Auditor General (CAG), the coal gate scam costing ₹ 1.86 lakh crore to the exchequer, the Common Wealth Games (CWG) scam, etc., indicated an environment of heightened political uncertainty and reflected poorly on India’s image as an investment destination.19
26. The coal scam shook the conscience of the nation in 2014. Before 2014, the allocation of coal blocks was done on an arbitrary basis without following a transparent process to allocate the blocks. The coal sector was excluded from competition and transparency and the sector lacked investments and efficiencies. These actions were scrutinised by investigation agencies, and in 2014, the Hon’ble Supreme Court of India cancelled the allocation of 204 coal mines/blocks allocated since 1993.
27. The UPA government will always be remembered for the largest power outage in our history, in July 2012, leaving 62 crore people in darkness and putting national security at risk. Such darkness engulfed the nation, even as more than 24,000 MW of generation capacity lay idle due to a lack of fuels like coal and gas. The entire sector reached a vicious cycle of inaction and policy paralysis with surplus generation capacity and massive unutilised investments at one end while large power cuts for the consumer on the other end. When our government came to power in 2014, as many as two-thirds of coal-based power plants (66 out of 100 coal plants tracked by Central Electricity Authority) had critical coal stocks, meaning less than seven days of coal stock. This uncertainty was aggravating the overall power shortage. Villages used to get electricity for about 12 hours a day. Farmers used to get for a much lesser duration, thereby not being able to irrigate their crops. The inter-regional transmission lines were also highly inadequate.
28. The electricity shortages under the UPA government were also repeatedly pointed out by international agencies. In its World Development Report 2008, the Bank noted, “With 55 – 60 per cent of India’s irrigated land supplied by groundwater, electricity for tubewell pumps is an important input͙ the quality of service is poor because of erratic and limited supply and voltage fluctuations, which can result in crop losses from forgone irrigation and damaged pumping equipment.” The World Bank again noted in Global Economic Prospects, June 2012, “Growth in India was particularly weak due to monetary policy tightening, stalled reforms, electricity shortage which along with fiscal and inflation concerns, cut into investment activity.”
29. India’s telecom sector lost a precious decade due to the 2G scam and policy paralysis. In the UPA regime, the process of allocation of spectrum lacked transparency and was frequently misused in the years leading up to 2008-09, which resulted in the “2G scam” and started the problems that finally caused a distress situation in the sector. In the years following 2010, virtually no or little spectrum could be allocated to the operators, leading to a slowing down of the growth of the telecom industry. The telecom licenses issued in FY09 were cancelled by the Hon’ble Supreme Court due to a lack of transparency in the allocation process. In this period, the telecom sector went into a seizure as the government was caught out by the Supreme Court judgement. As a consequence of these problems, a number of operators became unviable, leaving this sector in a situation of limited competition. This period also witnessed a flight of foreign investment due to policy uncertainties and legal hurdles.
The curious case of the 80:20 Gold Export-Import Scheme
30. The 80:20 gold export-import scheme launched by the UPA government exemplifies how government systems and procedures were subverted to serve particular interests for obtaining illegitimate pecuniary gains. Private firms and corporate entities were permitted, on a discretionary basis, to avail of benefits under the Scheme. In mid-2014, the then-government permitted select Premier Trading Houses (PTH) and Star Trading Houses (STH) to import gold even though the model code of conduct was in place and the counting of votes cast in the Parliament elections was due on May 16, 2014. This action meant illegitimate windfall gains to the beneficiaries before it was withdrawn by our
Policy Paralysis and Project Delays
31. The UPA government’s term was replete with examples of decision stasis. The Cabinet Secretary noted in 2013,
“many large projects both in the public sector as well as the private sector, especially in infrastructure and manufacturing sectors, have been held up for investment on account of delays in obtaining various approvals/ clearances “.
This realisation led to the formation of a Project Monitoring Group (PMG) in the Cabinet Secretariat in 2013. In a working paper published in March 2014, two months before the national elections in India, two IMF economists identified three main reasons for the investment slowdown in the country: policy uncertainty, delayed project approvals and implementation and supply bottlenecks particularly in the mining and power sectors20. These two sectors were blighted by questionable auctions and hence subjected to judicial scrutiny. Speaking at a function in India in March 2015, Christine Lagarde, the then Managing Director of the IMF, while praising the government for making India a bright spot in the global economy, contrasted it with the previous regime: “Many of these projects were delayed due to regulatory uncertainty and bureaucratic holdups”21.
32. The UPA government capitalised on the reforms brought in by the previous government but fell short of delivering on crucial reforms promised by them. The IMF noted in 2012, “Many investors have been disappointed by the pace of reform of the present government coalition, which had been expected to accelerate implementation, and more recently have become concerned about slower government decision-making following high profile governance scandals and increased civil activism”22. Notably, the UPA Government promised to introduce the Goods and Services Tax (GST) with effect from 1st April 2010. Despite being a coalition comprising 26 parties from the length and breadth of the country, the UPA government failed to bring GST to effect on 1st April 2010 because it could not effectively address the concerns of various states23. This impasse impeded any progress on the structural reform, leaving the aspiration of achieving a unified “one nation, one market” system as an unrealised goal till our government took over.
33. Aadhar in India, a symbol of digital empowerment, too has suffered at the hands of UPA. Aadhar, introduced by UPA in 2006, was the tangible development of the idea of a ‘multipurpose national card’ proposed by the Vajpayee-led NDA government, to be issued based on a National Register of Indian Citizens. The Registrar General of India initiated a National Population Register (NPR) programme while the former Planning Commission supervised the Unique Identity project. The UPA government could not establish any sense of common purpose, and there were wide inter-ministerial differences in the scope, purpose and implementation responsibilities. It was only NDA’s re-imagination of Aadhaar that energized Aadhar, making it purposeful as a tool of empowerment that cuts away middlemen, helps facilitate direct subsidies to the poor deseeding duplicate beneficiaries, and brings authenticity to transactions. The story of Aadhar under the UPA government is a story of ineffective decision-making, little sense of purpose and policy failure.24
34. In the UPA government, decision-making came to a standstill due to corruption and scandals in defence , compromising defence preparedness. The government delayed the acquisition of artillery and anti-aircraft guns, fighters, submarines, night fighting gear and a host of equipment upgrades.
A Security Analyst wrote in 2010:
“With arms inflation at 15 per cent per annum, a five-year delay means that India pays twice what it should have. And when that equipment is obtained through government-to-government purchases and other single-vendor contracts, the cost is about 25 per cent more than it would have been in competitive bidding. Conservatively estimating that delays afflict just half of the defence ministry’s ₹ 50,000 crore procurement budget, India buys ₹ 25,000 crore worth of weaponry for 125 per cent more than what it should have paid.”25
35. A large number of development programmes and projects were implemented poorly as brought out in several performance audit reports of the Comptroller and Auditor General. For example, (1) under Sanitation Campaign /Nirmal Bharat Abhiyan, construction of household toilets remained 44 to 52 per cent of the targets during FY10 to FY14. 33 per cent of the constructed toiles were defunct due to reasons like poor quality of construction, incomplete structure, non-maintenance, etc; (2) out of 442 ongoing projects of Railways, the target for completion of projects was fixed for only 156 (35 per cent) Delay in completion of projects resulted in cost overrun of ₹ 1.07 lakh crore ; (3) 57 to 83 per cent of the partners for the skill development failed to meet their targets during FY11 to FY14 ; (4) Railway Board took on an average 43 months to sanction the bridgeworks after identifying for rehabilitation from a safety perspective, and even after that the bridgeworks were completed with an average delay of 41 months.
Economic Fragility and Policy Uncertainty Poisoned the Investment Climate
36. The economic affairs were in dire straits, which was not lost on public commentators. According to an economic observer,
“People are justly worried about the downtrend recorded by virtually every economic indicator: exports, industrial production, the rupee, the stock market index, economic growth itself. The only things that seem to be going up are inflation, the trade gap and the fiscal deficit. There is also reason to worry about whether the government is up to the challenge or even reading the situation correctly.“26
37. While investors across the world sought ease of doing business, the UPA government provided policy uncertainty and hostility. The unenthusiastic economic environment was reinforced by the hostile policy environment. The UPA government’s policy inaction and missteps put off valuable private investment, which could have generated growth and jobs, at its own peril. A noted industrialist lamented the state of affairs, saying, “You may have the prime minister’s office saying one thing and maybe one of the ministers having a different view. That doesn’t happen in most countries,”; “You wouldn’t have a seven-or eight-year wait to get clearance for a steel plant.”2738. The demotivating investment climate under the UPA government led to domestic investors moving abroad. A prominent industrialist even remarked that he would invest in countries like Indonesia and Brazil because frequent policy changes were scuttling his investment plans. His disenchantment and disillusionment were due to the capturing of public resources for private gains.28
Lost opportunities
39. The decade of the UPA government was a lost decade because it failed to capitalise on the strong foundational economy and pace of reforms left behind by the Vajpayee The potential of compounding growth never happened.
40. It was a lost decade as the UPA government failed to gasp opportunities for technology-led innovation, efficiency and growth. Vajpayee-govt had set the baseline for telecom reforms. But at the time when the world was closing in on 3G, UPA was mired in the 2G scam, and the auctions had to be cancelled subsequently. BSNL, a $6bn powerhouse in 2004, had become a loss-making company in the UPA decade. India was almost 100% reliant on imported telecom equipment.
Lack of leadership
41. Time and again, there was a crisis of leadership in the UPA government. It came out in full public glare in the shameful public tearing up of an ordinance issued by the
In sum, under the UPA government, the economy had lost its way
42. The Economic Survey of 2012-13 noted, “While India’s recent slowdown is partly rooted in external causes, domestic causes are also important. The strong post-financial-crisis stimulus led to stronger growth in 2009-10 and 2010-11. However, the boost to consumption, coupled with supply-side constraints, led to higher inflation. Monetary policy was tightened, even as external headwinds to growth increased. The consequent slowdown, especially in 2012-13, has been across the board, with no sector of the economy “29 The sobering acknowledgement of a short-sighted handling of crisis and persistent policy failures crippling the economic ecosystem in 2013 understates the crisis of confidence and depths of despair that Indians felt.
43. The UPA government’s economic and fiscal mismanagement had ultimately hollowed the growth potential of India by the end of its term. The IMF noted in 2013:
“The growth slowdown (in India) is too big to be explained by fiscal consolidation and monetary tightening. That leaves us with capacity constraints… As investment in new roads, factories, ports, and energy has fallen, the speed limit of the Indian economy has come down too… As you know, project approvals have become much more difficult. That’s perhaps because of the scandals related to big projects, increasingly complex and overlapping regulations, intensified scrutiny of all projects. The slowdown in bureaucratic approvals is affecting road building, power plant construction, and even new factory approvals. In other words, the difficulties of the reform process are starting to have a negative impact on the economy.”30
44. The economic mismanagement choked the growth potential and India became a “fragile” economy. In 2012-13, the growth in Gross Value Added (GVA) stood at a tepid 5.4 per cent, marked by a flailing industrial sector growing at 3.3 per cent and a weak agricultural sector growing at 1.5 per cent, while the services sector held the fort with a growth of 8.3 per cent. By 2013, Morgan Stanley had placed India in the league of ‘Fragile Five’ –a group comprising emerging economies with weak macroeconomic fundamentals. These, inter-alia, included low growth, high inflation, high external deficit and impaired state of public finances. The fact that the economy could only grow from being the 12th largest in 2004 to the 10th largest in 2014 merely exposed the short-lived, qualitatively inferior and unsustainable nature of the high growth experienced between 2005 and 2012.45. Ultimately, what the UPA Government bequeathed in 2014 was an unenviable legacy of a structurally weaker economy and a pervasive atmosphere of despondency.
PART-2: Pervasive Corruption
46. There was pervasive corruption in various government activities, including in procurement, allocation of natural resources, and regulatory approvals. procurements vital for nation’s security were also not free from corruption. The scams and corruption cases had shaken confidence of the people. Following is the current status of some of the high-profile cases.
- Coal Block Allocation: This financial scandal involved irregularities and corruption in allocation of coal blocks by the government to private companies for captive use, leading to an estimated loss of ₹ 1.86 lakh crore to the exchequer, as estimated by the CAG31. This came to light in 2012. The Supreme Court cancelled 204 such allocations32. Final Reports have been filed in the Courts in 47 Cases, and 10 cases are under In 14 cases the accused have been convicted by the trial courts. Remaining cases are under trial.
- Commonwealth Games: The event was marred by widespread corruption, mismanagement, and financial irregularities in planning and execution of various projects related to the games. Charge-sheets were filed in 8 cases which are under trial in courts of Delhi.
- 2G Telecom: This involved a loss of about ₹ 1.76 lakh crore of potential revenue to the government, as estimated by the CAG (at the rates paid for 3G spectrum)33. The corruption cases are in the appellate court.
- Saradha Chit Fund: This was a ponzi scheme with diversion of funds for personal use, and luring investors with the promise of high returns. The scam unfolded in 2013 when the group collapsed, leaving millions of investors in financial distress.
- INX Media Case: This case involved money laundering and irregularities in foreign investment approval for investment into a media company. It is under trial.
- Aircel-Maxis: The case involved allegations of Irregularities in the approval of foreign investment in a telecom company, and illegal gratification. The case is under trial.
- Antrix-Devas Deal: Irregularities and corruption in a satellite deal between Antrix Corporation, the commercial arm of the Indian Space Research Organisation (ISRO), and Devas Multimedia Pvt. Ltd, and irregularities in allocation of scarce S-band spectrum and wrongful gains to Devas Multimedia are the key elements of this case. The Supreme Court has confirmed the finding of fraud. Charge-sheet for the criminal offence has been filed.
- Land for Jobs: The case involves obtaining pecuniary advantages in form of transfer to land or property in lieu of appointments of substitutes in Group ‘D’ in different zones of Railways. Investigation is underway.
- Allotment/Release of Prime Land in Panchkula and Gurgaon: These are multiple cases relating to release of prime land from acquisition in connivance with the private builders and allotment of industrial land to close associates. After investigation, charge-sheets have been filed in trial courts.
- JΘK Cricket Association: The case involves misappropriation of nearly ₹ 44 crores by opening “bogus” bank accounts. After investigation, charge-sheet has filed.
- The Embraer Deal: The case is related to corruption, bribery and kickbacks in purchase of aircraft from the Brazilian aerospace company Embraer. After investigation, charge-sheet was filed, and the case is pending in trial court.
- Pilatus Basic Trainer Aircraft: The case involves corruption in procurement of 75 Pilatus basic trainer aircraft for the Indian Air Force in 2009.
- Hawk Aircraft Purchase: The case involves payment of bribery to unknown officers of Ministry of Defence, during the period 2003 to 2012, in procurement of Hawk Aircraft from M/s Rolls Royce plc, UK. The case is under investigation.
- Adarsh Housing Society Scam: This case involved irregularities in allotment of apartments in a defence land project. It is at the trial stage.
- Augusta Westland Helicopter Scam: Kickbacks were paid in procurement of
PART-3: Rescue of the economy from a state of crisis, despair and paralysis
47. When our government assumed office, the economy was on a road to nowhere, exhibiting tell-tale signs of deep distress emanating from multiple ‘wrong turns’ in economic policy. The disconnect between India’s policy planners and priorities for the country was so stark that the people gave an overwhelming mandate in the General Elections of 2014 to the National Democratic Alliance (NDA) to take charge of the reins, reverse the staggering economic and fiscal muddle that the country was mired in and restore its dynamism and optimism.
48. As soon as our government took over in 2014, we recognized the urgent need to revamp and overhaul systems and processes, to help India advance on the path of development while also bolstering its macroeconomic foundations. The preceding decade was characterised by reliance on inefficient policy design and implementation mechanisms, resulting in a stagnating economy. We adopted a paradigm of transparent and clean governance by the executive while simultaneously involving citizens in the process of policymaking and in ensuring its effective implementation.
49. Right from spearheading the digital revolution to elimination of open defecation, and from successfully vaccinating the entire eligible population using indigenous vaccines to substantially diversifying exports, India has achieved remarkable milestones under our new governance paradigm. We have addressed the inherited legacy of inefficiencies through simplification and rationalization of laws, adopting a trust-based and responsive delivery machinery, ease of doing business reforms to unleash the potential of every sector, inclusive and empowering scheme designs focused on partnerships with the citizens and also with the States through strengthened cooperative federalism. Contrary to the piecemeal delivery of the past, we have achieved saturation coverage for all deserving We shifted the welfare focus from entitlement-based support to empowering individuals by integrating them into the formal sector.
50. We constituted an expenditure Reform commission to rationalise and prioritise Government expenditures to achieve desired development outcomes and make effective use of tax payers’ money for nation building.
51. We continue to undertake measures to unearth black money and to discourage recourse to it.
52. In parallel, we have also strengthened the health of the economy and the business The foundation for a comprehensive reform process was laid in the initial years of our government. IMF Article IV Report (2015) mentioned that “India’s near-term growth outlook has improved and the balance of risks is now more favourable, helped by increased political certainty, several policy actions, improved business confidence, lower commodity import prices, and reduced external vulnerabilities.” Two years later in its 2017 Article IV report, the IMF further upgraded its optimism about India highlighting that “Medium term growth prospects have improved due to the implementation of key reforms, loosening of supply-side bottlenecks, and appropriate fiscal and monetary policies that enhance macroeconomic stability”.
53. The initiation of the reform process started yielding positive results in the early years of our government, by improving the investor climate and creating a favourable outlook for the economy. The Industrialists who earlier preferred to invest in other countries exhibited a new sense of excitement for investing in India. India was right back on top in their list of countries to invest in.34 Over the past decade, this trust in India’s economic potential has strengthened. Both domestic and foreign investors exhibit high optimism regarding India’s growth potential, anticipating abundant opportunities as the economy expands.
54. This section of the paper discusses in detail how our government rescued, recovered and rejuvenated the economy from policy stasis, paralysis and mis-governance by the UPA government and infused it with dynamism and growth, and hope in the people
Macroeconomic situation in the past ten years: Emerging stronger from the rubble
From Fragile-Five to Top-Five in a decade
55. Since the time our government assumed power in 2014, the Indian economy has undergone many structural reforms that have strengthened the macroeconomic fundamentals of the economy. The government’s economic policy focus has been committed to undoing the damage of the previous decade and restoring India’s growth potential by getting the financial sector back on track, facilitating economic activity by easing conditions for business, and massively augmenting physical and digital infrastructure to enhance India’s connectivity and, thus, the competitiveness of its manufacturing sector. With this vision to guide its policies, the government has undertaken diverse reforms to restore and enhance the potential of the economy by creating a business-friendly environment, improving ease of living, and strengthening the governance systems and processes. This led to a substantial decline in policy uncertainty in India, which had peaked under the UPA Government.
56. These reforms resulted in the transition of India from the league of ‘Fragile Five’ to the league of ‘Top Five’ in just about a decade as the economy was transformed into a far more resilient avatar amidst a challenging global environment (Table 3).The rise of the Indian economy in the last ten years despite unprecedented obstacles of external origin (e.g. pandemic, geopolitical disturbances, etc.) is manifest in the trajectory of its GDP From being the 10th largest in 2014, India has surpassed many giants to become the fifth largest economy in 2023 (but for the pandemic in 2020, we would have become the 5th largest at least two years earlier) and is slated to become the third largest by 2027 as per IMF projections.
Table 3: Status of India’s Macroeconomic fundamentals in 2012-13 and 2021-22
| Macroeconomic Fundamentals | Taper 1 | Taper 2 |
| (2012-13) | (2021-22) | |
| Current account balance as a percentage of GDP | -4.8 | -1.2 |
| YoY Real GDP growth (per cent) | 5.5 | 9.1 |
| Foreign exchange reserves as a per cent of GDP | 16.0 | 20.1 |
| Headline YoY inflation | 9.9 | 5.5 |
| Exchange rate depreciation (INR/USD) (YoY) | 6.3 | 3.1 |
Source: MoSPI
Indian Banking System: From sickness to health
57. In the past ten years, the government has revitalised the stagnant financial sector and overhauled the credit ecosystem within the economy, bringing about significant Implementation of the Insolvency and Bankruptcy Code (IBC) and measures implemented by the RBI and the government to strengthen the balance sheets of the banking sector (such as the Asset Quality Review, Prompt Corrective Action Framework, merger and recapitalisation of banks) led to a decline in the ratio of the Gross Non-Performing Assets as a proportion of Gross advances to a multi-year low of 3.2 per cent in September 2023. The restored profitability of public sector banks then and now tells its own story of rescue, recovery and rejuvenation(Table 4).
Table 4: Key ratios of Public Sector Banks (figures in per cent)
| 2013-14 | 2022-23 | |
| Net Interest Margin (NIM) | 2.45 | 2.72 |
| Return on Assets (RoA) | 0.50 | 0.79 |
| Return on Equity (RoE) | 8.48 | 12.35 |
Source: RBI
Policies to enhance the productive potential of the economy
58. Our government’s vision of “Nation First” has transformed the quality of India’s infrastructure and logistics ecosystem, which will be key for the country to attract investments and expand its presence in global value chains. The share of capital expenditure in the total spending by the Central Government excluding interest payments improved to 28 per cent in FY24 (RE) from 16 per cent in FY14. Moreover, the efficiency of how capital was utilised improved due to “Whole of Government” approach using Gati Shakti and monitoring through Pragati.
59. For instance, when our government took charge in FY15, the pace of national highway construction languished at 12 km/day. The pace of construction rose more than 2.3X to 28 km/day in FY2335. While the UPA government laid nearly 16,000 km length of national highways in their 10 years of governance, our government has already done at least three times better than this in its nearly 10-year rule. From FY15 to FY23, the length of national highways increased from 0.98 lakh Km to 1.45 lakh km, the cargo traffic at major ports has risen from 581 million tonnes to 784 million tonnes. Electrified rail route has gone up from 22,224 km (FY15) to 50,394 km (FY22). India’s aviation industry has undergone significant growth and transformation over the past decade. The number of airports doubled from FY15 to FY23 (Chart 8).
Chart 8: Improvement in physical infrastructure under NDA
Source: MoRTH, Indian Ports Association, Ministry of Railways and Ministry of Civil Aviation and Budget speech of February 2024.
60. In addition, the procurement of critical equipment for the defence sector, paramount for national security was not prioritised by the UPA government. These have been emphasised by our government. National Defence has received the attention it deserves. The procurement of fighter jets and the indigenous development of submarines are just two of the examples. Further, multiple measures have been undertaken to streamline Defence Procurement Procedures for the swift procurement of equipment such as Thermal Imaging (TI), Night Sights for the Rocket Launcher (RL)36and Long Range Dual Band Infrared Imaging Search and Track System (IRST). This has prevented substantial delays in the Defence capital procurement.
61. Our Government understands the true spirit of balancing ‘Prakriti’ and ‘Pragati’ which was wholly missing in the regulations of 2011. The NDA government has prioritized the protection of sensitive ecological areas along India’s coastlines and the creation of climate-resilient coastal districts. These are priorities that the NDA Government has strived to achieve through reforms. To ensure that coastal districts are equipped to address the risks posed by climate change, the NDA government has committed itself to ensure these districts are able to raise the necessary resources through economic development and empowerment of the communities in these districts. Thus the Coastal Regulation Zone (CRZ) 2019 was introduced. The additional controls put in place by the UPA government were rationalized, ensuring that coastal districts are empowered to make decisions that would benefit their communities. The reforms will also provide a boost to the tourism industry in these coastal districts by allowing the construction of temporary as well as more durable tourism facilities such as hotels and resorts in zones that were previously restricted as “No Development Zones (NDZs)” by the UPA government. There is equal emphasis on conservation and protection of Ecologically Sensitive Areas.
Revival of investor sentiments
62. The reform measures undertaken by our government have significantly elevated the medium-term investment prospects of the economy. Both domestic and foreign investors express high optimism regarding India’s growth potential, anticipating lucrative opportunities as the Indian economy expands. The announcement of India’s inclusion in JP Morgan’s Government Bond Index-Emerging Markets (GBI-EM) is a milestone event, underscoring India’s growing significance in the global economy. This will not only help India raise more funds but also increase the investor base for government securities and help India meet the country’s growing borrowing needs. Moreover, specialised funds are being crafted to cater to investors seeking exposure to India’s equity markets, such as the Goldman Sachs India Equity Portfolio37. India is now a must-have in one’s portfolio, and this can be understood from a recent statement by the renowned investor and fund manager Mark Mobius, who remarked that
“India is sweeping investors off their feet with its allure and promises of great rewards. I, too, am fascinated by its huge growth potential”38.
Public welfare through empowerment and effective delivery
63. Empowerment through welfare has been the leitmotif for our government. We adopted the philosophy “sabka sath, sabka vikas” prioritising universal access to basic amenities, and a participatory, mission-mode approach in actualising this philosophy. Over the last decade, the focus of social welfare has graduated from being focused on “entitlement without building capacity” into a more long-term-oriented, efficient, and empowering With a ‘leave no one behind’ mindset, our government has pursued the saturation of social sector schemes, ensuring that social sector schemes are targeted towards the deserving beneficiaries and fake/ineligible entries are weeded out. Such an approach not only builds social infrastructure for the decades to come but also enables individuals to climb up the standard-of-living ladder and utilise the opportunities accompanying high growth.
64. Our government has resolved the execution challenges that plagued the UPA government by implementing technology-based targeting and monitoring mechanisms. The government used technology as a vehicle of social empowerment and unlocked the potential of JAM Trinity, i.e., Jan Dhan, Aadhaar, and Mobile. This government took the issue of leakages very seriously, and the first variety of JAM- PAHAL scheme of transferring LPG subsidies via Direct Benefit Transfer (DBT) reduced leakages by 24 per cent. It is this government’s commitment to the ideal of “reaching the last mile” that the utilisation of Aadhaar has facilitated the transfer of over ₹ 34 lakh crore to more than 1,167 crore beneficiaries under DBT. The ubiquity of user-friendly dashboards and management information systems (MIS) across major schemes has instilled transparency and accountability through real-time monitoring. For example, geo-tagging of assets under MGNREGS, PM-AWAS Yojana, etc. has enabled real-time monitoring and transparency in the implementation of big-ticket programmes. Our government’s transformative and decisive approach culminated in a much better track record of programme delivery than its predecessor, as noted in Table 5.
Table 5: Comparison of Outcomes of Key Programmes with Similar Objectives
| UPA government | NDA government | |||
| Scheme | Period | Outcome | Period | Outcome |
| Affordable Housing – Rural | 2003-2014 | 2.1 crore39 | 2016-2024 | 2.6 crore40 |
| Construction of Toilets | 2011-2014 | 1.8 crore toilets constructed41 | 2014-2024 | 11.5 crore household toilets constructed42 |
| Affordable Pension for unorganised sector workers | 2011-2014 | 36.4 lakh beneficiaries43 | 2015-2023 | 6.1 crore beneficiaries44 |
| Minimum Zero Balance Bank Accounts | 2005-2012 | 10.3 crore accounts45 | 2014-2024 | 51.6 crore accounts46 |
| Rural Electrification | 2005-2014 | 2.15 crore households47 | 2017-2022 | 2.86 crore households electrified48 |
| Affordable medicines | 2008-2014 | 164 Jan Aushadhi Stores opened of which 87 functional49 | 2014-2023 | 10,000 stores opened50 |
| Optical Fibre Network | 2011-2014 | 6577 km of optical fibre laid51 | 2015-2023 | 6.8 lakh optical fibre laid52 |
| Maternity benefit for the poor | 2010 – 2013 | 9.9 lakh beneficiaries in 53 districts53 | 2017-2023 | 3.59 crore beneficiaries54 across India |
65. Besides physical and digital efficiency of implementation, this Government also utilised behavioural change and social capital through “Swachh Bharat”, “Beti Bachao Beti Padhao”, and a pro-active communication of schemes and programmes. The dynamism of women’s collectives has been harnessed through Deendayal Antyodaya Yojana-National Rural Livelihood Mission (DAY-NRLM) and the programme has been upscaled substantially covering 9.9 crore women from rural households into 89.8 lakh SHGs55. The emergence of “Bank Sakhis” and “Lakhpati Didis” is an outcome of programme innovation and building ownership in communities.
66. Our government has innovated the delivery infrastructure besides widening the social security net. For instance, the seamless portability of ration card across States through ‘One Nation One Ration Card’ now expanded to the entire NFSA population across the country56, and creation of a national database of unorganised workers ‘eShram portal’ are path-breaking reforms for welfare of migrant workers. The progress of the path-breaking Ayushman Bharat programme, with nearly 22 crore beneficiaries, is being further tech-enabled through digital health IDs ‘ABHA’ and telemedicine through e-Sanjeevani. The emphasis on digital land records through SVAMITVA is structural reform in rural land management and individual economic empowerment.
67. Besides substantially improving upon the UPA government’s programme delivery, our government also undertook several policy innovations to tap India’s development The emphasis on entrepreneurship through Start-Up India, Stand-Up India, largescale provision of accessible credit through Mudra Yojana, upskilling of SHGs, and loans to street vendors through PM-SVANidhi, reflects our government’s focus on empowering job-creators from all sections of society. Another thoughtful policy, given the country’s demography and occupation profile, is the accessibility of affordable social security schemes for the unorganised sector workers. Our government has customised welfare schemes to address the needs of every section of India’s diverse population, including, inter alia, women, youth, Divyangjans, Particularly Vulnerable Tribal Groups, artisans, and sportspersons.
68. The PM-Kisan Samman Nidhi empowered farmers and improved their incomes without hurting the borrower-lender relationship. The UPA’s ADWD ended up hurting the flow of credit to farmers. In contrast, our Kisan Samman Nidhi strengthened the ability of the farmers to repay their loans. This is the key difference in our approach to welfare. The delivery of welfare is efficient, effective and empowering.
Removing the sting of the high cost of living for households
69. To tackle the enduring challenge of high inflation inherited from the UPA government in 2014, our government strategically addressed the root cause of the problem by implementing responsible fiscal and monetary policies. First, fiscal discipline undergirded the government’s spending decisions. In 2016, the government gave the mandate to the RBI to target inflation in the band of 2 per cent to 6 per cent. Average annual inflation between FY14 and FY23 declined to 5.0 per cent from an average inflation of 8.2 per cent between FY04 and FY14 (Chart 9). But for the geopolitical developments that significantly escalated global commodity prices, the average inflation in the last 10 years would have been even lower. Yet the government had inflation in control through diversifying supply sources and strengthening buffers of key food items.
Chart 9: Average headline Inflation during the UPA Government vs our Government
Source: International Monetary Fund
External Sector vulnerability controlled
70. Our government has made concerted efforts to control the high external sector vulnerability inherited from the UPA Government. An ecosystem has been created through comprehensive measures undertaken both in the manufacturing as well as foreign trade space by the government. As a result, India’s merchandise exports grew by around 41 per cent from the Calendar Year (CY) 2014 to CY 2022, higher than the world merchandise export growth of about 31 per cent. Moreover, India’s Services exports grew by 97 per cent for the same period, when the world services exports witnessed a growth of 36 per cent. This enabled the average current account deficit to GDP to come down significantly to 1.1 per cent between FY15 and FY23, relative to an average of 2.3 per cent of GDP between FY05 and FY14 (Chart 10).
Chart 10: Stable Current account deficit as a per cent of GDP
Source: RBI
71. Due to the economy’s strong fundamentals restored by our government, Rupee demonstrated resilience during global shocks such as the Russia-Ukraine conflict and taper tantrum of 2021-22 by major central banks. A 2022 research paper by the RBI57 shows that India’s response to Fed’s tapering in 2021 was less severe on the exchange rate due to India’s stronger external position in 2021 in comparison to 2013. Within four months of the Fed’s announcement in 2013, the Rupee had depreciated by 14.9 per cent against the dollar. In contrast, the Rupee depreciated by much milder 0.7 per cent in 2021 within the four months following Taper 2 announcement. (Chart 11).
Chart 11: Rupee Depreciation in the first four months of Tapering
Source: RBI
72. Not only did our government manage the current account prudently, but it ensured its smooth and comfortable funding via more stable foreign direct investment (FDI). FDI liberalisation measures undertaken by the government brought in technology and financial resources to enhance the competitiveness of the Indian industry. This includes opening almost all sectors, except a few strategically important ones, for 100 per cent FDI under automatic route. As against the gross FDI of USD 305.3 billion mobilised between FY05 and FY14, our government garnered almost double that amount (USD 596.5 billion) in nine years between FY15 and FY23 (Chart 12).
Chart 12: Trends in Gross FDI
Source: RBI
Note: Gross FDI inflows are Gross Inflows (including reinvested earnings)
73. As a result, India’s external sector is much safer, with forex reserves increasing from USD 303 billion (equivalent to 7.8 months of imports)58 in March 2014 to USD 617 billion (10.6 months of imports)59 in January 2024. India has come a long way and could easily ward off the threat of rising Fed rates in FY22 when monetary tightening commenced the world over in the wake of global inflationary pressures. The Indian rupee has been remarkably stable against the US dollar in the last two years.
Public Finances: the journey from sorry state to solid state
74. When our government came to office, public finances were not in a healthy state. To restore public finances to good health, our government went to great lengths to transform India’s fiscal system into a reformed tax and spending ecosystem. Long pending reforms such as the GST for One Nation One market were initiated. Our government exercised compassionate prudence during Covid-19 crisis, and instilled transparency in public finances by incorporating the erstwhile off-budget liabilities into proper budget accounts.
75. Moving away from the past practice, below-the-line financing is now being transparently So far, this government has expended about ₹ 1.93 lakh crore in the last ten years towards repayment of principal and interest for special bonds issued to Oil Marketing Companies, Fertiliser Companies and Food Corporation of India in lieu of cash payout of subsidy prior to 2014. This government will further defray ₹ 1.02 lakh crore towards the balance outstanding liabilities and interest thereon during 2025-2027.
Government borrowing in UPA and NDA governments: a study in contrast
76. The market borrowings of the Central Government, which had grown at phenomenal rates during the UPA years, were controlled by our government. The net market borrowings (G-sec) of the Central Government, which had gone up 4.5 times during the UPA regime, went up by 2.6 times under our government despite the higher spending requirements necessitated by the once-in-a-century global pandemic (Chart 13).
Chart 13: Growth in net market borrowings (G-Sec) of the Central Government
Source: Budget documents and Union Government Finance accounts; The figures for FY24 are Revised Estimates Sea-change in the quality of public expenditure
77. Improvement in the quality of expenditure by our government has been the cornerstone of our fiscal policy. Our government has accorded the highest priority towards increasing capital expenditure in the past decade so as to provide an impetus to the investment cycle and hence break the fuelling economic downturn and lingering inertia. Chart 14 shows that the CAGR of Revenue Expenditure has come down during the tenure of our government relative to the period of the UPA government. Alternatively, the Capital expenditure has grown at a much higher Compounded average growth under our government.
Chart 14: Improvement in the quality of expenditure during the last decade
Source: RBI
78. In absolute numbers, the budgeted capital expenditure has increased over five-folds from FY14 to FY24 (RE), without any heating-up of the economy (Chart 15b). The share of capital expenditure to total expenditure, which was on an average 12 per cent during FY10 to FY14, increased to about an average of 14.5 per cent during FY15 to FY24 (RE) and notably to an average of 15.8 per cent in the past five years (Chart 15a). As a result, the deterioration in the quality of expenditure witnessed during the pre-2014 phase has now been effectively reversed. Revenue expenditure was reprioritized to address the welfare needs of the people, particularly in times of crisis and it was made more effective through better targeting with the help of technology. This helped our government implement the world’s largest free food programme, and other direct benefit transfers to the vulnerable sections of society during the Covid-19 crisis.
Chart 15: Emphasis on capital expenditure during 2015-2024
Source: Budget documents
Use of procyclical fiscal policy by UPA versus Counter-cyclical fiscal policy by NDA
79. Contrary to the UPA Government’s approach of expanding the budgets during the high growth periods (pro-cyclical), the present government has followed a prudent fiscal policy of containing the budget size during peak cycle of GDP growth to generate adequate fiscal space for handling any unforeseen events (counter-cyclical) (Chart 16). Therefore, when Covid-19 impacted India, the government was not seen as fumbling for a response. It put in place, without delay, a well-crafted fiscal stimulus that reached out to every sector and every person without showing signs of distress. The budget size increased from 12.2 percent of the GDP in FY19 to 17.7 percent of GDP in FY21. Despite substantial fiscal stimulus in FY21, the fiscal situation did not get out of hand because the stimulus was prudent and calibrated and not open-ended. More importantly, as soon as the immediate need for the stimulus receded, our government went to work to reclaim the fiscal space. As the economic growth rebounded impressively from FY22 onwards, the government has steadily brought down the gross fiscal, revenue, and primary deficits. The approach has been marked by fiscal prudence and transparency. This is in stark contrast to how the fiscal and revenue deficit was still rising in FY12, three years after the GFC in 2008-09.
Chart 16: Pro-cyclical fiscal policy during UPA period vs Counter-cyclical
fiscal policy during NDA period
CAGR of total expenditure during the UPA and NDA regime
Note: Crisis years cover the Covid-19 pandemic and multiple geopolitical conflicts which impacted the GDP growth. Source: Budget documents
Reformed tax-ecosystem with robust revenue growth in the last decade
80. The introduction of the GST regime was a much-needed structural reform. Prior to the introduction of the Goods Θ Service Tax (GST), the mélange of state levies, more than 440 tax rates, excise duties and the compliance requirements of multiple agencies administering these rates meant that India’s internal trade was neither free nor united. The implementation of the reform entailed unifying 29 states and 7 Union Territories, which, due to their different tax structures, were economic territories on their own.
81. The new tax structure is characterised by political consensus building and pooled sovereignty of the GST Council, both salient examples of cooperative federalism. In order to protect the revenue interests of the States, during the initial years of GST, our government guranteed compensation for states for 5 years (2017 – 2022) for any revenue shortfall from a minimum growth of 14% in GST revenues. The GST reform has led to gains on multiple fronts. The new tax structure, by unifying India’s states into a single market, is also incentivising scale in businesses.
80. Far-reaching tax reforms over-past decade have put in place effective systems that have improved revenue collection and compliances.
- The average tax-GDP ratio for FY15 to FY24 RE is about 10.9 per cent, higher than the ten-year average of 10.5 per cent during 2005-14. This is despite lower tax rates and widespread relief extended during the Covid-19 pandemic.
- Calculations show that GST has helped households save nearly ₹ 45,000 crore per month from December 2017 until March 2023. At the same time, monthly average revenue from GST has gone up from ₹ 90,000 crore in FY18 to ₹ 1.7 lakh crore in FY24 (Chart 17).
Chart 17: Average monthly Gross GST collections
Source: Department of Revenue
Sharing resources with states for development
83. Acknowledging that States are equal partners in development, our government, in the true spirit of cooperative federalism, accepted the recommendations of the 14th and 15th Finance Commission. Around 41-42 per cent of Central taxes have been shared with the States every year over the last decade. This is a substantial jump from the earlier devolution share of 30-32 per cent. Consequently, the quantum of resources devolved to States has been about 3.8 times higher than earlier (Chart 18). This leap in the absolute quantum of the resources devolved to States translates to about 1 per cent of GDP.
Chart 18: Comparison of transfers to states across the two regimes
Source: Budget documents
84. Moreover, the Centre has stood firm by the States in times of a changing environment. Acknowledging the need for timely funds in the States, we have frontloaded these payments to the States. GST compensation cess, additional borrowings and very long-term interest-free loans for capital expenditure have expanded the resources of the States for spending as per their development and welfare needs.
Ensuring Public Resources for Public Welfare From darkness to light in Coal Licensing
85. In order to address the inefficiencies and enhance the competition and transparency in the coal sector, multiple reforms were taken up by our government in the last ten years. After coming to power, our government swiftly enacted the Coal Mines Special Provisions (CMSP) Act 2015, to ensure transparent allocation of coal resources and energy security of the country. Various other measures included the first ever coal blocks auction, commercial coal mining, rationalisation of coal linkages, Single window for e-auction of coal etc. As a result of our government’s relentless efforts to clean the coal sector, coal production reached a record level of 893.19 MT in FY23, which is the highest in the history of India. The level of coal production in FY23 implies a growth of about 57.8 per cent over the coal production of 565.77 MT in the year FY14. The CAGR of coal production from FY09 to FY14 was 2.8 per cent, if this had continued the coal production in FY23 would have been 725.39 MT.
Energising and Empowering the Power Sector
86. Our government has addressed the multiple issues plaguing the power sector of the country, thus transforming it from power-deficient to power-sufficient. Under the stewardship of our government, the country rapidly recovered from a situation of having two-thirds of coal-based power plants with critical coal stocks (in 2014) to having not even a single power plant in the country facing a critical coal stock level in 2015. The critical issue of power deficiency has been addressed by adding 196558 MW of generation capacity since April 2014, and India has also attained the target of “One-Nation, One Grid – One Frequency”. As a result, the gap between Energy Requirement and Energy Supplied has come down from 4.2% in 2013-14 to 0.3 % in 2023-24.60 Under the Prime Minister’s vision of “Sahaj Bijli Har Ghar”, every village and household has been electrified. The availability of power in rural areas has increased from 12 hours in 2015 to 20.6 hours, and in the urban areas, it has increased to 23.8 hours. While the power sector has been reformed to provide continuous electricity to all, the PM KUSUM scheme is enabling Annadata- our farmers even become urjadaata-energy providers, benefitting more than 46 lakh farmers.61
Ringing in better governance in the Telecom Sector
87. Since 2014, our government has taken several steps to correct the situation in the telecom market and to effectively handle the failures that resulted from the lack of clarity in policy in the sector. It brought transparent methods of spectrum auction, trading and sharing that further enabled the optimal utilisation of spectrum. Conduct of 2022 5G Auction, increased the overall spectrum availability for the telecom service providers (TSPs) by allocating the highest-ever quantum of spectrum, i.e., 52 GHz, at the highest-ever auction value. Also, healthy cash flow for TSPs enabled them to make capital investments in 5G technology, leading to the rollout of 5G network in the country, which is acknowledged as the fastest 5G rollout in the world. The efficacy of all the measures is reflected in the increasing cumulative gross revenue of all telecom service providers, which has already crossed ₹ 3 lakh crore.
Conclusion
88. The UPA Government failed miserably to facilitate economic activities. Instead the UPA Government created hurdles that held back economy. It basked in the after-glory of the lagged effects of the reforms of the Vajpayee-led NDA government and benign global conditions and proceeded to exploit the resultant fast economic growth for narrow political purposes without much concern for long-term economic consequences. The result was a mountain of bad loans, a high fiscal deficit despite much of it being hidden, a high current account deficit, double-digit inflation for five years which hit the pockets of many Indians and membership of the club of “Fragile Five” in 2013. They not only failed to impart dynamism into the economy but also robbed the economy of it such that our industrialists went on record stating that they would rather invest abroad than in India. To drive investors away is easy but to win them back is hard. The UPA government also demonstrated that it is easier to hurt the economy than it is to help it. They inherited a healthy economy and bequeathed an enfeebled one to us. We have restored its vitality. The box below captures the difference we could make in the last ten years and we hope to build on it in the next twenty-five years.
Then and Now – A Summary
- When the NDA government took over the reins in 2014, the economy was in bad shape, nay, crisis. We faced the hydra-headed challenge of fixing an economy mismanaged for a decade, and restoring its fundamentals to sound health.
- Then, we were among the ‘fragile five’ economies; now, we are among the ‘top five’ economies, making the third highest contribution to global growth every year.
- Then, the world had lost confidence in India’s economic potential and dynamism; now, with our economic stability and growth prospects, we inspire hope in We share at Annexure 1 a snapshot of perceptions of two major international organizations.
- Then, we had a scam-riddled 12-day Commonwealth Games; now, we successfully hosted a far-bigger and year-long G20 Presidency in 2023, showcasing India at its best in terms of content, consensus and logistics, providing acceptable solutions to global problems.
- Then, we had 2G scam; now, we have extensive coverage of the population
under 4G with the lowest rates and the world’s fastest rollout of 5G in 2023. - Then, we had the Coalgate scam; now, we have built systems for transparent and objective auctions for harnessing natural resources to boost the economy and the public finances.
- Then we provided gold import license for a chosen few; now, we have set up a bullion exchange in GIFT IFSC with a transparent mechanism for import.
- Then, we had the economy facing a ‘twin balance sheet problem’; now, we have turned the economy to having a ‘twin balance sheet advantage’ for companies as well as banking sector with ample capacity to ramp up investments and credit and generate employment.
- Then, we had double-digit inflation; now, inflation has been brought down to little over 5 per cent.
- Then, we had a foreign exchange crisis; now, we have record foreign exchange reserves of over USD 620 billion.
- Then, we had ‘policy-paralysis’; infrastructure was not a priority; now, the wheels of the virtuous cycle of ‘investment, growth, employment and entrepreneurship, and savings’ leading to more investments and productivity has been set into fast
- Then, we had sporadic coverage of development programmes; now, we have ‘saturation coverage’ for providing basic necessities for all, with measured, targeted, and inclusive support for the needy and empowerment of all to pursue their aspirations.
- In sum, the progress achieved in the ten years of our government has overcome the malaise and paralysis of the previous ten years of the UPA government. In 2024, confidence and purpose have replaced the diffidence and drift of 2014. A list of selected socio-economic indicators is presented in Annexure 2.
89. Our government, armed with political and policy stability, recognised the need to make tough decisions for the greater economic good. Restoring dynamism in the economy, optimism in our minds and pride in our achievements was a task that was left to us to achieve. We accepted the challenge recognising that public life is about winning hearts, minds and heads of the people and instilling in them confidence about their future and that of their children through commitment, dedication and demonstration in action. Rather than employing quick fixes, we undertook bold reforms to nurture the coming decades of economic performance. Our government, unlike its predecessor, invested in the foundations of the economy along with building a sturdy superstructure. Looking back at the last ten years, we can say with humility and satisfaction that we have successfully overcome the challenges left behind by the previous government. That said, we are not resting on our laurels. There are miles to go and mountains to scale before we sleep.
90. The Amrit Kaal has just begun and our destination is “India a developed nation by 2047”. It is our Kartavya Kaal.
Annexure 1
Evoluon of the IMF and World Bank’s percepon about India
Current Account Deficit and Inflaon
| S. No. | Pre-2014 | Post-2014 | ||||
| Structural Reforms | ||||||
| 1. | 2012 India’s Arcle IV Consultaions:
Many investors have been disappointed by the pace of reform of the present government coalion, which had been expected to accelerate implementaon, and more recently, have become concerned about slower government decision-making following high-profile governance scandals and increased civil acvism. |
Ms Kristalina Georgieva, MD IMF (Oct 2022) during IMF/WB Annual Meengs 2022:
India deserves to be called a bright spot on this otherwise darkening horizon because it has been a fast-growing economy even during these difficult mes. But most importantly, this growth is underpinned by structural reforms, among them the remarkable success in digitalisaon in India from digital ID to providing all services and support on the basis of digital access. |
||||
| Current Account Deficit and Inflaon | ||||||
| 2. | IMF paper on “India: Selected Issues, 2014”:
͙unprecedented widening of India’s current account deficit in terms of the sectoral savings-investment balance. Persistently high inflaon is found to have depressed real returns, prompng a surge in gold imports and a marked deterioraon in household financial savings. |
“2021 Arcle IV Consultaons, India”:
Net inflows and improvement in the current account have supported an increase in foreign exchange reserves. |
||||
| 3. | Global Economic Prospects, June 2012: Managing Growth in a Volale World:
Domesc tension appear to be particularly acute in countries India where inflaon is high and fiscal and current account deficits elevated. |
Global Economic Prospects, January 2015 : Having Fiscal Space and Using It:
The current account deficit and elevated inflaon—both persistent vulnerabilies—have declined considerably. Over the medium-term, growth is expected to rise steadily to 7 percent as reforms begin to yield productivity gains. |
||||
| Business confidence | ||||||
| 4. | IMF paper on “India: Selected Issues, 2014”:
Based on four commonly used indicators of financial strength, vulnerabilies of India’s corporate sector are found to be higher than at the trough of the GFC, and at their highest since the early 2000s. The sixth chapter examines the factors behind the recent investment slowdown in India. The results suggest that in addion to standard macro‑ financial variables, heightened uncertainty and deteriorang business confidence have played an important role. |
2022 Arcle IV Consultaons, India: Corporate and financial sector balance sheets have improved. Financial sector policies provided important support to the corporate sector during the pandemic. Accommodave monetary policy and regulatory easing targeng lenders and borrowers played a key role in supporng the financial sector and avoiding a credit crunch…. The balance sheets of non-banking financial companies (NBFCs) have also improved. These developments largely reflect the corporate sector recovery… | ||||
| India’s Investment Slowdown | ||||||
| 5. | The High Cost of Economic Policy Uncertainty by Rahul Anand, Volodymyr Tulin (March 25, 2014):
The slump in infrastructure and corporate investment has been the single biggest contributor to India’s recent growth slowdown. India’s investment growth, averaging above 12 percent during the last decade fell to less than one percent in the last two years. ...more and more investment projects are geng delayed and shelved, while the pipeline of new projects has become exceponally thin. The following key factors stand out as possible contributors to the recent investment slowdown: i. Rising policy uncertainty. ii. Delayed project approvals and implementaon. iii. Supply bolenecks. |
IMF Article IV 2018, India: Inflation-targeting monetary policy framework, the introduction of Goods and Services Tax (GST), the Insolvency and Bankruptcy Code (IBC) and liberalisation of foreign investment inflow have augmented the economy. The reforms have helped in opening up the economy to foreign investors. Directors welcomed that the capital flow management framework was moving in the direcon of greater liberalizaon, notably in the area of foreign direct investment͙. Directors welcomed the important progress that has been made in strengthening the supply side of the economy through large infrastructure investments. |
||||
| Reduced Capital Flow | ||||||
| 6. | 2012 India’s Arcle IV Consultaions: The rupee depreciated the most among major Asian currencies in 2011, partly due to India’s current account deficit.
Concerns about global growth have harmed investor segments and advanced economies’ bank deleveraging has raised the cost of external finance. |
2022 India’s Arcle IV Consultaions: The external posion in FY2021/22 was broadly in line with that implied by medium-term fundamentals and desirable policies. Current account surpluses and large capital inflows helped the RBI replenish its international reserves during the pandemic. …Capital inflows helped improve the net international investment posion. |
||||
| External sector | ||||||
| 7. | India Development Update, April 2013:
With a weaker BOP posion, the rupee connued to lose value during FY 2013 and hit an all-me low in June, remaining around the level unl August. |
Global Economic Prospects, June 2016 : Divergences and Risks: … FDI to India surged 37 per cent from the launch of the “Make in India” campaign in October 2014 to February 2016, with the computer so ware and auto move sectors aracing the bulk of this investment. |
||||
Annexure 2
| S.no | Variable | Unit | Source | THEN | NOW | Remarks |
| Macroeconomy | ||||||
| 1 | Inflation | Per cent | IMF | 8.2 | 5.0 | THEN: CAGR of inflation between FY04 – FY14; NOW: CAGR of inflation between FY14 – FY23 |
| 2 | GDP Per Capita (PPP) | PPP Dollar, Inflation Adjusted | World Bank | 3,889 | 6,016 | THEN – Average per capita GDP between FY05-FY14
NOW – Average per capita GDP between FY15-FY23 |
| 3 | Capital Expenditure | Percent of GDP | M/o Finance | 1.7 | 3.2 | THEN- Capex as a per cent of GDP for FY14 NOW- Capex as a per cent of GDP for FY24 (RE) |
| 4 | Electronics Exports | US Dollars, Billions | M/o Commerce | 7.6 | 22.7 | THEN- Exports for FY14 NOW- Exports for FY23 |
| 5 | Foreign Direct Investment | US Dollar, Billions | RBI | 305 | 596.5 | THEN – Sum of Gross FDI between FY05 – FY14; NOW – Sum of Gross FDI between FY15 and Nov 2023 |
| 6 | Multidimensional Poverty | Percent of Population | UNDP, Niti Aayog | 29.2 | 11.3 | THEN- As at the end of 2013-14
NOW- As at the end of 2023 (Estimated) |
| 7 | Indirect Tax Rate | Per cent | Department of Revenue | 15 | 12.2 | THEN- Average Pre-GST Indirect Tax Rate, NOW-Average GST Rate as of March 2023 |
| 8 | Number of Start-ups | Number of Companies | DPIIT | 350 | 1,17,257 | THEN- As of 2014
NOW- As on 31st December 2023 |
| 9 | Harvard Economic Complexity Index | Ranking | Harvard University | 52 | 42 | THEN- Ranking in 2011
NOW- Ranking in 2021. (Indian Economy has become more sophisticated over the last decade. Lower numbers represent higher ranking.) |
| Physical and Digital Infrastructure | ||||||
| 10 | Cities with Metro Rail | Number of Cities | M/o Housing & Urban Affairs | 5 | 20 | THEN – As at the end of 2014, NOW As at the end of 2023 |
| 11 | National Highway constructed length | Thousand km | M/o Road Transport & Highways | 25.7 | 54.9 | THEN-highways constructed between FY05 and FY14;
NOW – highways constructed between FY15 – FY24 (till Nov) |
| 12 | Pace of highway construction | km/day | M/o Road Transport & Highways | 12 | 28.3 | THEN – pace in 2013-14; NOW – pace in 2022-23 |
| 13 | Consequential Rail Accidents | Average Number of accidents | M/o Railways | 233 | 34 | THEN – Average no. of accidents between FY05 and FY14
NOW – Average no. of accidents between FY15 and FY23 |
| 14 | Electrified rail network | Thousand km | M/o Railways | 21.8 | 60.8 | THEN – Electrified broad-gauge network as of 2014;
NOW – Electrified broad-gauge network as of November 2023 |
| 15 | Number of airports | Number | M/o Civil Aviation | 74 | 149 | THEN – As at the end of 2014; NOW – As of February 2024 |
| 16 | Average Toll Plaza Waiting Time | Time | M/o Road Transport & Highways | 12.2 minutes |
47 seconds | THEN – As in 2014; NOW – As in 2023 |
| 17 | Total Installed Power Capacity | Giga Watts | Central Electricity Authority | 249 | 429 | THEN – As of March 2014 NOW – As of December 2023 |
| 18 | Installed Renewable Energy Capacity | Giga Watts | Central Electricity Authority | 76 | 181 | THEN – As of March 2014; NOW – As of December 2023 |
| 19 | Logistics Performance Index | Ranking | World Bank | 54 | 38 | THEN- India’s ranking in the index for the year 2012, NOW- India’s ranking in the index for the year 2023. Lower numbers represent higher ranking. |
| 20 | Mobile Broadband Subscribers | Number of People,
Crores |
TRAI | 6 | 90 | THEN- As at the end of 2013-14;
NOW- As at the end of November 2023 |
| 21 | Monthly Data Usage | GB | TRAI | 0.06 | 18.39 | THEN- As at the end of March 2014; NOW- As at the end of June 2023 |
| 22 | Wireless Data Tariff | Rupees per GB | Ministry of Communica-tions | 269 | 10.1 | THEN – rupee cost of per GB data in 2014; NOW – rupee cost of per GB data in 2023 |
| Secure Future and Ease of Living | ||||||
| 23 | Medical Colleges | Number of Colleges | M/o Health and Family Welfare | 387 | 706 | THEN – As in 2014
NOW – As of 2nd Feb 2024 |
| 24 | Seats in Medical Education | Number of Seats | M/o Health and Family Welfare | 51,348 | 1,08,940 | THEN – As of 2014
NOW – As of 2nd Feb 2024 |
| 25 | Number of Universities | Quantity | Ministry of Education | 676 | 1168 | THEN- As of 2013-14 NOW- 2021-2022 |
| 26 | Global Innovation Index | Ranking | WIPO | 81 | 40 | THEN – India’s ranking in 2015 NOW – India’s ranking in 2023
(Lower numbers represent higher ranking.) |
| 27 | Trademarks registered | Number of trademarks (lakh) | O/o CGPDTM | 8.8 | 17.9 | THEN – trademarks registered between FY05 and FY14;
NOW – trademarks registered between FY15 and FY22 |
| 28 | Number of LPG Connection | Crore | M/o Petroleum & Natural Gas |
14.5 | 31.4 | THEN – As of April 2014 NOW – As of August 2023 |
| 29 | Number of PNG Connections | Lakh | M/o Petroleum & Natural Gas |
22.3 | 119 | THEN – As of April 2014 NOW – As of October 2023 |
| 30 | Electrification Status | Per cent | World Bank | 85.1 | 100 | THEN – As of 2014 NOW – As of 2023 |
| 31 | Average Availability of Electricity (Rural) | Hours | M/o Power | 12 | 20.6 | THEN – average number of hours of electricity available in 2014;
NOW – average number of hours of electricity available in 2023 |
| 32 | Number of tap water connections (Rural) | Crore | Ministry of Jal Shakti |
3.2 | 13.8 | THEN – As of August 2019 NOW – As of December 2023 |
| 33 | Total number of DBT Beneficiaries | Crore | DBT Website | 10.8 | 166 | THEN- As of FY14 NOW- As of FY23 |
| 34 | Funds transferred to under-privileged households under various schemes (total of cash and kind) | Rs. Crore | DBT Website | 7,367 | 7,16,396 | THEN- Transfer in FY14 NOW- Transfer in FY23 |
| 35 | Waste Processed by Urban Local Bodies | per cent of total waste generated | M/o Housing & Urban Affairs | 18 | 76 | THEN – As of 2014
NOW – As of 6th Feb 2024 |
Notes:
¹ Budget Speech, FY25
² PM’ Independence Day Speech, 15th August 2023
³ FY stands for the financial year beginning April.
4 Economic Survey 2003-04, Ministry of Finance, Government of India
5 Shankar Acharya: “UPA’s economic legacy – Good, bad or ugly?”, Business Standard, 25th February 2014 (https://www.business-standard.com/article/opinion/shankar-acharya-upa-s-economic-legacy-good-bad-or-ugly114022501240 1.html)
6 Article by former Chief Economic Adviser, Dr. Shankar Acharya, in Business Standard, 25th Feb 2014 https://www.businessstandard.com/article/opinion/shankar-acharya-upa-s-economic-legacy-good-bad-or-ugly-1140225012401.html
7 This note was prepared by Professor Raghuram G. Rajan on September 6th 2018 at the request of the Chairman of the Parliament Estimates Committee, Dr. Murli Manohar Joshi, MP
8 https://pib.gov.in/newsite/PrintRelease.aspx?relid=77144
9 https://dea.gov.in/sites/default/files/Kelkar_Committee_Report.pdf
10 Source: Chapter 3 (‘Fiscal-Monetary Co-ordination in India: an assessment’) of the RBI Report on Currency and Finance, 2009-12 (p. 47) released on March 4, 2013 in the RBI website.
11 https://sansad.in/getFile/debatestextmk/16/II/2307(f).pdf?source=loksabhadocs
12 https://www.rbi.org.in/Scripts/PublicationsView.aspx?id=11345#ANN1
14 https://doe.gov.in/sites/default/files/6cpchighlights%281%29%281%29.pdf
15 https://rbi.org.in/scripts/BSViewBulletin.aspx?Id=17091
16 https://papers.ssrn.com/sol3/papers.cfm?abstract id=2524163 (World Bank Policy Research Working Paper No. 7109)
17Ashok Desai, Economist https://www.indiatoday.in/india/north/story/india-manmohan-singh-upa-scams-policy-paralysisgdp-growth-rate-economy-178631-2014-01-27
18 PM’s speech at the Defence Expo in Mahabalipuram in April 2018
https://pib.gov.in/ViewVideo.aspx?VID=51670&MinID=1325&VPRID=44195&Day=&Month=4&Year=2018
19 More details on these are presented in Part 2.
20 Rahul Anand and Volodymyr Tulin (2014): ‘India’s investment slowdown: the high cost of economic policy uncertainty (https://www.imf.org/en/Blogs/~rticles/2014/03/25/indias-investment-slowdown-the-high-cost-of-economic-policyuncertainty)
21 Christine Lagarde: ‘Seizing India’s moment’, 16th March 2015 (https://www.imf.org/en/Blogs/Articles/2015/03/16/seizing-indias-moment)
22 India’s Article IV Consultations, 2012, the International Monetary Fund
23 https://www.indiabudget.gov.in/budget archive/ub2007-08/bs/speecha.htm
24 See also https://indianexpress.com/article/political-pulse/aadhaar-journey-bjp-digital-india-9095394/ (5th January 2024)
25 Ajai Shukla, Business Standard, 23 rd February 2010
26 The arbitrary state – by T N Ninan – 19th May 2012, Business Standard
27 Mr. Ratan Tata in an interview to Financial Times, quoted in Firstposthttps://www.firstpost.com/business/tata-bye-byeeven-ratan-tata-has-given-u p-on-this-govt-549194.html
28 Mr. Kumar Mangalam Birla in an interview to Bloomberg in March 2013, “Billionaire Who Shunned India Does U-Turn on Modi Overhaul”, 12th November 2014 (https://www.bloomberg.com/news/articles/2014-11-11/billionaire-who-shunnedindia-does-u-turn-as-mod i-boosts-economy)
29 Economic Survey 2012-13, Ministry of Finance, Government of India
30 Mr Naoyuki Shinohara, DMD IMF (May 2013) during a speech on “Global Economic Prospects and the Implications for India” to FICCI
31 https://cag.gov.in/uploads/download audit report/2016/Chapter 1 of eAuction of Coal Mines Compliance Audit.pdf
32 https://pib.gov.in/PressReleasePage.aspx?PRID=1989632#:~:text=It%20was%20informed%20that%20before,CMSP%20~ct% 20in%20March%202015.
33 https://cag.gov.in/en/audit-report/details/2314 (Pg 8 of PDF)
34 “Billionaire Who Shunned India Does U-Turn on Modi Overhaul”, 12th November 2014 (https://www.bloomberg.com/news/articles/2014-11-11/billionaire-who-shunned-india-does-u-turn-as-modi-boostseconomy)
35 https://pib.gov.in/PressReleseDetail.aspx?PRID=1985811
36 https://pib.gov.in/PressReleaseIframePage.aspx?PRI D=1533669
37 https://www.gsam.com/content/dam/gsam/pdfs/international/en/fund-literature/monthly-fundupdate/mfuindiaeqocsseken.pdf?sa=nΘrd=n
38 https://x.com/MarkMobiusReal/status/1742392958467670143?s=20
39 https://164.100.158.235/question/annex/241/Au1406.pdf , https://loksabhadocs.nic.in/Refinput/New Reference Notes/English/Rural HousingIndiraAwasYojana.pdf
40 https://dashboard.rural.nic.in/dashboardnew/pmayg.aspx
41 Unstarred PQ no. 237, answered on 2.12.2015, Rajya Sabha
42 https://sbm.gov.in/sbmgdashboard/statesdashboard.aspx
43 Unstarred PQ no. 2657, answered on 14.3.2016, Lok Sabha
44 Pension Fund Regulatory and Development Authority
45 https://pib.gov.in/newsite/erelcontent.aspx?relid=84130
46 https://pmjdy.gov.in/account
47 Lok sabha unstarred question 4448 dated 20.02.2014
48 https://pib.gov.in/PressReleaseIframePage.aspx?PRID=1907728n
49 Starred PQ no. 32, answered on 8.7.2014, Lok Sabha
50 https://pib.gov.in/PressReleasePage.aspx?PRID=1988675#:~:text=The%20Prime%20Minister%20virtually%20launched,the% 20people%20of%20the%20country.
51 Unstarred PQ no. 1770, answered on 3.12.2014, Lok Sabha
52 https://usof.gov.in/en/usof-dashboard
53 https://pib.gov.in/newsite/PrintRelease.aspx?relid=101140
54 https://pib.gov.in/PressReleseDetail.aspx?PRID=1998748
55 https://pib.gov.in/PressReleasePage.aspx?PRID=1985466
56 https://pib.gov.in/PressReleaseIframePage.aspx?PRID=1990696
57 https://www.rbi.org.in/Scripts/BS_ViewBulletin.aspx?Id=21140
58 https://rbi.org.in/Scripts/PublicationsView.aspx?id=15769
59 https://rbidocs.rbi.org.in/rdocs/Bulletin/PDFs/RBIBU LLETI NJANUARY2024EC59F69FFEA5447B9A75C33E7CA8CB26.PDF
60 https://pib.gov.in/PressReleseDetailm.aspx?PRID=2003172
61 https://pib.gov.in/PressReleaseIframePage.aspx?PRID=1944762


