Since the industrial revolution, no country has become a major economy without becoming an industrial power.
– Lee Kuan Yew
Meeting the challenge of jobs may require paying attention to labor-intensive sectors. The apparel and leather sectors meet many desirable attributes for policy attention: bang- for- buck for creating jobs, especially for women, opportunities for exports and growth. Rising labor costs means that China is gradually vacating its dominant position in these sectors, affording India an opportunity. To not cede this space to competitors such as Vietnam and Bangladesh will require easing restrictions on labor regulations, negotiating FTAs with major partners such as the EU and UK, and ensuring that the GST rationalizes current tax policy that can discriminate against dynamic sectors.
I. INTRODUCTION
7.1 Creating jobs is India’s central challenge. Generating rapid economic growth is one critical element of the policy response; nurturing an enabling environment for investment is another; and targeted action yet another. Related to the latter, India needs to generate jobs that are formal and productive, provide bang-for-buck in terms of jobs created relative to investment, have the potential for broader social transformation, and can generate exports and growth. The apparel and leather and footwear sectors meet many or all of these criteria and hence are eminently suitable candidates for targeting. Recognizing this, the government announced important steps to incentivize the production and exports of apparel (Government of India, June 2016), while corresponding policy initiatives for leather products is a subject of discussion.
II. WHY CLOTHES AND SHOES?
Growth and exports
7.2 Nearly every successful economic growth take-off in post-war history in East Asia has been associated with rapid expansion in clothing and footwear exports in the early stages, as Figure 1 and Table 1 show.
7.3 In the successful East Asian economies, countries where GDP growth booms averaged between 7-10 per cent, growth in the exports of these two sectors was exceptional. The average annual growth of apparel exports was over 20 per cent, with some close to 50 per cent; and that of leather and footwear averaged more than 25 per cent. In its take-off phase of growth, India has under performed relative to the East Asian
Figure 1. Exports of Apparel and Leather & Footwear Post Take Off
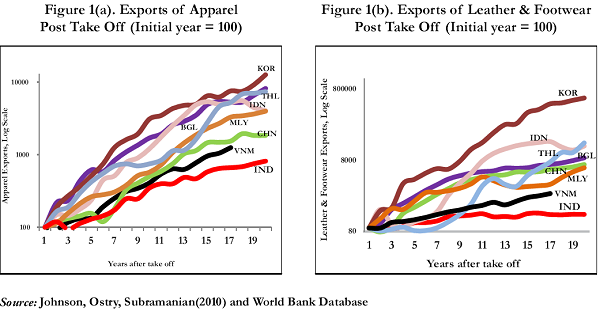
Table 1. Exports of Apparels and Leather& Footwear Post Take Off
| Country | Year of take off | Annual avg export growth for 20 years post take off (per cent) of Apparel | Annual avg export growth for 20 years post take off (per cent) of Leather and Footwear | Annual avg economic growth for 20 years post take off (per cent) |
| KOR | 1962 | 30.4 | 69.9 | 9.0 |
| BGL | 1985 | 27.9 | 29.8 | 5.2 |
| THL | 1960 | 53.8 | 44.1 | 7.5 |
| IDN | 1967 | 65.8 | 48.6 | 7.0 |
| MLY | 1970 | 33.4 | 27.5 | 6.9 |
| CHN | 1978 | 18.6 | 27.7 | 9.8 |
| VNM | 1985 | 17.8 | 16.1 | 6.6 |
| IND | 1980 | 12.7 | 5.4 | 5.6 |
Source: World Bank Database
competitors. The Indian under performance, has been particularly marked in the leather sector.
Jobs, especially for women
7.4 Apparels and Leather sectors offer tremendous opportunities for creation of jobs, especially for women. Table 2 compares the labor-intensity, measured in terms of jobs per unit of investment, and female labor intensity for the major manufacturing sectors.
The data show that the apparel sector is the most labor-intensive, followed by footwear. Apparels are 80-fold more labor-intensive than autos and 240-fold more jobs than steel. The comparable numbers for leather goods are 33 and 100, respectively. Note that these attributes apply to the apparel not the textile sector and to leather goods and footwear not necessarily to tanning. Drawing upon the World Bank employment elasticities, we estimate that rapid export growth could
Table 2. Jobs to Investment Ratio for Select Industries
| Sectors | Investment (Rs Crores)* | Jobs (Lakhs) |
Jobs per lakh Investment |
Female Jobs (Lakhs) |
Female Jobs per lakh Investment |
| Apparels (NIC 14) | 3156 | 75.4 | 23.9 | 25.9 | 8.2 |
| Leather & Footwear (NIC 15) |
1624.5 | 11.6 | 7.1 | 5.5 | 3.4 |
| Of which | |||||
| Tanning and Dressing of Leather & Fur (NIC 1511) |
470.8 | 2.2 | 4.6 | 1.1 | 2.4 |
| Leather Goods (NIC 1512) |
218.3 | 2.2 | 9.9 | 0.8 | 3.9 |
| Footwear(NIC 1520) | 935.4 | 7.2 | 7.7 | 3.6 | 3.8 |
| Textiles (NIC 13) | 17814.7 | 71.3 | 4 | 22.5 | 1.3 |
| Food Processing (NIC 10) |
21119 | 50.2 | 2.4 | 27.9 | 1.3 |
| Autos (NIC 2910 & 2930) |
29647.6 | 7.6 | 0.3 | 3 | 0.1 |
| Steel (NIC 2410 & 2431) |
70528.3 | 7.8 | 0.1 | 3.7 | 0.05 |
Source: ASI 2012-2013, NSSO 68th round
Note: *Investment is Gross Fixed Capital Formation
generate about half a million additional direct jobs every year.
7.5 The opportunity created for women implies that these sectors could be vehicles for social transformation. Women in apparel factories emphasize the agency they had gained on financial decisions. The agency also extended to husbands starting to helping with household chores. In Bangladesh, female education, total fertility rates, and women’s labour force participation moved positively due to the expansion of the apparel sector.
A historic opportunity – China vacating; space filled by others and not India!
7.6 India has an opportunity to promote apparel, leather and footwear sectors because of rising wage levels in China that has resulted in China stabilizing or losing market share in these products (Figures 2 to 4).
7.7 Table 3 shows wages in China and East Asian economies and in the major Indian states. India is well positioned to take advantage of China’s deteriorating competitiveness because wage costs in most Indian states are significantly lower than in China. Alas, this is not happening, or at least, not enough. The space vacated by China is fast being taken over by Bangladesh and Vietnam in case of apparels; Vietnam and Indonesia in case of leather and footwear (Figures 2(b), 3(b), 4). Indian apparel and leather firms are relocating to Bangladesh, Vietnam, Myanmar, and even Ethiopia. The window of opportunity is narrowing and India needs to act fast if it is to regain competitiveness and market share in these sectors. Hence, the urgency.
Figure 2. Share in Global Apparels Exports(per cent)( HS Code 61 & 62)
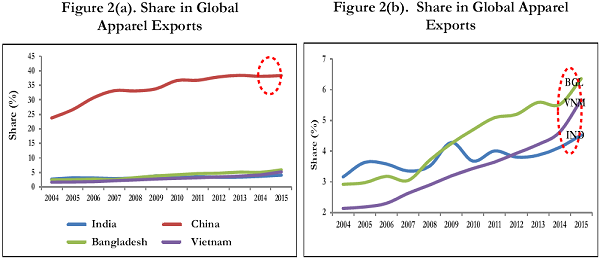
Figure 3. Share in Global Footwear Exports (per cent) (HS Code 64)
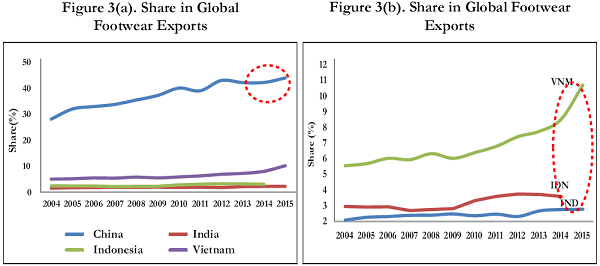
Figure 4. Share in Global Leather Exports (per cent) (HS Code 42)
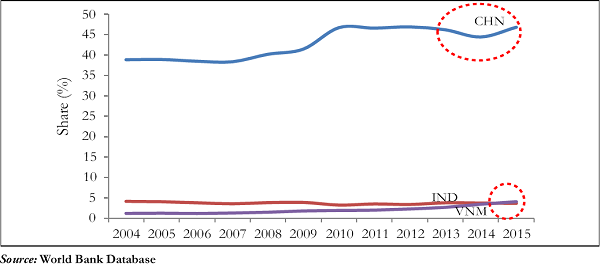
Table 3. Minimum Wages for semi-skilled workers
| Year | Monthly Wages (USD) | |
| Andhra Pradesh | 2016 | 90 |
| Tamil Nadu | 2016 | 93 |
| Uttar Pradesh | 2016 | 95 |
| Karnataka | 2016 | 105 |
| West Bengal | 2016 | 109 |
| Gujarat | 2016 | 114 |
| Madhya Pradesh | 2016 | 115 |
| Maharashtra | 2016 | 118 |
| Haryana | 2016 | 119 |
| Bangladesh | 2013 | 80-120 |
| Vietnam | 2015 | 180- 250 |
| China | 2013 | 250 – 300 |
| Indonesia | 2013 | 120 – 150 |
Source: ILO, State Labour Departments
III. CHALLENGES
7.8 Clearly, India still has potential comparative advantage in terms of cheaper and more abundant labour. But these are nullified by other factors that render them less competitive than their peers in competitor countries.
7.9 The Apparel and Leather sectors face a set of common challenges: logistics, labor regulations, and tax & tariff policy, and disadvantages emanating from the international trading environment compared to competitor countries. In addition, the leather and footwear sector faces the specific challenge relating to policies that prevent converting its comparative advantage— abundance of cattle—into export opportunities. These are elaborated below.
A. COMMON CHALLENGES
Logistics
7.10 On logistics, India is handicapped relative to competitors in a number of ways. The costs and time involved in getting goods from factory to destination are greater than those for other countries as may be seen in Table 4. Further, few very large capacity containers (VLCC) come to Indian ports to take cargo so that exports have to be trans-shipped through Colombo which adds to travel costs and hence reduces the flexibility for manufacturers.
Labor regulations
7.11 Labor costs, India’s source of comparative advantage in this sector, also seem not to work in its favor. The problems are well-known: regulations on
Table 4. Logistics Cost
| Countries | Logistics cost (US$ per km road transport) | Time taken (No. of Days) at Port and for Shipping | |
| Customs/Port clearance | From Port to delivery at US east coast | ||
| India | 7.0 | 6.0 | 21.0 (JNPT) ; 28.0 (Chennai/ Tuticorin) |
| China | 2.4-2.5 | 1.5 | 14.0 |
| Bangladesh | 3.9 | 10.0 | 21.0 |
| Vietnam | 7.0 | 6.0 | 14.0 |
| Sri Lanka | 3.0 | 3.0 | 23.0 |
Source: CLE & Apparel Industry sources
minimum overtime pay, onerous mandatory contributions that become de facto taxes for low-paid workers in small firms that results in a 45 per cent lower disposable salary (documented in Chapter 10 of Volume 1 of the Economic Survey 2015-16), lack of flexibility in part-time work and high minimum wages in some cases. There are strict regulations for overtime wage payment as the Minimum Wages Act 1948 mandates payment of overtime wages at twice the rate of ordinary rates of wages of the worker.
7.12 One symptom of labour market problems is that Indian apparel and leather firms are smaller compared to firms in say China, Bangladesh and Vietnam. An estimated 78 per cent of firms in India employ less than 50 workers with 10 per cent employing more than 500. In China, the comparable numbers are about 15 per cent and 28 per cent respectively.
Tax and Tariff Policies
7.13 In both apparel and footwear sectors, tax and tariff policies create distortions that impede India gaining export competitiveness. In the case of apparels, there are two sets of policies both of which
impede competitiveness in man-made fibers and favor instead cotton-based exports. This is serious because internationally, world demand is shifting strongly towards man-made fibers and against cotton-based exports (Figure 5).
7.14 On the one hand, high tariffs on yarn and fiber increase the cost of producing clothing. India imposes a 10 percent tariff on man-made fibers vis a vis 6 percent on cotton fibres. To some extent this need not affect export competitiveness because drawback for tariffs paid on inputs is available. But drawbacks are not provided for purchases of domestically produced yarn that will reflect the high tariffs, adding to clothing costs. And in any case, domestic sales of clothing will not benefit from duty drawback which could also affect overall export competitiveness.
7.15 On the other hand, domestic taxes also favor cotton-based production rather than production based on man-made fibers with 7.5 per cent tax on the former and 8.4 per cent on the latter. A similar problem also afflicts footwear production with taxes of 20.5 per cent on leather and 27 per cent on non-leather footwear (Table 5). To this end,
Figure 5. Share of Global Exports of Cotton and Man Made Fibers, Fabrics & Apparels (per cent)
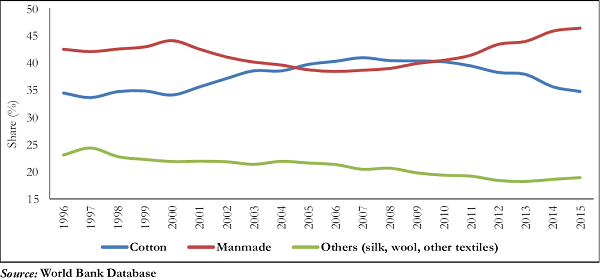
there is a need to undertake rationalization of domestic policies which are inconsistent with global demand patterns.
Table 5. Effective Rates of Taxation for Apparels and Footwear (%)
| Effective Tax Rates* (%) |
|
| Cotton Apparel | 7.5 |
| Man Made Apparel | 8.4 |
| Leather Footwear | 20.5 |
| Non Leather Footwear | 27.0 |
Source: Industry Estimates
Note: *Estimates could vary across states and across individual items because of varying input-output relationships.
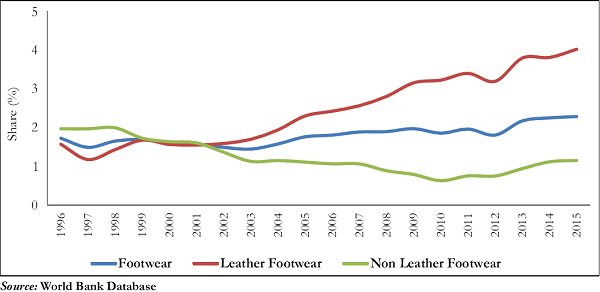
7.16 The global demand for footwear is shifting away from leather footwear and towards non leather footwear (Table 6). This shift can be attributed to a host of factors like physical comfort, aesthetics and price affordability which work in favor of non-leather shoes as opposed to leather shoes. India traditionally has been an exporter of leather footwear. Its share of leather footwear exports in the world market is more than double the share of non-leather footwear
(Figure 6). Efforts are required to promote non-leather footwear to be able to effectively capture world market share particularly in view of China’s slowdown of exports.
Table 6. Share of global exports of leather & non leather footwear (per cent)
| Year | Leather footwear | Non leather footwear |
| 2004 | 55.0 | 45.0 |
| 2005 | 55.5 | 44.5 |
| 2006 | 55.1 | 44.9 |
| 2007 | 55.0 | 45.0 |
| 2008 | 52.6 | 47.4 |
| 2009 | 50.0 | 50.0 |
| 2010 | 47.2 | 52.8 |
| 2011 | 45.6 | 54.4 |
| 2012 | 43.2 | 56.8 |
| 2013 | 43.2 | 56.8 |
| 2014 | 42.1 | 57.9 |
| 2015 | 39.5 | 60.5 |
Source: World Bank Database
Discrimination in export markets
7.17 India’s competitor exporting nations for apparels and leather and footwear enjoy
Figure 6. India’s global share of leather and non-leather
footwear exports (per cent)
better market access by way of zero or at least lower tariffs in the two major importing markets, namely, the United States of America (USA) and European Union (EU). Tables 7 & 8 show the average tariffs faced by Indian exporters in these markets vis-à-vis our competitors. In the EU, Bangladesh exports enter mostly duty free (being a Less Developed Country (LDC)), while Indian exports of apparels face average tariffs of 9.1 per cent. Vietnam could also attract zero tariffs once the EU – Vietnam Free Trade Agreement (FTA) comes into effect. In the US, India faces tariff of 11.4 percent. Ethiopia, which is an emerging new competitor in apparels and leather, enjoys duty free access in US, EU and Canada.
Table 7. Tariff faced by Indian Apparel Exports (HS Code 61&62)
| European Union | Canada | per cent) United States | |
| Bangladesh | 0 | 0 | 11.9 |
| China | 11.4 | 16.5 | 11.4 |
| Ethiopia | 0 | 0 | 0 |
| India | 9.1 | 16.5 | 11.4 |
| Indonesia | 9.2 | 16.4 | 11.6 |
| Vietnam | 9.2 | 16.2 | 11.6 |
Source: World Bank Database
7.18 Indian leather exports also face high tariffs in partner country markets in exports of leather goods and non-leather footwear, with considerable added disadvantage in Japan.
7.19 An FTA with EU and UK will help. In the case of apparels, it will offset an existing disadvantage for India relative to competitors- Bangladesh, Vietnam and Ethiopia which already enjoy better market access. In the case of leather, the FTA might give India an advantage relative to competitors. In both cases, the incremental impact would be positive.
B. SECTOR SPECIFIC CHALLENGE – LEATHER AND FOOTWEAR SECTOR
Comparative advantage in cattle
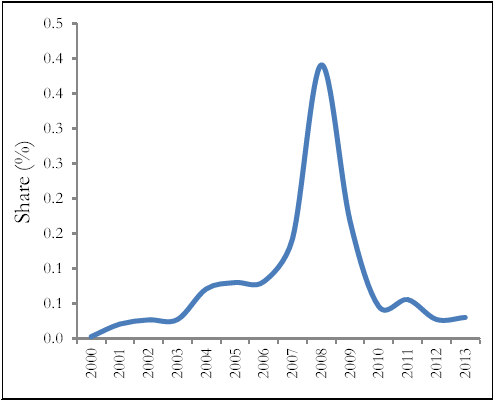
7.20 The leather and footwear industry uses raw hides and skins of a number of animals like cattle, buffalo, goat, sheep and other smaller animals as its chief raw material. Amongst these, leather made from cattle hides has greater global demand owing to its strength, durability and superior quality. It is estimated that cattle-based global exports dominate buffalo-based exports by a factor of 8-9. However, despite having a large cattle population, India’s share of global cattle population and exports of cattle hides is low and declining (Figure 7 & 8). This trend can be attributed to the limited availability of cattle for slaughter in India, thereby leading to loss of a potential comparative advantage due to underutilization of the abundantly available natural resource.
Table 8. Tariffs faced by Indian Leather and Footwear Exports (per cent)
European Union |
Japan |
United States |
|||||||
Leather Goods |
Leather Footwear |
Non Leather footwear |
Leather Goods |
Leather Footwear |
Non Leather footwear |
Leather Goods |
Leather Footwear |
Non Leather footwear |
|
Bangladesh |
0 |
0 |
0 |
3.1 |
0 |
4.1 |
7.9 |
5.0 |
12.0 |
China |
4.6 |
7.9 |
12.0 |
10.1 |
25.1 |
12.6 |
7.3 |
4.3 |
13.9 |
Ethiopia |
0 |
0 |
0 |
8.8 |
0 |
– |
1.0 |
0 |
0 |
India |
1.0 |
4.4 |
7.5 |
5.7 |
24.3 |
13.3 |
5.5 |
4.7 |
12.2 |
Indonesia |
1.0 |
4.4 |
7.5 |
1.7 |
25.0 |
10.0 |
5.8 |
5.0 |
13.4 |
Vietnam |
1.1 |
4.4 |
7.5 |
3.9 |
25.0 |
11.4 |
7.6 |
4.3 |
12.7 |
Source: World Bank Database
Figure 7. Global Share of Indian Figure Cattle Population (per cent)
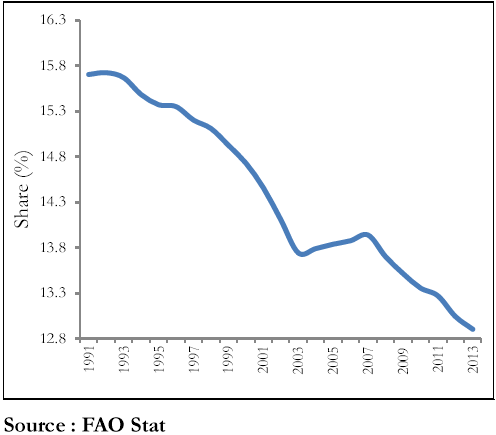
Figure 8. India’s Share of Global Exports of Cattle Hides and Skins (per cent)
IV. POLICY RESPONSE AND CONCLUSIONS
7.21 Several measures form part of the package approved by the Government for textiles and apparels in June 2016. Their rationale is to address the challenges described above. The policies suggested do not address all the challenges highlighted above but will go a long way in strengthening India’s apparel industry. Apparel exporters will be provided relief to offset the impact of state taxes embedded in exports, which could be as high as about 5 per cent of exports. Similar provisions for leather exporters would be useful. This is not a subsidy but really a drawback scheme that should be WTO-consistent because it offsets taxes on exports.
7.22 Next, textile and apparel firms will be provided a subsidy for increasing employment. This will take the form of government contributing the employers’ 12 per cent contribution to the Employee Provident Fund (EPF) (the Government is already committed to contributing 8.3 per cent; so the new measure will be additional to that).
7.23 But these need to be complemented by further actions. The government is taking very seriously the impact of Indian exporters being disadvantaged in foreign markets. India will still need to carefully weigh the benefits and costs of negotiating new Free Trade Agreements, such as, with the European Union (EU) and the United Kingdom (UK). But in this calculus, the impact on export-and job-creating sectors such as apparels and maybe also leather products compared to other sectors should receive high priority. Based on recent in- house analysis in 2016, it is estimated that an FTA with the EU and UK can lead to 108029, 23156, and 14347 additional direct jobs per annum in the apparel, leather and footwear sectors respectively (Table 9). Many more indirect jobs could be added, although these are more difficult to estimate.
7.24 Second, the introduction of the Goods and Service Tax (GST) offers an excellent opportunity to rationalize domestic indirect taxes so that they do not discriminate in the case of apparels against the production of clothing that uses man-made fibers; and in the case of footwear against the production of non-leather based footwear (if there is such a discrimination).
Table 9. Potential additional jobs with India – EU/UK FTA Apparels Leather Goods Footwear
Apparels |
Leather Goods |
Footwear |
||||
Incremental Exports ($Mn) |
Gain in Employment (Nos.) |
Incremental Exports ($Mn) |
Gain in Employment (Nos.) |
Incremental Exports ($Mn) |
Gain in Employment (Nos.) |
|
EU |
1483.6 |
76853 |
416.9 |
18542 |
217 |
9966 |
UK |
603.3 |
31176 |
103.8 |
4615 |
95.3 |
4381 |
Total |
2086.9 |
108029 |
520.7 |
23156 |
312.3 |
14347 |
7.25 Third, a number of labor law reforms would overcome obstacles to employment creation in these sectors, some of which include the following:
- Low Wage Employees (people with less than Rs 20,000 salary per month) only receive 55 percent of their salary because 45 per cent goes to statutory deductions like Employee Provident Fund Organisation (EPFO), Employee Pension Scheme (EPS), Labour Welfare Fund (LWF), Employees’ Deposit Linked Insurance Scheme (EDLI), and Employee State Insurance (ESI) etc.
- Low wage employees do not have a 45 per cent savings rate and therefore they may prefer to receive these contributions today than benefit from them tomorrow.
- The two largest deductions of Provident Fund and ESI may not result in the best value for money for employees. The EPFO has 40 million account with unclaimed balances and charges 3.3 per cent of contributions as fees (amongst the highest in the world). ESI only pays out about 45 per cent of contributions received as benefits (few other private or public health insurance policy in India has a claims ratio of less than 90 per cent).
7.26 Formal employment could increase by offering employees three choices when they start employment:
- decide whether they want 12 per cent employee contribution to be deducted.
- decide whether their 12 per cent employer contribution goes to EPFO or National Pension Scheme (NPS).
- decide whether their health insurance premiums go to ESI or a private health insurance of the employee’s
7.27 This choice should be exercised by employees – not employers– and today’s status quo should continue to be available to all employees. The key point is to offer choice to employees, which will also result in competition for service providers such as the EPFO and ESI.
7.28 Thus, more FTAs, GST-induced tax rationalization, and labour law reform would add considerably to the job creation potential of the clothing and footwear sectors. All industrial policy aimed at promoting particular sectors is not without risks. But the externality generating attributes-employment, exports, social transformation – of the apparel and footwear sectors, India’s potential comparative advantage in it, and the narrow window of opportunity available, make the risk worth taking. And, in any case, many of the proposed policy responses such as FTAs, tax rationalization, and labour law reform could have wider, economy-wide benefits.
REFERENCES
1. Government of India (22nd June 2016), Ministry of Textiles, PIB “Cabinet Approves Special Package for
Employment Generation and Promotion of Exports in Textiles and Apparel Sector”
2. Government of India, , Ministry of Commerce, Council For Leather Exports Database
3. Food and Agriculture Organisation (FAO), Stat
4. FAO, World Statistical Compendium for raw hides and skins, leather and leather footwear 1993 – 2012
5. Simon Johnson & Jonathan D Ostry & Arvind Subramanian, (2010). “Prospects for Sustained Growth in Africa:
Benchmarking the Constraints,” IMF Staff Papers, vol 57(1)
6. World Bank, World Integrated Trade Solutions
7. World Trade Organisation Database
8. World Bank (2016) “Stiches to Riches? Apparel Employment, Trade, and Economic Development in South Asia”.


