Internal audit has progressively evolved from a compliance-oriented function to a value-adding activity that ensures effective governance, risk management, and financial control. Financial management concepts are highly relevant for internal auditors, as they enable a professional understanding of how efficiently resources are deployed in an organisation. This article critically analyses the use of financial management concepts such as inventory management, cash management, receivable management, capital management, and capital budgeting in internal audit. The discussion is supplemented with corporate case studies, real-life examples, and numerical illustrations to explain practical complexities. The target audience is qualified chartered accountants.
1. Role of Financial Management in Internal Audit
Internal audit is no longer restricted to traditional checks of compliance but has assumed a larger strategic role in assessing how an entity deploys, manages, and safeguards financial resources. Financial management concepts serve as the analytical backbone of such assessment. The auditor’s task is to evaluate whether management has ensured optimal utilisation of funds while balancing profitability, liquidity, and solvency.
The role of financial management in internal audit can be grouped under three areas:
(a) Efficiency of operations – measured by cost controls, productivity, and financial ratios;
(b) Risk management – covering liquidity risk, credit risk, operational risk, and market risk;
(c) Strategic alignment – ensuring that financial practices align with organisational objectives.
For example, in a large PSU bank, internal auditors applied financial management principles by reviewing loan portfolio concentration. Using risk-adjusted return on capital (RAROC), the auditors established that certain sectors were yielding lower risk-adjusted returns compared to safer alternatives. Recommendations resulted in a shift of exposure, which increased profitability without adding significant credit risk.
2. Inventory Management and Internal Audit
Inventory constitutes a significant component of working capital in manufacturing and trading organisations. Internal audit of inventory management evaluates adequacy of controls around procurement, storage, consumption, and valuation. Auditors apply financial management concepts such as Economic Order Quantity (EOQ), Just-in-Time (JIT), and ABC analysis to determine efficiency.
Case Study: A textile mill in Surat maintained high levels of raw cotton inventory due to fear of price volatility. Internal auditors compared actual holding cost with carrying cost assumptions under EOQ. It was revealed that the mill’s carrying cost exceeded 22% of inventory value, against industry norms of 12–15%. By recommending improved procurement planning and supplier contracts, auditors facilitated an annual saving of INR 4.5 crores.
Numerical Illustration:
Suppose annual demand = 12,000 units; ordering cost per order = INR 2,000; carrying cost per unit per year = INR 50.
EOQ = √(2 × Demand × Ordering cost / Carrying cost)
= √(2 × 12,000 × 2,000 / 50)
= √(480,000) ≈ 693 units.
The audit highlighted that the company was ordering 2,000 units per order, locking excess funds in stock. Aligning orders with EOQ helped free INR 1.2 crores of working capital.
3. Cash Management and Internal Audit
Cash is the most liquid asset, and poor cash management can result in liquidity crises even in profitable firms. Internal auditors assess adequacy of cash forecasting, bank reconciliations, idle cash levels, and treasury operations. Financial management tools like cash budget, float analysis, and working capital ratios are applied.
Case Study: An automobile manufacturer had cash surpluses in some accounts while availing costly working capital loans. Internal audit mapped daily cash balances across 15 bank accounts and recommended a centralised treasury pooling system. The outcome was a reduction in borrowing costs by INR 7 crores annually.
Numerical Illustration:
If a firm maintains INR 20 crores as average idle cash earning 2% savings rate, while simultaneously paying 9% interest on overdraft of INR 15 crores, the opportunity loss = (20 crores × 9%) – (20 crores × 2%) = INR 1.4 crores annually.
4. Receivable Management and Internal Audit
Receivables are critical to liquidity. Ineffective receivable management creates lock-up of funds and enhances credit risk. Internal auditors examine credit appraisal, debtor ageing, collection efficiency, and provisioning policy. Ratios such as Debtor Turnover Ratio and Average Collection Period are vital indicators.
Case Study: A consumer durable company had an average collection period of 95 days compared to industry average of 60 days. Audit analysis revealed that the sales team was incentivised on gross sales, not collections. Change in policy aligned incentives with collections, reducing receivable days to 65 and releasing INR 35 crores of blocked funds.
Numerical Illustration:
Annual credit sales = INR 360 crores. Average receivables = INR 90 crores.
Debtor Turnover Ratio = 360 / 90 = 4 times. Average Collection Period = 365 / 4 = 91 days.
Recommendation: By reducing to 60 days, the company could release 30 crores in cash.
5. Capital Management and Internal Audit
Capital management involves maintaining the right mix of debt and equity while ensuring solvency and cost efficiency. Internal audit evaluates capital adequacy, leverage ratios, compliance with covenants, and dividend policies.
Case Study: A listed infrastructure company had debt-equity ratio of 3:1, leading to high interest coverage risks. Internal auditors recommended refinancing with longer maturity bonds and partial equity infusion. Within two years, debt-equity reduced to 1.8:1 and rating improved from BBB to A.
Numerical Illustration:
EBIT = INR 200 crores; Interest = INR 120 crores. Interest coverage = 200 / 120 = 1.67 times, below safe level of 3 times. Audit recommendation: reduce debt by 200 crores to achieve coverage above 3.
6. Capital Budgeting and Internal Audit
Capital budgeting decisions affect long-term financial health. Internal auditors review whether appraisal techniques like NPV, IRR, and Payback are applied appropriately and whether assumptions are reasonable.
Case Study: A pharma company invested INR 500 crores in a new plant assuming 18% IRR. Audit review of sensitivity analysis showed that if regulatory approval delayed by one year, IRR would fall to 9%, below cost of capital. Recommendation: phased investment with milestone-based funding. This saved the company from potential cash flow stress.
Numerical Illustration:
Project cost = INR 100 crores; expected annual inflow = INR 30 crores for 5 years; discount rate = 10%.
NPV = 30 × PVIFA(10%,5) – 100.
PVIFA(10%,5) = 3.791. NPV = 30 × 3.791 – 100 = 13.73 crores (positive, hence acceptable).
7. Integration of Financial Ratios in Audit Procedures
Internal auditors use financial ratios as diagnostic tools. Liquidity ratios (Current, Quick), solvency ratios (Debt-Equity, Interest Coverage), efficiency ratios (Inventory Turnover, Receivable Turnover), and profitability ratios (ROCE, ROI) help in identifying red flags.
For instance, a sudden fall in Gross Profit Ratio may indicate inventory obsolescence or revenue recognition issues. Internal auditors supplement ratio analysis with data analytics for trend identification across divisions.
8. Case Studies and Real-Life Examples
Case Study 1: Infosys implemented a centralised treasury for global cash management. Internal audit noted that idle funds were reduced by USD 250 million, directly enhancing shareholder value.
Case Study 2: Maruti Suzuki introduced a receivable discounting program for dealers. Internal audit confirmed significant reduction in average collection period, thereby improving liquidity.
Case Study 3: A steel manufacturer in Chhattisgarh faced losses due to improper capital budgeting. The audit found that project IRR was overstated by ignoring exchange rate fluctuations on imported machinery. Correction in methodology prevented replication of error in future expansions.
9. Numerical Illustrations of Complexities
Illustration 1: Working Capital Cycle
Raw Material Days = 40; WIP Days = 15; FG Days = 20; Receivable Days = 50; Payable Days = 30.
Operating Cycle = 40 + 15 + 20 + 50 – 30 = 95 days.
Audit recommendation: reduce receivable days by 15 to shorten cycle to 80.
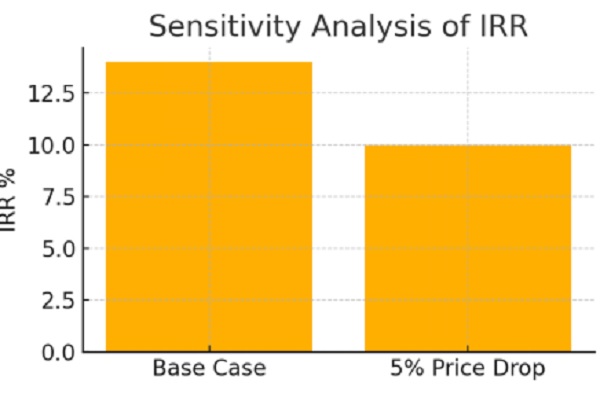
Illustration 2: Sensitivity in Capital Budgeting
Project IRR = 14%. If sales price drops 5%, IRR falls to 10%. Internal audit highlights need for contingency buffers in projections.
10. Conclusion
Financial management concepts provide internal auditors with powerful analytical tools to assess efficiency, liquidity, and solvency. Integration of these concepts into audit programs ensures that auditors do not merely detect compliance lapses but also contribute to strategic decision-making. By applying tools like EOQ, NPV, IRR, working capital ratios, and sensitivity analysis, internal audit transforms into a function that safeguards assets while enhancing value
For qualified chartered accountants, mastery over these financial management techniques is essential to perform high-quality internal audits that command management respect and directly influence corporate performance.
Table: EOQ Calculation Example
| Annual Demand | 12,000 units |
| Ordering Cost per Order | INR 2,000 |
| Carrying Cost per Unit per Year | INR 50 |
| EOQ | 693 units |
Table: Receivables Ageing Analysis
| Age Bracket | Amount (INR Crores) | Percentage |
| 0-30 days | 40 | 44% |
| 31-60 days | 25 | 28% |
| 61-90 days | 15 | 16% |
| >90 days | 10 | 12% |
Chart: Working Capital Cycle Components

Chart: Sensitivity Analysis of IRR