What is a Pivot table?
Table in Excel is a conventional form where we have the rows and columns of the data as in raw form with a little scope such as filter, sort ,etc. There is no scope for turning down the data into meaningful insights and summary. ‘Pivot’ means to turn or change the direction of something. Meaning this Pivot Table is an extremely useful feature where Data can be presented in a more flexible manner and advanced features with easy handling.
Defining it is a statistics tool that summarizes and reorganizes selected columns and rows of data in a spreadsheet or database table to obtain a desired report. The tool does not actually change the spreadsheet or database itself, it simply “pivots” or turns the data to view it from different perspectives.
How to Insert Pivot Table?
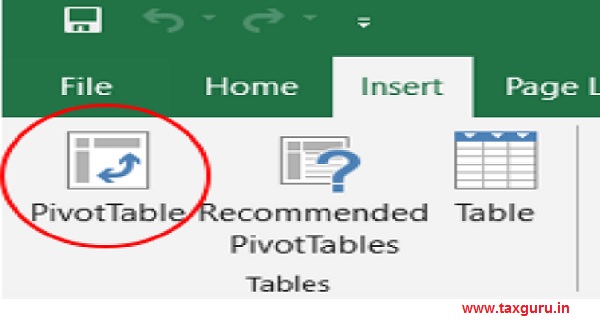
i) Click on the Pivot Table From Insert

ii) Select the Data for which you want to use the Pivot Table Feature in the “Table/Range”
iii) Select also where the pivot Table to be located. Either in a new worksheet or a cell in the Existing Worksheet.
Trick: Select the data to which you want to insert a pivot table and try Alt + N + V
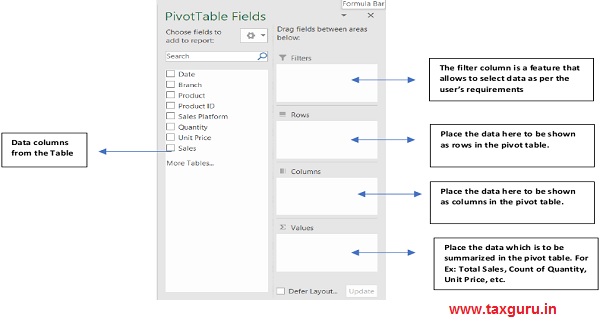
Nuts and Bolts of a Pivot Table- Pivot Table Fields:
Salient Features of Pivot Table:
Slicers:
Under the ‘Analyse tab of PivotTable tools’ we have slicer option. Slicers are a powerful new way to filter pivot table data.
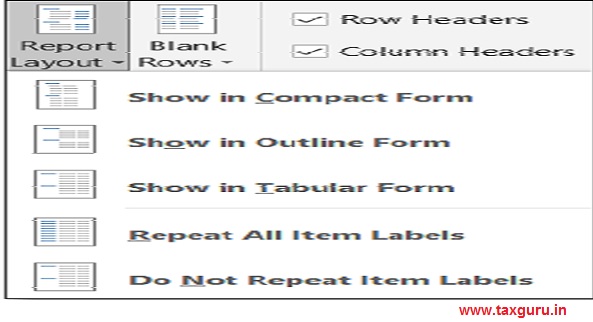
Report Layouts:
Pivot Table provides you the option of different types of Report Layout. It is found under the ‘Design Tab of PivotTable Options’. The Compact Form layout may be useful when you want to reduce the pivot table width, and aren’t concerned about the Row field headings. The Outline Form layout may be useful when you want to show all the field names as heading labels and aren’t concerned about the width of the pivot table. The Tabular Form layout may be useful when you want to show all the field names as heading labels and aren’t concerned about the width of the pivot table but want to reduce the number of rows. Further there is a option of ‘Repeat and Do Not Repeat Item Labels’ where the user can opt whether the group Name to be repeated for all the sub-group rows.
Grand Totals and Sub-Totals:
These can be found under the Design Tab under the ‘PivotTable Tools’. Grand Totals can be opted for the rows and columns as per the user requirements. Subtotals can be turned on or off and provides the option of whether to show at the top or bottom of the groups.

Value Field Settings:
The value field settings can be found in the drop down list of the Values Fields. This option provides the option of summarizing the values by number of calculations such as sum, count, average, max, product, etc as required. The column can be named and the appropriate format can be used.
In Addition the values can be shown as % of Grand Total, Row Total, Column Total, or any custom base as per the user’s requirement.
Tricks: When you are using a Pivot Table in Excel and want to know what data makes up a certain value, all you have to do is double click on that cell. This will open up a brand new Sheet with all the rows of data that make up that value.
Use Cases:
Pivot Table can be used for any data with proper titled column headings. The benefits can be harnessed by using the features of ‘PivotTable Tools’.
From a basic table which contains the sales details of an organization which has branches in different cities, selling different product categories on different platforms the following various types of pivot table can be used.(The following examples are not exhaustive of the available features)
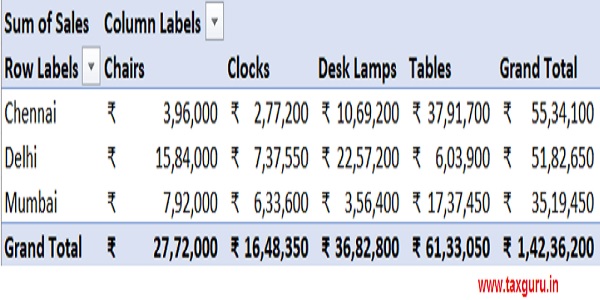
1. Sales summary of Products Categories across Branches:
2. Break Down of Different Product types sales across the branches:

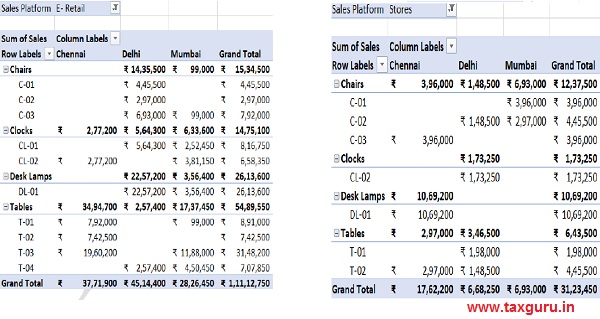
3. Using filters to summarize the sales via stores and E-Retail platforms:
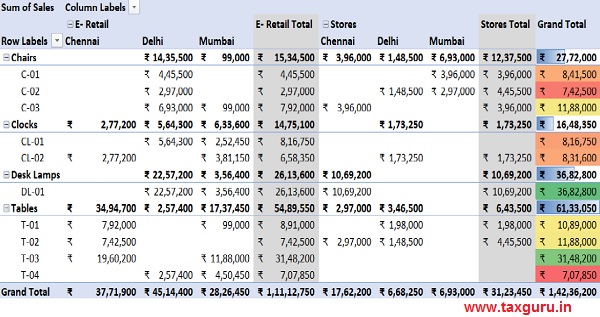
4. The complete summary of the data with conditional formatting for Total Sales:
Stratification using Pivot Table:
Stratification means to sort data/people/objects into distinct groups or layers. We need to sort the data based on our needs in order to do stratification in a Pivot table. It can be done in two ways
1. By classifying directly in the data form or
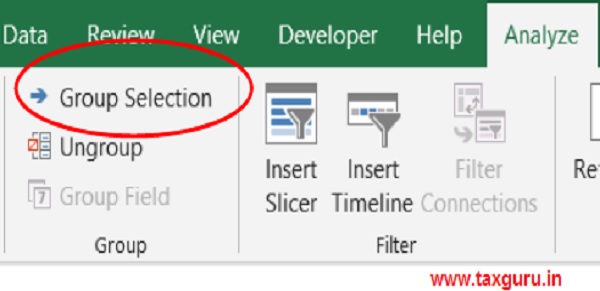
2. By using the ‘Grouping Selection’ feature in pivot table.
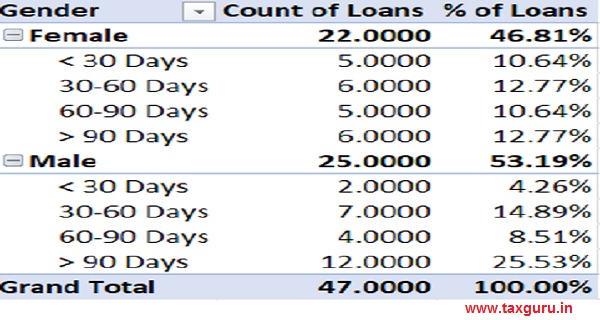
The below is a case of stratifying the loans receivable based on their no of days after the last payment.
How to get a effective sample of the population?
1. Try to classify the population based on an effective category with the help of grouping option under the PivotTable Tools . It can be more than one category.
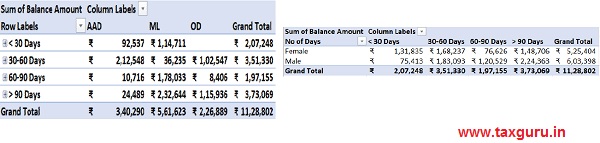
2. Using the value field settings, summarize the data with operations such as count, sum, product, etc and present the values as form of percentage under the ‘show values as‘
In order to get the detailed data of selected sample Double click the cell in Pivot Table
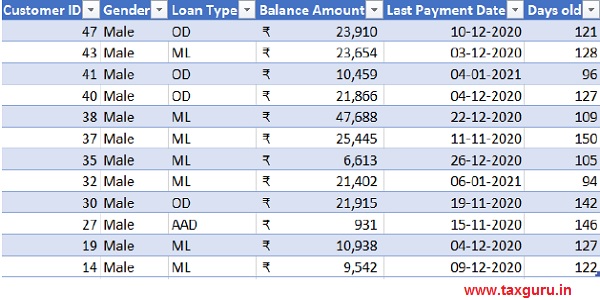
Selecting the Male Category with loans repayment date > 90 days
*****
Compiled by CA Narasimhan Elangovan with inputs from Nakul Pranav, team KEN & Co.
Disclaimer : This publication contains information in summary form and is therefore intended for general guidance only. All information is provided in good faith. KEN & Co. makes no representation or warranty of any kind, express or implied, regarding the accuracy, adequacy, validity, reliability, availability, or completeness of any information provided. It is not intended to be a substitute for detailed research or the exercise of professional judgment.

Author Bio