Consumer price inflation in India went through three phases in 2022. A rising phase up to April 2022 when it crested at 7.8 per cent, then a holding pattern at around 7.0 per cent up to August 2022 and then a decline to around 5.7 per cent by December 2022. The rising phase was largely due to the fallout of the Russia-Ukraine war and a shortfall in crop harvests due to excessive heat in some parts of the country. Prompt and adequate measures by the Government of India and the Reserve Bank of India (RBI) have reined in the rise in inflation and brought it within the Central Bank’s tolerance limit. In contrast, major Western countries, which pumped stimulus during the pandemic periods, continue to grapple with high levels of inflation.
The divergence between a relatively high Wholesale Price Index (WPI) inflation and lower Consumer Price Index (CPI) inflation widened in May 2022 primarily owing to a difference in relative weights of the two indices and the lagged effect of imported input costs on retail prices. However, the gap between the two measures of inflation has reduced since then, demonstrating a tendency towards convergence. An important measure of demand-pull inflation – core inflation – remains sticky. There have been significant variations in retail inflation rates among the States and Union Territories (UTs) of India.
According to Housing Price Index (HPI) published by National Housing Bank (NHB), the overall increase in composite HPI assessment and HPI market price in Quarter Ending (QE) September 2022 over QE September 2021 indicates a revival in the housing finance sector.
RBI’s Monetary Policy Committee increased the policy repo rate under the liquidity adjustment facility (LAF) by 225 basis points from 4.0 per cent to 6.25 per cent between May and December 2022. Central Government has undertaken fiscal measures like reduction in excise duty on petrol and diesel, prohibition of the export of wheat products, imposition of export duty on rice, reduction in import duties and cess on pulses, rationalisation of tariffs and imposition of stock limits on edible oils and oil seeds, maintenance of buffer stock for onion and pulses and rationalisation of import duties on raw materials used in the manufactured products.
The RBI forecasts elevated domestic prices for cereals and spices in the near term, owing to supply shortages. Milk prices are also expected to spike, reflecting high feed costs. In general, climate across the world has become increasingly erratic, further fortifying upside risks to food prices. A lot depends on industrial input prices: they may ease, but on the flip side, their delayed pass-through to consumer prices may contribute to the stickiness of core inflation.
In general, the year 2022 was marked by a return of high inflation in the advanced world after three to four decades, depending on the country. In India, the government and the central bank took decisive measures to cap the rise in prices. India’s retail inflation rate peaked at 7.8 per cent in April 2022. The overshoot of inflation above the upper end of the target range in India was one of the lowest in the world. We are confident that authorities would remain vigilant and be as proactive as they were in 2022 should inflation pressures re-emerge in India in 2023.
Introduction
5.1 Rising prices are always a cause of concern for policymakers as they hurt the common man the most. The perils of inflation are felt more in developing economies, where necessities have a higher share in the consumption basket than in developed countries. In recent years, India’s inflation rate has been well-behaved, lying tamely below the RBI target rate of 4 per cent from 2017 to 2019.
5.2 In 2020, supply-side disruptions pushed inflation beyond the RBI’s upper tolerance limit of 6 per cent. The pandemic delivered a larger shock on supply than it did on demand, through supply-chain disruptions in the case of essential goods, food, medicine and industrial goods. In turn, this aggravated cost-push inflation in the country.
5.3 As the pandemic receded, the conflict in Russia-Ukraine broke out, bringing in its wake worldwide inflation, fuelled mostly by surging prices of crude oil and other commodities. Prices soared to a decadal high and ate into household budgets, in turn prodding Central Banks to tighten monetary policy. A convalescing world economy was left to confront unprecedented rates of inflation. The spectre of stagflation loomed large on the horizon. In response, developed economies were left with no option but to raise interest rates. As the US Federal Reserve raised rates, the US dollar appreciated, making dollar-denominated fuel imports even dearer.
5.4 In advanced economies, the rate of inflation is projected by the International Monetary Fund (IMF) to increase from 3.1 per cent in 2021 to 7.2 per cent in 2022, the highest since 1982. The Euro area saw the rate reach 10.0 per cent in September 2022 (WEO, October 20221). The US inflation reached its 40-year high at 9.1 per cent in June 2022 before moderating to 6.5 per cent in December 2022, while the UK saw an annual price rise of 9.2 per cent in December 2022. Germany witnessed inflation of 8.6 per cent in December 2022. Among emerging markets, Brazil saw a moderation in price trends, while Turkey’s inflation was above 80 per cent from August to November 2022 before declining slightly to 64.3 per cent in December 2022. The war had compounded the effects of a strong recovery in demand for goods and services after the pandemic. The inflation rate in Emerging Markets and Developing Economies (EMDEs) is anticipated to have increased from 5.9 per cent in 2021 to 9.9 per cent in 2022 (WEO, October 2022).
Figure V.1: Record Consumer Price Inflation in 2022 Calendar Year

Source: World Economic Outlook, October 2022, IMF
Note: *The figure are annual averages; figures for 2022 and 2023 are projections.
Advanced Economies include 40 economies and EMDEs include 156 economies as per IMF classification
Figure V.2: High Consumer Price Inflation in Advanced Economies

Source: OECD
5.5 The groundwork for the commendable inflation management in India was laid earlier as fiscal and monetary measures adopted to stave off the pandemic-induced economic woes were prudent and well-calibrated. India chose not to overstimulate, and hence price pressures due to the Russia Ukraine conflict could be contained. Excessive heat in summer and uneven rainfall thereafter in some parts of the country affected the farm sector, reducing supply and causing prices of some major products to rise. India’s inflation rate peaked in April 2022 at 7.8 per cent before moderating to 5.7 per cent in December 2022 on the back of good monsoons as well as prompt government measures that ensured adequate food supply. Global economic slowdown and interest rate increases brought down commodity prices, contributing to a substantial decline in wholesale price inflation. Thus, input price pressures on Indian manufacturers abated.
5.6 Even as inflation abated at the wholesale level, there has been a pass-through of previously high input costs onto retail prices. Core inflation remains sticky at nearly 6 per cent and reflects the second-round effects of the supply shocks witnessed earlier this year. Further, with the recovery of demand, there has been a pickup in service inflation. Against this backdrop, we discuss trends and drivers of retail and wholesale price inflation in FY22 and FY23, state-wise and rural-urban differential in consumer inflation, fuel price inflation, CPI and WPI convergence, housing prices, pharmaceutical pricing and fiscal as well as monetary policy measures undertaken to contain inflation as the chapter proceeds.
Domestic Retail Inflation
Headline Inflation Declined from its Peak
5.7 FY22 witnessed lower CPI-Combined (CPI-C) based retail inflation as compared to FY21. Even so, inflation remained on the higher side when compared to the moderation seen during the years prior to the pandemic. During FY22, some sub-groups such as ‘oils & fats’, ‘fuel & light’ and ‘transport & communication’ reported high inflation. This was mainly driven by supply disruptions caused by pandemic-induced lockdowns. The subsequent year (FY23) began with the Russia-Ukraine crisis that led to high headline inflation rate in April 2022.
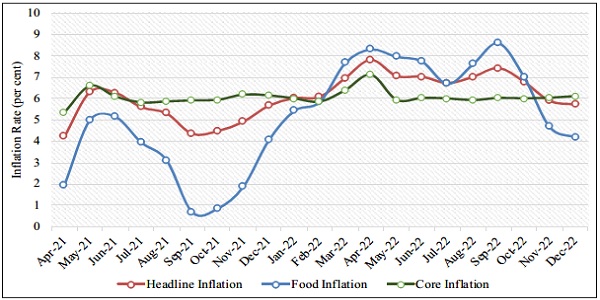
5.8 In FY23, retail inflation was mainly driven by higher food inflation, while core inflation stayed at a moderate level. Food inflation ranged between 4.2 per cent to 8.6 per cent between April and December 2022, while the core inflation rate stayed at around 6 per cent except in April 2022.
Table V.1: Average Annual Retail Inflation Based on CPI-C (per cent) (base: 2012=100)
| Groups/Sub-groups | Weight | FY20 | FY21 | FY22 | FY23* |
| Food & beverages | 45.9 | 6.0 | 7.3 | 4.2 | 7.0 |
| Cereals and products | 9.7 | 2.8 | 3.8 | 0.5 | 9.3 |
| Meat and fish | 3.6 | 9.3 | 15.4 | 7.9 | 4.7 |
| Egg | 0.4 | 4.5 | 12.9 | 7.6 | -1.0 |
| Milk and products | 6.6 | 2.9 | 5.4 | 2.8 | 6.8 |
| Oils and fats | 3.6 | 2.9 | 16.0 | 27.4 | 5.4 |
| Fruits | 2.9 | 0.7 | 2.6 | 6.2 | 4.4 |
| Vegetables | 6.0 | 21.3 | 5.8 | -7.2 | 7.6 |
| Pulses and products | 2.4 | 9.9 | 16.4 | 6.0 | 1.8 |
| Sugar and confectionery | 1.4 | 0.8 | 2.5 | 2.3 | 2.7 |
| Spices | 2.5 | 4.4 | 10.9 | 5.3 | 14.9 |
| Pan, tobacco & intoxicants | 2.4 | 4.2 | 9.9 | 4.5 | 2.0 |
| Clothing & footwear | 6.5 | 1.6 | 3.4 | 7.2 | 9.7 |
| Housing | 10.1 | 4.5 | 3.3 | 3.7 | 4.1 |
| Fuel and light | 6.8 | 1.3 | 2.7 | 11.3 | 10.5 |
| Miscellaneous | 28.3 | 4.4 | 6.6 | 6.7 | 6.3 |
| Household goods and services | 3.8 | 3.1 | 3.0 | 5.8 | 7.5 |
| Health | 5.9 | 6.2 | 5.1 | 7.5 | 5.8 |
| Transport and communication | 8.6 | 2.4 | 9.9 | 10.1 | 6.4 |
| Recreation and amusement | 1.7 | 4.9 | 5.1 | 6.5 | 6.4 |
| Education | 4.5 | 5.5 | 2.8 | 2.9 | 5.2 |
| Headline Inflation | 100.0 | 4.8 | 6.2 | 5.5 | 6.8 |
| Core Inflation | 47.3 | 4.0 | 5.5 | 6.0 | 6.1 |
| Food Inflation | 39.1 | 6.7 | 7.7 | 3.8 | 7.0 |
Source: MoSPI,
Note: *April-December, CPI data for December 2022 are provisional
Figure V.3: Declining Food Inflation but Sticky Core Inflation
Retail Inflation Driven by Food Commodities
5.9 Retail price inflation mainly stems from the agriculture and allied sector, housing, textiles, and pharmaceutical sectors. Further, the global spillovers, representing the imported inflation channel, driven by price pressures in energy, mining, chemicals, trade, basic and machinery,2 reaches the retail segment mainly through the wholesale price inflation. During FY23, ‘food & beverages’, ‘clothing & footwear’, and ‘fuel & light’ were the major contributors to headline inflation– the first two contributing more this fiscal than in the previous one.
5.10 Within the ‘miscellaneous’ group, high inflation was observed in subgroups ‘household goods and services’ and ‘personal care and effects’ owing to the revival of consumer demand in the post-Covid-19 period. Moreover, retail inflation in the ‘health’ sub-group moderated in the current financial year as compared to FY22. However, inflation in the ‘education’ subgroup surged on account of schools reopening for in-person classes after the pandemic.
Figure V.4: Retail Inflation Driven by ‘Food and Beverages’ Group

Source: MoSPI
Note: *April-December
Food Inflation Caused by Vegetables and Cereals in FY23
5.11 Food inflation based on Consumer Food Price Index (CFPI) climbed to 7.0 per cent in FY23 from 3.8 per cent in FY22. Though the increase in food inflation is broad-based, the major contributors are vegetables, cereals, milk and spices. The RBI forecasts elevated domestic prices for cereals and spices in the near term, owing to supply shortages. Milk prices are also expected to spike reflecting high feed costs. Since September 2022, double-digit inflation was observed in cereals. To check the soaring prices of wheat and rice, the government has prohibited the export of wheat products under HS Code 1101 and imposed an export duty on rice. Further, in order to insulate vulnerable sections from the rise in prices, the Government has launched a new integrated food security scheme, ‘Pradhan Mantri Garib Kalyan Ann Yojana’ on 1 January 2023, to provide free foodgrains to more than 80 crore beneficiaries.
Figure V.5: Retail Inflation in Major Groups/Sub-groups

Source: MoSPI
Figure V.6: Drivers of Food Inflation in FY23* – Vegetables, Cereals, Milk and Spices

Source: MoSPI
Note: *April-December
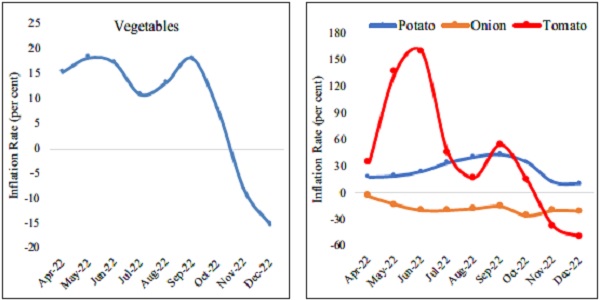
5.12 High inflation in vegetables from April to September 2022 was mainly due to a spike in prices of tomatoes owing to crop damage and supply disruption due to the unseasonal heavy rains in the major producing states of Karnataka, Tamil Nadu, Andhra Pradesh, and Telangana.
Figure V.7: Spike in Tomato Price and ‘Vegetables’ Inflation in FY23
Source: MoSPI
5.13 Inflation in pulses remained muted owing to higher production and measures taken by the government in terms of maintaining a buffer stock and reduction of import duties and cess on pulses.
5.14 International prices of edible oils surged in FY22 owing to a shortfall in global production and an increase in export tax levies by various countries. India meets 60 per cent of its edible oils demand through imports, making it vulnerable to international movements in prices. For instance, sunflower oil, which makes up 15 per cent of our total edible oil imports, is procured mainly from Ukraine and Russia. Thus, FY22 saw edible oil inflation on account of international price pressures. However, inflation remained subdued in FY23 because of rationalisation of tariffs and the imposition of stock limits on edible oils and oil seeds.
Figure V.8: Imported Inflation in Edible Oils

Source: FAO and MoSPI
Figure V.9: Import of Edible Oils
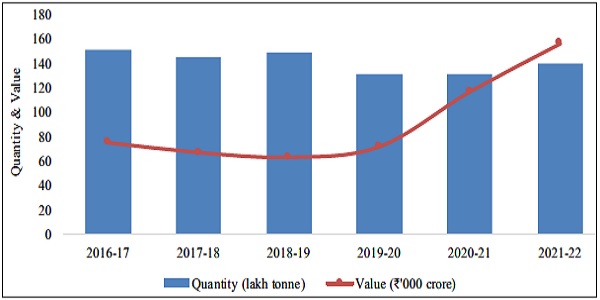
Source: Solvent Extractors Association of India
Note: Data corresponding to oil year (November-October)
Figure V.10: Moderating Retail Prices of Edible Oils

Source: DoCA
Box V.1: Measures to Contain Inflation in Essential Food Commodities
The government keeps a close watch on the production and availability of essential commodities through regular reviews by the Inter-Ministerial Committee and Committee of Secretaries. The following fiscal measures are taken to bring down the prices of essential commodities:
Cereals
- On 13 May 2022, wheat flour exports were prohibited in order to prevent a domestic surge in prices.
- From 12 July 2022 wheat flour exports were permitted but were subjected to restrictions as recommended by an inter-ministerial panel.
- With effect from 14 August 2022 the export of maida and suji was allowed only after the approval of the inter-ministerial panel.
- Notification dated 27 August 2022 prohibited export of wheat or meslin flour (atta), maida, samolina (rava/sirgi), wholemeal atta and resultant atta (HS Code 1101). This amendment in the policy aimed to ensure food security and put a check on the mounting prices of wheat flour in the country.
- The Central Government, w.e.f. 9 September 2022, imposed an export duty of 20 per cent on rice, brown rice, and semi-milled as well as wholly milled rice, except parboiled rice.
Pulses
- A buffer stock of pulses has been maintained for price stabilisation in 2020-21, 2021-22 and 2022-23. Calibrated release of pulses from the buffer stock will moderate the prices in the market.
- The import duty on masur was brought down to zero per cent with effect from 26 July 2021. Further, the Agriculture Infrastructure and Development Cess (AIDC) on masur was brought down to zero per cent with effect from 12 February 2022. The nil rate of AIDC has been extended up to 31 March 2023.
- On 30 March 2022, the import of tur and urad under the Free Category was extended until 31 March 2023.
The Central Government, on 1 September 2022 decided to provide 1.5 million tonnes of chana to States and UTs at a discounted rate for distribution under various welfare schemes. The states will be able to procure chana at a discount of `8 per kg over their respective issue prices.
Edible Oils
- The Central government, on 24 May 2022, exempted customs duty and AIDC on yearly import of 20 lakh metric tonne each of crude soya bean and sunflower oil for the years 2022-23 and 2023-24.
- The basic duty on refined palm oil was reduced from 17.5 per cent to 12.5 per cent w.e.f 21 December 2021 until 31 March, 2022 and the basic duty on crude palm oil was reduced from 7.5 per cent to 5 per cent w.e.f 13 February 2022 until 30 September 2022. The Central Government has allowed free import of refined palm oil until 31 December 2022.
- The Central Government, in November 2021, cut the basic duty on crude palm oil, crude soyabean oil and crude sunflower oil from 2.5 per cent to Nil. The Agri-cess on these oils has been brought down to 5 per cent.
- Vide notification dated 14 October 2021, the basic import duty on refined soyabean oil and refined sunflower oil has been slashed to 17.5 per cent from 32.5 per cent.
- In a bid to cool down the domestic prices of soya meal, Central Government has notified an order under the Essential Commodities Act to declare ‘Soya Meal’ as an Essential Commodity up to 30 June 2022, by amending the Schedule of the Essential Commodities Act, 1955. Stock limit on soya meal had been imposed for a period from 23 December 2021 to 30 June 2022.
- Stock limits imposed on all edible oils and oilseeds, vide order dated 3 February 2022, were extended up to 31 December 2022, by amending the Removal of Licensing Requirements, Stock Limits and Movement Restrictions on Specified Foodstuffs Order, 2016. This measure is to curtail any unfair practices like hoarding, black marketing etc. in the market and to control the prices of edible oils.
In July 2022, the Central Government directed leading Edible Oil Associations to ensure a reduction in the maximum retail price of edible oils by `15 per litre with immediate effect. Mother Dairy has slashed prices of rice bran and soybean oil by up to `14 per litre after the Centre directed edible oil companies to pass on the benefits of a fall in global edible oil prices to consumers.
Rural-Urban Inflation Differential has Declined
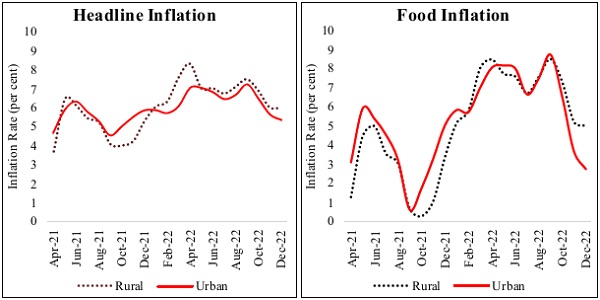
5.15 Rural inflation has remained above its urban counterpart throughout the current fiscal year, reversing the trend seen during the pandemic years. CPI-C based food inflation seems to have cooled down after reaching a high of 8.3 per cent in April 2022 due to a subsequent moderation in global food prices and a reduction in farm input costs. However, the cooling was more pronounced for urban inflation, which softened to 2.8 per cent in December 2022. Rural fuel inflation remained lower than its urban counterpart throughout the current fiscal, due to subdued price pressures on traditional fuel items such as firewood and cow dung cakes as opposed to petrol and diesel.
5.16 While the current fiscal year saw rural and urban inflation closely tracking each other, FY22 had seen a wider differential between the two. The gap between rural and urban inflation reached its widest in March 2022 due to a difference in the experience of food inflation. Urban areas experienced a sharper increase in food prices of vegetables and oils during this time as compared to the hinterlands.
Figure V.11: Urban and Rural Inflation
Source: MoSPI
Majority of the States/UTs have Higher Rural Inflation than Urban Inflation
5.17 CPI-C inflation increased in most of the states in FY23 as compared to FY22. Telangana, West Bengal, Maharashtra, Madhya Pradesh, Haryana, and Andhra Pradesh saw especially high rates of inflation in FY23. Fuel and clothing were the major contributors to the surge in inflation.
Figure V.12: Higher Retail Inflation in Majority of States in FY23*
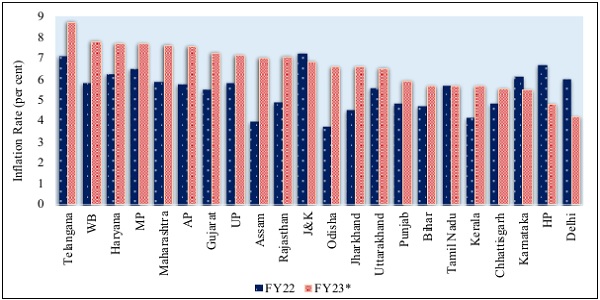
Source: MoSPI
Note: (i) *April-December
(ii) Inflation for the FY22 is based on the average of June 2021 to March 2022, owing to the non-availability of indices for the months of April & May 2020 due to the Covid-19 pandemic.
(iii) 22 major States having a population >50 lakhs as per Population Census 2011 are presented
5.18 Most of the States and UTs have witnessed higher rural inflation than urban inflation in the current year, mainly owing to marginally higher food inflation in rural areas. Assam, Haryana, Madhya Pradesh, Manipur, Mizoram, Odisha, Uttarakhand, West Bengal, and Delhi experienced a higher rural inflation than urban inflation. In rural sectors of Haryana, Mizoram, and West Bengal it was because of higher ‘food and beverages’ and ‘clothing and footwear’ inflation. In rural sectors of Madhya Pradesh, Manipur and Assam, it was due to ‘fuel and light’ segments. Food, clothing and fuel were the major contributors to higher inflation in urban areas of Bihar, Meghalaya, and Tripura.
Figure V.13: Higher Rural Inflation in Most of States/UTs in FY23*

Source: MoSPI
Note: (i) *April-December
(ii) Data for Urban Arunachal Pradesh is not available
Domestic Wholesale Price Inflation
Wholesale Price Inflation Caused by Global Supply Chain Disruption
5.19 WPI-based inflation remained low during the Covid-19 period, and it started to gain momentum in the post-pandemic period as economic activities resumed. The Russia-Ukraine conflict further exacerbated the burden as it worsened global supply chains along with the free movement of essential commodities. As a result, the wholesale inflation rate climbed to about 13.0 per cent in FY22. Prices of items like petroleum products, basic metals, chemicals & chemical products, and edible oils, with maximum exposure to international pricing translated into a rise in the domestic WPI inflation.
Table V.2: Average Annual Wholesale Inflation Based on WPI (per cent) (Base: 2011-12=100)
|
Groups/Subgroups |
Weight | FY20 | FY21 | FY22 | FY23* |
| Primary Articles | 22.6 | 6.8 | 1.7 | 10.3 | 12.3 |
| Food articles | 15.3 | 8.4 | 3.1 | 4.1 | 8.3 |
| Cereals | 2.8 | 7.5 | -2.6 | 1.6 | 10.7 |
| Pulses | 0.6 | 15.9 | 11.6 | 6.9 | 0.0 |
| Vegetables | 1.9 | 31.2 | 3.4 | 0.4 | 13.2 |
| Fruits | 1.6 | 3.2 | 1.4 | 11.3 | 10.4 |
| Non-Food Articles | 4.1 | 4.5 | 1.4 | 21.1 | 12.0 |
| Minerals | 0.8 | 13.2 | 6.7 | 19.6 | 6.2 |
| Crude Petroleum & Natural Gas | 2.4 | -7.7 | -17.5 | 56.7 | 57.7 |
| Fuel & power | 13.2 | -1.8 | -8.0 | 32.6 | 33.8 |
| LPG | 0.6 | -8.3 | -2.7 | 43.3 | 16.9 |
| Petrol | 1.6 | -3.2 | -11.8 | 62.9 | 41.9 |
| High Speed Diesel | 3.1 | -3.5 | -14.4 | 59.9 | 60.8 |
| Manufactured Products | 64.2 | 0.3 | 2.7 | 11.1 | 7.1 |
| Food products | 9.1 | 4.1 | 5.6 | 11.7 | 6.0 |
| Edible oils | 2.6 | 1.4 | 20.3 | 30.5 | 1.4 |
| Food Inflation (Food articles + Food products) | 24.4 | 6.9 | 3.9 | 6.8 | 7.5 |
| Core Inflation (Manufactured Products-Food products) | 55.1 | -0.4 | 2.2 | 11.0 | 9.2 |
| Headline Inflation | 100 | 1.7 | 1.3 | 13.0 | 11.5 |
Source: Office of Economic Adviser, DPIIT
Note: *April-December 2022, WPI data for November and December 2022 are provisional
5.20 Part of the double-digit inflation in WPI during H1 of FY23 could be attributed to food inflation, which stayed at 7.5 per cent against 6.8 per cent in FY22. Cereals and vegetables were the major contributors to food inflation owing to erratic climatic conditons. Inflation in the ‘manufactured products’ subgroup in FY23 saw a considerable decline compared to the previous year due to the rationalisation of duties on critical inputs and moderation in global commodity prices. In comparison to FY22, core inflation remained lower in FY23.
5.21 Overall, the monthly trend of inflation rates based on wholesale prices has been sliding downwards from its peak of 16.6 per cent in May 2022 to 10.6 per cent in September 2022 and further to 5.0 per cent in December 2022. The decline in inflation was observed in all three subgroups of WPI.
5.22 As mentioned earlier, part of WPI inflation is imported inflation. The high import dependence on edible oils has meant that the transitory effect of rising international prices of these products are also reflected in domestic prices. An RBI study3 indicates that one per cent increase in prices across all the countries and sectors due to global inflation shock could increase inflation in India by around 63 basis points through second-round effects comprising domestic indirect effects (46 basis points) and global spillovers (17 basis points), in addition to the direct impact of 100 basis points. The impact of prices in world markets on WPI (manufactured products component) was clearly visible, especially in prices of oil and basic metals. In the current financial year, global prices of edible oils, rubber, cotton, crude oil, and metals decreased. Capital outflows in H1 of FY23 had impacted India’s exchange rate adversely; this was another reason for high prices of imported inputs, which are mostly dollar-denominated.
Figure V.14: Declining Core and Food Inflation

Source: Office of Economic Adviser, DPIIT
Figure V.15: Drivers of Wholesale Inflation in FY23* – ‘Primary Articles’ & ‘Fuel & Power’

Figure V.16: Slackening Global Commodity Prices
Source: Pink Sheet, World Bank
Note: *dmtu:dry metric tonne unit
Box V.2: Measures to Contain Inflation in Input Prices
- Fuel Prices: The Central Government has made interventions by calibrating the excise duties on petrol and diesel. The first phase of reduction in terms of `5 on petrol and `10 on diesel was made effective from 4 November 2021 and the second phase from 22 May 2022 (`8 per litre on petrol and `6 per litre on diesel).
- Plastic products: The import duty on import of raw materials used in the plastic industry has been reduced to lower the cost of domestic manufacturing. The duties on naphtha, propylene oxide and polymers of vinyl chloride have been reduced from 2.5 per cent to 1 per cent, 5 per cent to 2.5 per cent and from 10 per cent to 7.5 per cent, respectively on 21 May 2022.
- Steel: On 21 May 2022, import duty on major inputs – ferronickel, cooking coal, PCI coal – has been cut from 2.5 per cent to zero, while the duty on coke and semi-coke has been slashed from 5 per cent to zero. Tax on export of iron ores and concentrates has increased from 30 per cent to 50 per cent, while that on iron pellets has been raised to 45 per cent.
- Cotton: The government waived customs duty on cotton imports w.e.f 14 April 2022, until 30 September 2022, to benefit the textile industry and lower prices for consumers. Earlier, cotton imports attracted 5 per cent Basic Customs Duty (BCD) and 5 per cent AIDC. The Central Board of Indirect Taxes and Customs (CBIC) notified the exemption from customs duty and AIDC for import of cotton.
- Diamonds and gemstones: In Budget 2022-2023, customs duty on cut and polished diamonds and gemstones was reduced to 5 per cent and duty on the simply sawn diamond was reduced to nil.
- Chemical products: Customs duty on certain critical chemicals namely methanol, acetic acid and heavy feedstocks for petroleum refining was reduced in the Budget 2022-23.
Fuel Price Inflation: Declining Global Crude Oil Prices
5.23 In FY22 and FY23, inflation in WPI ‘fuel and power’ was mostly driven by high international crude oil prices. In response to subdued global demand because of Covid-19 induced restrictions, the price of the Indian basket of crude oil during FY21 stayed in the range of US$20-65/bbl. Thereafter, prices started surging on account of unprecedented cuts in crude oil supply by the Organisation of the Petroleum Exporting Countries (OPEC) and other oil-producing countries. The upward trend continued in FY22 and FY23, as demand picked up with the easing of Covid-19 restrictions in most regions of the world. Also, owing to supply disruption amid rising tensions in Eastern Europe and the Middle East in June 2022, the Indian basket of crude oil peaked at US$116/bbl. Subsequently, the price declined to US$ 78/bbl in December 2022. Further, a cut in central excise duty on petrol and diesel in November 2021 and May 2022, followed by a reduction in Value Added Tax (VAT) by the State Governments, led to a moderation of the retail selling price of petrol and diesel in India.
Figure V.17: Moderation in Crude Oil Prices

Source: Pink Sheet, World Bank and PPAC, MoPNG
Convergence of WPI and CPI Inflation
5.24 Inflation dynamics in India since the outbreak of the pandemic have been influenced by various domestic and global factors. While the pass-through of international prices to wholesale prices is relatively quick, it impacts retail prices with a lag. This creates a wedge between WPI and CPI inflation rates. It is also due to the difference in composition and weights assigned to different commodities in the two indices.
5.25 The headline inflation based on WPI and the CPI-C started diverging in March 2021, as WPI inflation touched double digits due to unfavourable base effects while CPI-C inflation remained stable. The wedge between CPI-C and WPI inflation continued to widen before reaching its peak at 10 per cent in November 2021. Thereafter, the gap began to narrow until April 2022. The path to convergence, however, was short-lived as another inflationary pressure started building up in February 2022 as a consequence of the Russia-Ukraine conflict. The major brunt of commodity supply chain disruption and increased demand for essentials was reflected in WPI with a short lag of 2 months. As a result, the two indicators of inflation again started diverging in May 2022. It was only after global commodity prices, including crude oil, softened and the effects of strong supporting domestic factors like favourable monsoon, vaccination-led economic resumption, etc., started to be felt that the wedge began to narrow, and it closed in November 2022, after 21 months. It also indicated the near completion of the pass-through of high input costs to the retail segment.
5.26 The convergence between the WPI and CPI indices was mainly driven by two factors. Firstly, a cooling in inflation of commodities such as crude oil, iron, aluminium and cotton led to a lower WPI. These commodities occupy a larger weight in the WPI as compared to the CPI. Further, these commodities are highly vulnerable to fluctuations in international prices and are used intensively by industries producing wholesale goods. As the prices cooled for these commodities, the two measures of inflation began to converge. Secondly, CPI inflation rose due to an increase in the prices of services. Services form a part of the core component of the CPI-C but are not included in the WPI basket.
Figure V.18: Convergence of Headline WPI Inflation with Headline CPI-C Inflation
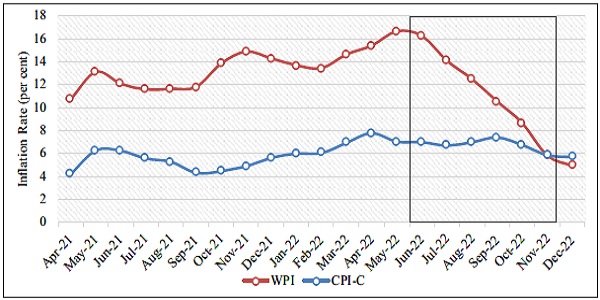
Source: MoSPI and Office of Economic Adviser, DPIIT
Figure V.19: Convergence in Core Inflation – CPI-C vs WPI

Source: MoSPI and Office of Economic Adviser, DPIIT
Figure V.20: Convergence in Food Inflation – CPI-C vs WPI

Source: MoSPI and Office of Economic Adviser, DPIIT
Figure V.21: Convergence Between CPI (Fuel & Power) and WPI (Fuel & Light) Inflation Rates

Source: MoSPI and Office of Economic Adviser, DPIIT
Figure V.22: Convergence Between Retail and Wholesale Energy Inflation Rates
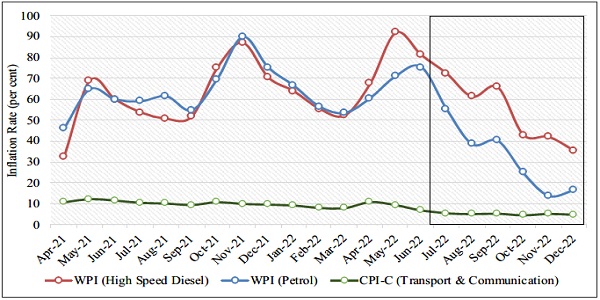
Source: MoSPI and Office of Economic Adviser, DPIIT
Falling Inflationary Expectations
5.27 Inflationary expectations are decisive in charting the course of inflation. The RBI’s anchoring of inflationary expectations through forward guidance and responsive monetary policy has helped guide the trajectory of inflation in the country. The one-year-ahead inflationary expectations by businesses have shown a decreasing trend in the current fiscal. As businesses are price-setters, their perceptions on inflation are significant in making sense of whether costs would be passed on, resulting in higher prices in the near future. Similarly, inflationary expectations by households- who are the price takers of the economy- determine their consumption choices in the near future. Much like businesses, household inflation expectations too have moderated.
Figure V.23: Business and Household Inflationary Expectations are Falling

Monetary Policy Measures for Price Stability
5.28 Reserve Bank of India’s Monetary Policy Committee (MPC) increased the policy repo rate under the liquidity adjustment facility (LAF) by 2.25 per cent (225 basis points) from 4.0 per cent to 6.25 per cent between May and December 2022.
Table V.3: Monetary Policy Statements – Tightening Monetary Policy
| Date of MPC Statements | Changes in the Policy Repo Rate under the LAF |
| 8 April 2022 | Unchanged at 4 per cent |
| 4 May 2022 | Increased from 4.0 per cent to 4.4 per cent (40 basis points) |
| 8 June 2022 | Increased from 4.4 per cent to 4.9 per cent (50 basis points) |
| 5 August 2022 | Increased from 4.9 per cent to 5.4 per cent (50 basis points) |
| 30 September 2022 | Increased from 5.4 per cent to 5.9 per cent (50 basis points) |
| 7 December 2022 | Increased from 5.9 per cent to 6.25 per cent (35 basis points) |
Source: RBI
Lastly, the 1973 crisis closely followed the collapse of the Bretton Woods managed exchange rate regime as the goals and even instruments of monetary policy were poorly defined in many countries. Arguably, central banks have much clearer and more robust institutional frameworks that focus on price stability today. This has prevented inflation expectations of the public from becoming unanchored despite a sharp rise in inflation during the year 2022.
Besides commodity market behaviour, higher energy prices could matter less today than in the past. With better coordination among the global central banks and the application of unconventional monetary policy tools, inflation has been controlled in a better way so that its negative spillovers are limited and transitory. The energy intensity of GDP – the amount of energy required to produce a given amount of goods and services – has fallen by around 40 per cent since the late 1970s. With the diversification of input baskets and destinations for sourcing, commodity shocks’ impact has been tamed to some extent. Hence, we may expect recent commodity price rises to be less disruptive than those of the 1970s.
Source: Annual Economic Report, June 2022 by Bank for International Settlements and Vox EU, 2022 (https://bit.ly/3XpYqsI)
Housing Prices: Recovering Housing Sector After the Pandemic
Unprecedented global inflation in the current year recalls the experience of the 1970’s, particularly the aftermath of the oil crises in 1973 and 1979. Both crises contributed to rising commodity prices worldwide and their spill-over effects on the prices of other goods and services. However, the environment and intensity of the crises differ in various respects.
Firstly, recent oil price rises are proportionally smaller than the 1970s crisis, which had taken oil prices to historic highs.
Secondly, in contrast to the 1970s crisis, which was confined to oil prices, the recent crisis has seen pervasive price increases across a broader range of commodities. Prices of non-oil energy, some agricultural goods, fertilisers, and metals have all risen well above their pre-pandemic levels in the current year.
Thirdly, commodity supply disruptions have played a smaller role in recent price increases than in the 1970s. The rise in commodity prices over the past year has been accompanied by a modest rise in the production of many commodities, although not oil. Global commodity supply chains have now become more efficient than in the 1970s and hence, the inflationary pressure can be absorbed with greater ease. However, supply disruptions could intensify over the coming year, as the war in Ukraine will lower global production of wheat, maize and fertilisers, while price caps on Russian oil and gas may reduce the supply of these products.
Fourthly, global inflation, which has risen significantly since the start of 2021, follows several years of low inflation. In contrast to this, the 1973 crisis took place against a backdrop of several years of steadily rising world inflation and signs of a de-anchoring of inflation expectations.
Lastly, the 1973 crisis closely followed the collapse of the Bretton Woods managed exchange rate regime as the goals and even instruments of monetary policy were poorly defined in many countries. Arguably, central banks have much clearer and more robust institutional frameworks that focus on price stability today. This has prevented inflation expectations of the public from becoming unanchored
despite a sharp rise in inflation during the year 2022.
Besides commodity market behaviour, higher energy prices could matter less today than in the past. With better coordination among the global central banks and the application of unconventional monetary policy tools, inflation has been controlled in a better way so that its negative spillovers are limited and transitory. The energy intensity of GDP – the amount of energy required to produce a given amount of goods and services – has fallen by around 40 per cent since the late 1970s. With the diversification of input baskets and destinations for sourcing, commodity shocks’ impact has been tamed to some extent. Hence, we may expect recent commodity price rises to be less disruptive than those of the 1970s.
Source: Annual Economic Report, June 2022 by Bank for International Settlements
Housing Prices: Recovering Housing Sector After the Pandemic
5.29 Housing prices provide helpful information on the state of the economy via booms and busts in asset markets, which give rise to economic imbalances. Monitoring housing prices is essential for achieving the objectives of price stability, financial stability, and growth. Movements in these prices affect consumption spending through its effects on household wealth and consumer confidence.
5.30 The National Housing Bank (NHB) publishes two Housing Price Indices (HPI), namely ‘HPI assessment price’ and ‘HPI market price quarterly’, with FY18 as the base year. HPI assessment price is based on the valuation prices of residential units collected from primary lending institutions. In contrast, the HPI market price is based on the market prices for unsold inventories collected from developers. A composite index is calculated for 50 cities across India using the population of the cities as weights.
5.31 The annual variation in HPI market price ranged from an increase of 37.7 per cent in Bhubaneshwar to a contraction of 6.5 per cent in Indore in the Quarter Ending (QE) Sept 22 over QE Sept 21. Out of the 50 cities, 43 saw an increase in the index, whereas 7 cities showed a decline annually. All of the eight major metros of the country, viz., Ahmedabad, Bengaluru, Chennai, Delhi, Hyderabad, Kolkata, Mumbai and Pune, recorded increases in the index on an annual basis.
5.32 The annual change in HPI assessment price varied widely across the cities ranging from an increase of 20.2 per cent in Gandhinagar to a decline of 2.3 per cent in Bhiwadi in the QE Sept 22 over QE Sept 21. Out of the 50 cities, 46 cities registered an increase in the index, whereas 4 cities experienced a decline, on an annual basis. All of the eight major metros of the country witnessed an annual increase in the index.
Figure V.24: HPI for Metro Cities – Boom in ‘Ahmedabad’ and ‘Hyderabad’
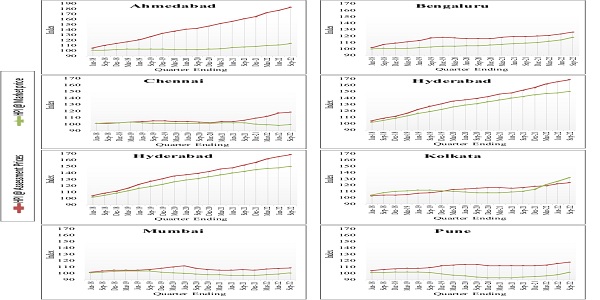
Source: RESIDEX, NHB
Figure V.25: Composite HPI for All-India – Recovering Housing House

Source: RESIDEX, NHB
5.33 The Covid-19 crisis significantly impacted the residential real estate market. Health concerns and stay-at-home orders led to fewer buyers looking for homes during the initial phase of the pandemic in April-June, 2020. Subsequently, India’s real estate industry gained momentum from September 2020 onwards and peaked in the quarter ending in March 2021. The second wave of the pandemic affected the real estate sector yet again when home buyers delayed purchases due to mounting uncertainty and restricted movement. However, timely policy intervention by the government coupled with low home loan interest rates propped up demand and attracted buyers more readily in the affordable segment in FY23. The overall increase in composite HPI assessment and HPI market prices indicates a revival in the housing finance sector. A stable to moderate increase in HPI also offers confidence to homeowners and home loan financiers in terms of the retained value of the asset.
Box V.4: NHBs Support to the Housing Finance Sector (HFC)
The last three years were challenging for the housing sector. NHB has provided a significant impetus to obviate the liquidity issues faced by the Housing Finance Sector in the last 3 years.
- The Liquidity Infusion Facility Scheme was launched in 2019 to support HFCs in creating individual housing loan portfolios that fall under the priority sector, as defined by the RBI.
- During the COVID-19 pandemic, Special Refinance Facility (SRF) was launched for disbursing an amount of `10,000 crore provided by RBI under the Special Liquidity Facility and an amount of `5,000 crore allocated by RBI under an Additional Special Liquidity Facility.
- During 2020-21, SRF 2021 was launched with a corpus of `10,000 crore provided by RBI under SLF-2. NHB has provided refinance disbursement of `3.3 lakh crore since inception, of which `0.84 lakh crore were disbursed during last 3 financial years.
- Also, as a part of the Azadi Ka Amrit Mahotsav (AKAM), NHB has extended concessions of 25/30 basis points under refinance for the various categories including women, rural areas, SC/ ST, aspirational districts, north-eastern region, loans to third gender/differently abled/disabled, UTs of Jammu & Kashmir and Ladakh, and green housing.
- In view of the nation’s commitment at COP26 to reach net-zero emission by 2070, NHB has extended 100 bps concession for loans under Green Housing.
- As part of AKAM and to increase the credit offtake in geographically underpenetrated areas which are a national priority, NHB has decided to extend 100 bps concession and refinance for loans in designated aspirational districts, north-eastern States, Jammu & Kashmir and Ladakh, until September 2023.
Keeping check on Phamaceutical Prices
5.34 The principles for the regulation of the prices of drugs are based on the National Pharmaceuticals Pricing Policy, 2012, administered by the Department of Pharmaceuticals. The key principles of the policy are the essentiality of drugs, control of formulation prices and market-based pricing. Until 31 December 2022, ceiling prices for 890 formulations of 358 drugs/medicines across various therapeutic categories under National List of Essential Medicines (NLEM), 2015 have been fixed by National Pharmaceuticals Pricing Authority. Subsequently, NLEM 2022 was promulgated by Ministry of Health and Family Welfare in September 2022 and revised Schedule I of Drugs (Prices Control) Order (DPCO) was notified on 11 November 2022 by Department of Pharmaceuticals incorporating NLEM, 2022. Ceiling prices of 119 formulations under NLEM, 2022 have been fixed until 31 December 2022. In addition, retail prices for 2,196 formulations have been fixed under the DPCO, 2013.
5.35 Pradhan Mantri Bhartiya Janaushadhi Pariyojana (PMBJP) was launched to make quality generic medicines available at affordable prices to all. Under this scheme, dedicated outlets known as Janaushadhi Kendras are opened to provide quality generic medicines at affordable prices to all and especially to the poor and the deprived. Further, Pradhan Mantri Bhartiya Janaushadhi Kendras (PMBJKs) also provide self-employment with sustainable and regular earnings opportunities. Under the PMBJP, until 31 December 2022, more than 9000 PMBJKs have been opened across the country. At present, the product basket of PMBJP comprises 1759 medicines and 280 surgical devices available for sale.
Conclusion
5.36 It is not wishful thinking that 2023 will show less macroeconomic volatility than its preceding financial year. Both CPI-C and WPI have fallen below 6 per cent (which is the RBI tolerance limit for the former) and are on the descending slope of the surge that hit the economy in the first half of the current fiscal. International crude oil prices, the principal drivers of inflation this financial year, have returned to normal levels and so have prices of other major commodities. RBI projects CPI inflation for Q1 – FY24 at 5.0 per cent and for Q2 -FY24 at 5.4 per cent on the assumption of a normal monsoon.
5.37 India’s inflation management has been particularly noteworthy and can be contrasted with advanced economies that are still grappling with sticky inflation rates. Due to the anticipated slowdown in advanced economies, inflation risks coming from global commodity prices are likely to be lower in FY24 than in FY23. However, in terms of overall risks to the benign baseline view on inflation, upside risks to India’s projected rates may outweigh the downside risks. For instance, the re-emergence of Covid-19 in China can trigger supply chain disruptions as was the case during the pandemic period. On the other hand, if China returns to normalcy from Covid-19, there can be a surge in commodity demand – thus reversing the recent slump in commodity prices. Further, the probability of a soft landing in the US economy has risen in recent months, and that might keep up the US demand for oil. Similarly, the geopolitics associated with oil can particularly affect our imported inflation.
5.38 RBI forecasts elevated domestic prices for cereals and spices in the near term owing to supply shortages. Milk prices are also expected to spike reflecting high feed costs. In general, climate across the world has become increasingly erratic, further fortifying upside risks to food prices. A lot depends on industrial input prices: they may ease, but on the flip side their delayed pass-through to consumer prices may contribute to the stickiness of core inflation.
5.39 Still, overall, the inflation challenge in FY24 must be a lot less stiff than it has been this year. We expect monetary and fiscal authorities to be as proactive and vigilant as they have been this year.
*****
Notes:-
1 World Economic Outlook (WEO), IMF, October 2022
2 Monetary Policy Report, RBI, September 2022
3 Monetary Policy Report, RBI, September 2022


