Technical analysts study historical stock and index price trends to predict stock movements and trends. A stock or index chart like any other graph has two-axis – X and Y – plotted for price and time.
Each chart has a specific function and what chart you use, depends on the information you are seeking. There are four main kinds of charts used by traders and analysts: line chart, bar chart, candlestick chart and point and figure chart.
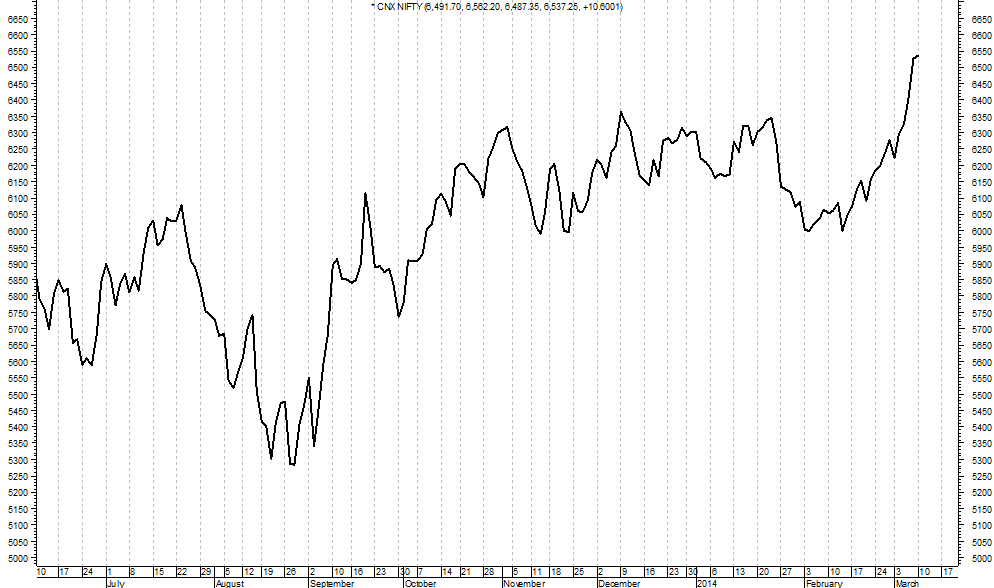
Line Chart
It is the most basic of the four. The Line chart represents the closing price of a stock over a period of time. A simple line chart draws a line from one closing price to the next closing price. Individual data points using the closing price of stock is used to form the line chart. Connecting the closing prices over a given time period shows the trend.
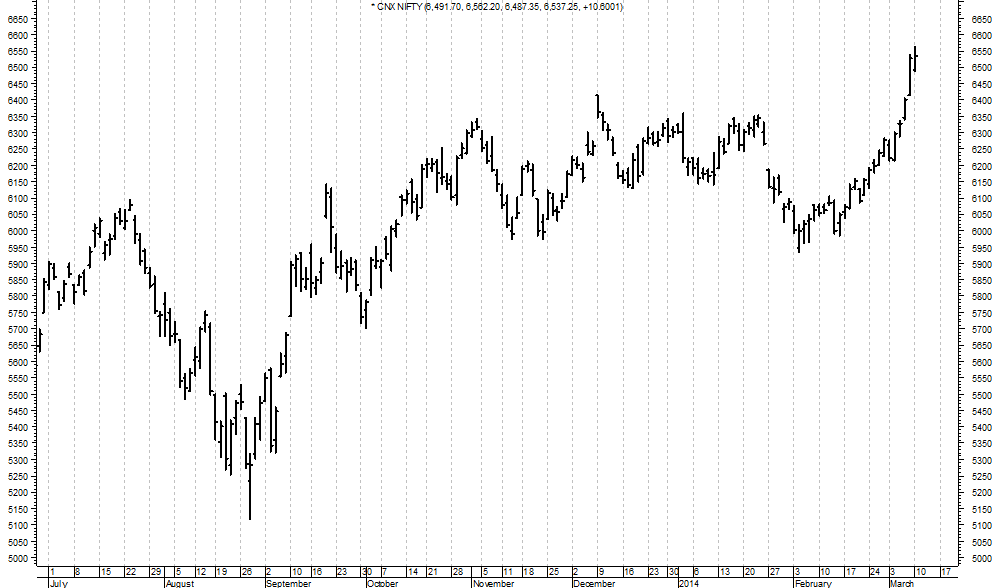
Bar Chart
The most basic tool of technical analysis is the bar chart. The bar chart develops on the line chart by adding more data points. The Bar Chart as the name suggests consists of various bars or vertical lines that mark the opening price, high price, low price and closing price of the stock in a given period. The closing and opening are represented on the vertical bar by a horizontal dash – the opening is on the left of the line and closing on the right.
If the left tick or opening price is lower than the right tick or closing price then the bar is shaded black, denoting an upward move in the stock in a trading range. On the other hand when a stock sees a lower close than open, the bar for the range is shaded red showing loss in price value.
Candlestick Chart
The candlestick is similar to a bar chart in construction and data. The main element of the chart representing prices looks like a candlestick – a vertical line and two data points extending above and below it – upper line and lower line. The upper line denotes the high price, while the lower line represents the low price of a stock in the trading day. The top represents the opening or closing price depends on the color of the real body—if it is white, blue or green, then the top or upper shadow is the closing price. If the upper line or top is black, red or some other dark color, that indicates that the top is the opening price.

Point and Figure Charts
Only technical traders generally use the point and figure chart. The chart reflects only price movements and is not overly bothered about time as an element for the formulation of the data points. The point and figure chart consists of ofXs and Os. The Xs represent upward price trends and the Os represent downward price trends. There are also numbers and letters in the chart that represent months for an idea of time period. Each X or O occupies what is called a box on the chart. Each chart has a setting called the Box size, that defines the price range for each box. The box size adjusts depending on the price of the stock: the higher the stock’s price the more each box represents.

Kotak Securities is one of the largest share broking firm india providing services ranging from Demat Account to stock market investment services. Visit www.kotaksecurities.com for more details.
Author
Kotak Securities is one of India’s largest share broking firm offering demat account, online trading, mutual fund and IPO investing service’s along with a research division specializing in Sectoral Research and Company Specific Equity Research. Express your views on their Facebook Page and Twitter Handle (@KotakSecurities) or you can also visit http://www.kotaksecurities.com for more information.


A very nice article on graphical representation of stock rate changes.
Investing in stock market can be tricky gauging the volatility of stocks.
Invest wisely.
Very nicely written.
Please suggest some books on Technical Charts for the beginner.