♠ Introduction:
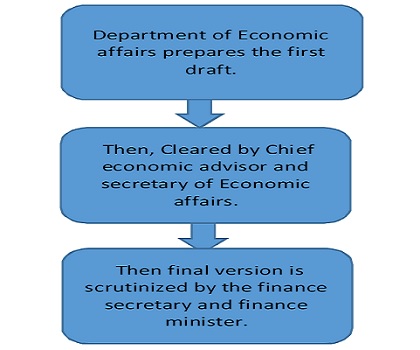
- Economic Survey 2015 -2016 Released by Finance Ministry every year before budget session.
- It sets backdrop for budget and reviews the development in Indian economy over the previous 12 months.
- First economic survey was presented in 1950 – 1951 and before 1964 the survey usually was circulated along with budget documents but post 1964 was delinked with budget documents.
- Spells out economic agenda.
- It also summarizes progress and performance on major development programs, highlights the policy initiatives of the government and prospects of the economy in the short to medium term.
- Data required for economic survey is prepared by Central statistical officer (CSO) of ministry of statistics and program implementation (MDPSI).
♠ Legal Backing of Budget vis-a-vis Economic survey.
- Article 112 of Constitution of India shall cause to be laid in parliament an “Annual Financial Statement”.
- This statement along with other documents is commonly known as Budget.
- Budget is kept utmost secret in contrast to Economic Survey.
From Socialism without entry to marketism without exit – This line can be best explained from an ancient incident in Mahabharata, the chakravyuha – ability to enter but not exit.
1. Since LPG (Liberalisation, privatization and globalization) reforms of 1991 our entry barriers in the economy have been reduced the through following:
i) De- Licensing
ii) De-regulation
iii) Reduction in role of Public Sector Enterprise
iv) Privatization
v) Liberal FDI norms
vi) Reduction in trade barriers
2. Compared to US and Mexico, the existing Indian firms are merely 1.5 times larger the newer ones on an average.
In 1998 – 1999, the number was better at 2.5 times but post 2009-2010 the number stands at 1.5 times.
In US and Mexico, it is 8 times and 2.25 times respectively.
This ratio denotes how enterprises which have been in existence for years barely manage to thrive vis-à-vis an enterprise which newly comes up.[1]
The reasons are:
i) Fiscal Cost – Government’s support to sick and inefficient industries through subsidies like bailouts, loan tariffs etc. This increases borrowing by the government causing increase in fiscal deficit leading to increased Interest rates. To counter this and project better economic indicators, the Government obtains high dividends from cash rich PSU’S such as NTPC and sometimes even resorts to disinvestments e.g. Coal India[2].
ii) Opportunity Cost of Economy – Vast pool of human and capital resources are not put to best use which ends up in consumers getting inferior products at higher cost and also leads to rising NPA’S and stressed balance sheet of lending banks.
- Loan waiver schemes and subsidies for farmers to garner votes.
- Overburdened Debt Recovery Tribunals to recover bad loans.
- Reluctance to write off of loans in books of banks of corporates from where the recovery chances are almost NIL. This leads to ever greening loans and postpones exit.
iii) Political Costs – Political bias towards the rich and the corporates while affecting in Bailouts, this too raise questions on the political appeal of government.
- Financial support to Kingfisher airlines – BOB gave loans to KFA even when the financials clearly represented poor debt ratios and coverage ratios and poor asset backing.
- Inefficient redistribution of wealth in the form of subsidies etc. let’s inefficient companies to sustain even when they have lost the ability to prosper or grow.
Solutions to the above problems
i) Avoiding exit through liberal entry – Promoting competition through privatization & liberal FDI has led to exit of uncompetitive players. Indian aviation sector and telecom & automobile sector are befitting examples.
ii) Direct Policy Action
- Amendment to Prevention of Corruption Act 1988: To prevent prosecution for mere administrative errors. This would facilitate risk taking among bureaucrats.
- PPP Projects
- Awareness and transparency: Knowledge and awareness about ecological impact of growth of cereal in NW states may lead to its voluntary exit. Similarly, knowledge about benefits of pulses cultivation may lead to phasing out cereals in unwarranted areas.
- Exit as an opportunity: Exiting inefficient firms may unleash a vast pool of resources which may be used for the economy after privatization. This will address the capital crunch as well. E.g. Land can be converted into Land Banks or to develop industries or developed into smart city.
- Spreading JAM Across Indian Economy.
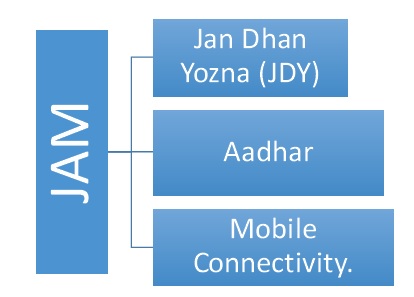
iii) Direct Benefit transfer (DBT): With DBT the CG has significant control in ensuring effective coordination between center and state.
iv) Identification of Beneficiaries and aims at preventing duplicities through tech enabled environment.[3]
v) Seamless money transfer to beneficiaries is targeted through JAM promoting financial inclusion in rural areas.
vi) Mobile phones:
- Promoting mobile penetration which is less in Bihar and Assam in the rest of the states the rate is over 60%.
- Mobile would help inform arrival of food supplies at the ration shop and fertilizer at the retail outlet.
- 23 banking licenses issued in 2015 including to Paytm and Bharti Airtel in order to promote financial inclusion.
Issues in successful implementation of JAM
Conventional Fund flow system versus Modern
- Based on forecast replaced with real time now.
- Centre→State→District→Block→Panchayat, replaced by linking directly panchayats to state thereby eliminating leakages in between.
- Expenditure documentation for multiple beneficiaries at a time post funds disbursed replaced with real time individual fund expense documentation.
- Fiscal savings are possible with modern FFS (Fund Flow System).
Major problems with old FFS.

♣ INDIAN AGRICULTURE
- Soul of Indian economy, bring home bread to nearly half of all households and supplies the remainder.
- Just before white and green revolution India’s wheat and milk production were just about 1/3rd of US Output. By 2013-2014 Indian wheat output is 60% higher than Americas and Milk output was 50% higher.
- Inter Country Variations: Average yield of wheat and rice in India are much below than that of china. In 2013 average yield was 3075 Kg/hectare as compared to world average of 3257 Kg/hectare.
- Inter-Regional Variation: Punjab and Haryana have much higher yields of 4500 Kg/hectare while some states yield lower than that of Bangladesh.
- Indian agriculture is cereal centric because of effective MSP procurement as compared to pulses since very few farmers grow pulses and only those who grow are aware of MSP for pulses.
- This has resulted in buffer stocks of wheat and paddy and frequent price spikes of pulses and edible oils despite their imports.
- Extremely inefficient methods of irrigation. India uses at least 2-4 times more water as compared to China and Brazil. India places reliance on flood irrigation.
- Farmers Income is less than Rs.20000 per annum on an average in 17 States.
- Lack of agriculture education and faculties for that matter and limited linkages to International counterparts.
- Market segmentation leading to a large difference between consumer and producer prices.
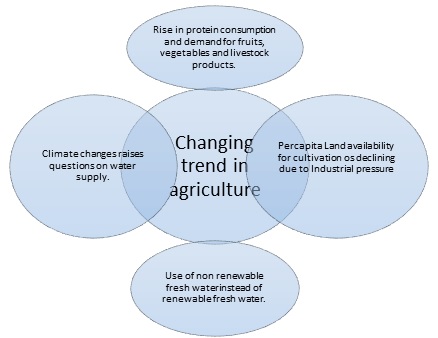
- India has much lower water levels per capital as compared to Brazil.
- While China and Brazil uses 60% of Renewable fresh water, India uses a little over 90% that too Nonrenewable.
- By 0.3 Meters per year, the water level in India is declining.
1. This situation in agriculture can be improved by methods to follow
i) Rationalizing MSP policy.
ii) Reduced use of chemical fertilizers to prevent depletion of soil and health.
iii) Drip Irrigation system, Sprinkle irrigation must be promoted to achieve benefits of fertigation.
iv) Ensure minimum floor price to the farmers through price deficiency payment.
v) If price of APMC Mandi fell below the MSP then farmer must be compensated for the same.
vi) Encourage production of pulses to achieve maximum social returns i.e.
- Soil porous and well aerated and
- Less water and fertilizer used, these benefits should be incorporated in MSP policy.
2. Subsidies and Tax concessions does it reach the deserved, we analyse
i) Government spending on subsidy: Nearly 4.2% of the GDP.
ii) Who utilizes it? – The well offs to the tune of over 1 lac crores. This includes tax foregone and PPF schemes.
iii) We mostly follow withdrawal based tax regime whereas this should be replaced by the net saving based tax incentive which is followed in other countries too.
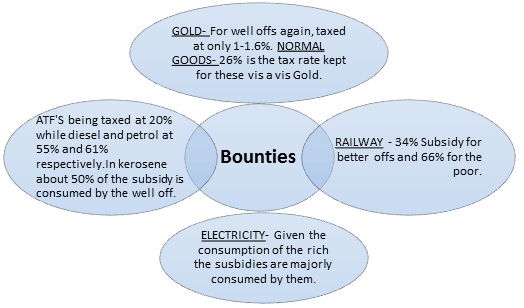
The only solution to above is to ensure welfare of the poor by taxing and lowering the subsidies of the richer.
♥ FISCAL CAPACITY—SPENDING AND ESPECIALLY TAXATION – KEY TO LONG RUN ECONOMIC DEVELOPMENT
Taxation is not just about financing spending; it is the economic glue that binds citizens to the state in a two-way accountability relationship.
1. Why taxation is key to long run political and economic development?
India has chosen taxation as the key obligation that it can demand of its citizens. Thus Bringing more and more people into the tax net via some form of direct taxation, will help in realizing the promise of Indian democracy.
2. Fiscal Capacity of India
i) India taxes and spends less than OECD countries and less than its emerging market peers. Tax to GDP ratio of India is low 16.6%.
ii) India’s total spending to GDP ratio (26.6%) and human capital expenditure (health and education) to GDP ratio (5.1%) is lowest among the BRICS.
iii) Compared with countries having similar level of economic development and having similar democracy index value, India heavily underperforms in tax collection and spending
iv) Roughly 5.5 percent of earning individuals pay taxes in India. India currently has amongst the lowest number of taxpayers.
3. How to improve Taxation and Spending?
i) Reduce corruption – More citizens believe that public resources are not wasted.
ii) Better targeting of the subsidies – This would ensure that well off people do not enjoy the subsidies.
iii) Property taxation system needs to be overhauled – They can be the foundation of local government’s finances.
iv) Introduction of GST – Would solve the problem of cascading of taxes and to improve tax collection efficiency.
v) Phasing out of corporate tax exemptions coupled with a lower corporate tax rate (25%) – This will simplify tax structure, prevent litigation and will boost ease of doing business.
♠ Preferential Trade Agreements
Five different forms of PTAs are –
i) Partial Scope Agreement (PSA): A PSA is only partial in scope, meaning it allows for trade between countries on a small number of goods .
ii) Free Trade Agreement (FTA): Preferential arrangement in which members reduce tariffs on trade among them, while each having own tariff rates for trade with nonmembers.
iii) Customs Union (CU): A customs union (CU) is a free-trade agreement in which members apply a common external tariff (CET) schedule to imports from nonmembers.
iv) Common Market (CM): A common market is a customs union where movement of factors of production is relatively free amongst member countries.
v) Economic Union (EU): An economic union is a common market where member countries coordinate macro-economic and exchange rate policies.
1. India and FTAs
i) India has made use of FTAs as a key component of its trade and foreign policy, especially from 2003-04 onwards.
ii) Specific Focus of India’s FTAs – India has mainly focused on partnering with other Asian countries, and in goods more so than in services.
iii) Customized FTAs – There are differences in coverage of products and degree of integration across recent FTAs. For example, India-Korea CEPA contains chapters on Origin Procedures, telecommunication and Audio-Visual Co-production, but these are not included in India-Japan CEPA.
2. Vietnam and Malaysia will benefit most among the member countries of TTP while non-members like Korea and Thailand would suffer as a result of shrinking market access and greater competition in export markets. For India effect on export will be marginally positive but India’s GDP will reduce by 0.2%. A Decrease of 0.1% in real income for India by 2020.
3. Benefits of FTAs
i) Reduction in tariff barriers should spur trade between partners, by offering greater market access for firms.
ii) Increased import and export after signing of FTA with the member countries.
4. Negatives of FTAs
1. The impact of an FTA on the trade balance is unclear.
2. Possibility of trade diversion from non-member country to a member country – Without any real increase in import and export.
♠ Basic Facts and Trends
For the purpose of this analysis, survey focused on three major FTA partners: ASEAN, Korea and Japan. The main results are
i) Increased Trade.
ii) Persistent Effects: Within a year of the agreement coming into force, the effect of FTAs become positive and significant, with effects even increasing in the subsequent few years.
iii) Especially for ASEAN FTA: ASEAN and the Korean FTA show statistically significant and positive effects on trade values.
iv) Especially for Imports: the country has benefitted on both sides of trade flows with a statistically significant 33 per cent increase in exports and 79 per cent increase in imports.
♠ Way forward
i) Multilateral trade liberalization.
ii) WTO has been overtaken by preferential trade agreements. Hence, India should approach FTAs as they have led to increased trade. India should keep its options intact to use WTO consistent measures like anti-dumping and conventional duties and safeguard measures to prevent itself from unfair trade.
[1] 76 PSUs exist, which although have a huge asset backing, but are running into huge accumulated losses.
[2] The Indian government follows the cash basis of accounting.
[3] BAPU (Biometric Authenticated Physical Uptake)- Beneficiaries certify their identities and take physically subsidized goods.
(Author : The Connaissance Club – A club by formed by a few Chartered Accountants aimed at dissemination of knowledge and knowledge sharing and can be reached at connaissanceclub@gmail.com)


