RBI Working Paper No. 14/2020: Asset Quality and Credit Channel of Monetary Policy Transmission in India: Some Evidence from Bank-level Data
Reserve Bank of India
Date : Dec 15, 2020
RBI Working Paper No. 14/2020: Asset Quality and Credit Channel of Monetary Policy Transmission in India: Some Evidence from Bank-level Data
Today the Reserve Bank of India placed on its website a Working Paper titled “Asset Quality and Credit Channel of Monetary Policy Transmission in India: Some Evidence from Bank-level Data” under the Reserve Bank of India Working Paper Series*. The Paper is authored by Janak Raj, Deba Prasad Rath, Pratik Mitra and Joice John.
This paper assesses the impact of asset quality of scheduled commercial banks in India on the credit channel of monetary transmission by analysing the determinants of bank credit growth. It finds that a robust credit channel of monetary transmission exists in India. Its efficacy, however, is impaired by poor asset quality of banks, while better capital position helps strengthen the transmission. For monetary policy actions to have their full impact on the credit channel of monetary policy, therefore, it is imperative to address the asset quality stress and strengthen the capital position of banks. The paper also finds that the credit deceleration in India since 2013 could be substantially explained by asset quality stress in the banking system, slowdown in economic activity and moderation in deposit growth. The accommodative stance of monetary policy, however, helped cushion this credit growth slowdown.
(Yogesh Dayal)
Chief General Manager
Press Release: 2020-2021/781
********
RBI Working Paper Series No. 14
Asset Quality and Credit Channel of Monetary Policy Transmission in India:
Some Evidence from Bank-level Data
Janak Raj, Deba Prasad Rath, Pratik Mitra and Joice John@
Abstract
1This paper evaluates the impact of asset quality of scheduled commercial banks in India on the credit channel of monetary policy. The study finds that a robust credit channel of monetary transmission exists in India. Its efficacy, however, is impaired by poor asset quality but reinforced by better capital position of banks. Credit growth deceleration in India since 2013 is explained by asset quality stress in the banking system, slowdown in economic activity and moderation in bank deposits. The accommodative stance of monetary policy, however, has helped cushion the slowdown. For accelerating credit growth, it is important that asset quality concerns of banks are addressed and that their capital positions are strengthened.
JEL Classification: E44, E51, E52, E58
Keywords: Credit growth, Asset quality, Non-performing assets, Monetary transmission
Introduction
Central banks are entrusted with the responsibility of conducting monetary policy for achieving low and stable inflation, and sustainable growth objectives. Conventional economic literature has overly focused on the ‘interest rate channel’ of monetary policy transmission, whereby short-term policy interest rate impacts the cost of capital/ borrowing of businesses/households, thereby affecting the aggregate demand and finally inflation (Bernanke and Blinder, 1992). However, this channel alone is not sufficient to explain the monetary transmission process as several other channels also operate concurrently along with the interest rate channel, though the strength of each channel varies across country. Monetary policy impulses propagated through the shift in supply of credit is termed as ‘credit channel’ of monetary transmission, which in turn consists of ‘balance sheet channel’ and ‘bank lending channel’. The first one investigates the possible effect of monetary policy on balance sheets of households and businesses, while the later emphasises the impact on the supply of credit through financial intermediaries. However, disentangling of these channels is extremely difficult (Bernanke and Gertler, 1995).
Although the interest rate channel of transmission is the basis of monetary transmission in most economies, the credit channel is also found to have a large bearing on the transmission process, especially in emerging market economies (EMEs) like India2, where financial systems are dominated by banks. Furthermore, the interest rate and credit channels are interrelated in the sense that in response to lower funding cost induced by loose monetary policy through the interest rate channel, banks should be able to increase the supply of credit quickly (Acharya, 2017). As such, the bank lending channel assumes greater importance, especially in economies where banks play a key role as financial intermediaries. Accordingly, the efficacy of the bank lending channel has been extensively examined by researchers across countries, especially in EMEs.
In the Indian context, credit growth rates of public and private sector banks have shown wide divergence in the recent period. Significant divergences have also been observed in credit growth at a bank level. The pertinent question to be asked is why monetary policy impulses in the case of some banks are stronger than others. The literature suggests that there are a host of idiosyncratic factors that could amplify or blunt the efficacy of the credit channel. The health of the banking system, in general and relative quality of banks’ asset portfolio potentially could be one of the key factors in explaining this varied performance of banks across individual banks and across time. In one of the policy statements, the Monetary Policy Committee (MPC) of the Reserve Bank of India noted that “the environment for timely transmission of policy rates to banks’ lending rates will be considerably improved if the banking sector’s non-performing assets (NPAs) are resolved more quickly and efficiently…” (RBI, 2017). Since the early 2010s, asset quality of banks in India has worsened gradually, impacting their profitability. Asset quality of scheduled commercial banks (SCBs), measured as a ratio of gross non-performing assets (GNPAs) to gross advances, deteriorated from 2.5 per cent in Q4:2010-11 to 9.1 per cent by Q4:2018-19 before marginally improving to 8.2 per cent in Q4:2019-20. Profitability, measured by the return on assets (RoA), declined from 1.1 per cent in Q4:2010-11 to (-) 0.09 per cent in Q4:2018-19. Similar trends were observed for return on equity (RoE). The year-on-year growth in loans and advances declined from 22.9 per cent in Q4:2010-11 to 11.0 per cent in Q4:2018-19. The capital to risk weighted asset ratio (CRAR) declined from 14.2 per cent in Q4:2010-11 to 13.8 per cent in Q4:2017-18 but increased to 14.3 per cent in Q4:2018-193.
John et al. (2016) analysed the importance of banks’ health in determining the strength of the interest rate channel in India. They found that asset quality of banks, measured by the GNPAs and stressed asset ratios4, had a significant impact on net interest margins (NIMs) of SCBs, implying that deterioration of asset quality impedes the interest rate channel of monetary policy transmission. As a sequel to the paper by John et al. (2016), this paper examines the impact of banks’ asset quality on the credit channel of monetary policy in India. Using quarterly panel data of 57 SCBs from Q1:2013-14 to Q4:2018-19, this study uses both macroeconomic and bank-specific factors to identify the determinants of credit growth. It then examines the bank-specific variables that impede the credit channel of monetary policy transmission. The paper finds the presence of a strong credit channel of monetary transmission in India. However, the deterioration in asset quality reduces the efficacy of the credit channel, while strong capital position and robust deposit growth reinforce it.
The paper is structured as follows. Section II provides a survey of relevant literature on the credit channel of monetary policy transmission and determinants of credit growth. Stylized facts of key banking indicators are analysed in Section III. Section IV describes the methodology, which is followed by empirical results in Section V. Section VI concludes with key points emerging from the study.
II. Survey of Literature
The concept of a bank credit channel was introduced and developed in some seminal papers such as Bernanke and Blinder (1992), Kashyap and Stein (1994) and Bernanke and Gertler (1995). Bernanke and Blinder (1992), in a time series framework, showed how bank lending responded to monetary policy shocks. Kashyap and Stein (1994) explained the lending view of monetary policy transmission and outlined the micro foundation to rationalise the bank lending channel. Bernanke and Gertler (1995) showed that monetary policy actions influence the lending decisions of banks which, in turn, impact the real economy. The efficacy of the transmission through the bank lending channel is based on the premise that financial intermediation is primarily carried out by banks, i.e., the borrowers in the financial system mostly depend on banks for credit and monetary policy actions directly impact the supply of loan by banks.5 Literature suggests that several factors contribute to the effectiveness of the transmission through the credit channel. Among the empirical studies, Kashyap and Stein (2000) found that the bank lending channel exists in the US. They also found that the bank lending channel is stronger in smaller banks with less liquid balance sheet. Among the recent studies, Sapriza and Temesvary (2019) found that the credit channel is significantly more effective during the low economic growth period. In the context of India, Bhaumik et al., (2011) examined the role of bank level factors (particularly ownership), while Sarkar (2020) studied the role of liquidity, capitalisation, size of the bank, and ownership. There is considerable amount of literature describing empirical studies on monetary transmission through the credit channel and factors influencing the same, a gist of which is available in Peek and Rosengren (2010).
In most studies, credit aggregate is the variable of prime importance in explaining the credit channel of monetary transmission (especially, in the case of bank lending channel). Then the key question is: what are the factors that affect credit? These can be broadly divided into two categories viz., macroeconomic and bank-specific.
A large volume of empirical literature has analysed the effect of various macroeconomic indicators on credit growth. Among studies in the advanced economies, Calza et al. (2001) examined the impact of GDP growth and interest rates on credit in European countries and concluded that real GDP growth had a positive relationship with domestic credit in long-run, while real interest rates had a negative impact. Cottarelli et al. (2005) too found that bank lending increases as GDP per capita increases. In addition, they also concluded that financial liberalisation positively affected bank credit, whereas rising public debt impacted it negatively. Égert et al. (2006) found that credit to the public sector, nominal interest rates and inflation rate are the major factors influencing domestic credit to the private sector in the Central and Eastern European countries, while per capita GDP is the sole important determinant in the Baltic and South-eastern European countries. In emerging market economies (EMEs), estimating the impact of different factors on credit growth assumed importance, especially post global financial crisis (GFC). Using data pertaining to 38 EMEs, Guo and Stepanyan (2011) concluded that economic and domestic deposit growth, inflation and non-resident liability are the main determinants of credit demand. Furthermore, they found empirical evidence of accommodative monetary policy spurring credit growth. Gozgor (2014) applied dynamic panel data estimation technique across 24 EMEs and found that accommodative monetary policy positively contributed to credit growth. Chen and Wu (2014) analysed the determinants of bank credit growth in EMEs during the pre-crisis, crisis and post-crisis period. They found that accommodative monetary policy supports credit growth, and banks that are dependent mostly on retail funding in Latin America and Asia had higher credit growth.
Another strand of literature analysed the relationship between bank-specific factors and credit growth. The hypothesis is that banks with strong balance sheet would be equipped enough to step up credit supply as and when credit demand increases. Cucinelli (2015) found that credit risk had a negative effect on credit growth with a lag. A high level of NPAs restraining credit flow in the banking sector has been frequently covered in many other studies (Fernandez de Lis et al., 2000; Chaudhuri and Sensarma, 2008). For EMEs, Guo and Stepanyan (2011) analysed data pertaining to several countries and concluded that asset quality contributes positively to credit growth. Better quality capital, liquid assets, and stronger regulatory framework contributed to stronger credit growth during the crisis period (Chen and Wu, 2014). The importance of a healthy banking system for achieving robust and stable credit growth has been highlighted by many researchers in many country studies, for instance, – Tan (2012) for the Philippines; Imrana and Nishatb (2013) for Pakistan; and Pham (2015) for 150 countries. Berrospide and Edge (2010) analysed the influence of bank capital on the credit growth in the U.S. and concluded only a mild effect of capital-to-asset ratios on credit growth, contradicting the quite influential constant leverage view. Nag and Das (2002) assessed the imposition of uniform capital requirement norm on credit flow and found that implementation of sterner credit risk management policies had a dampening effect on credit supply corroborating stricter prudential guidelines, thereby putting more pressure on bank and affecting credit growth.
Many studies have examined the influence of bank-specific factors on credit channel of monetary transmission, primarily focusing on the impact of expansionary monetary policy. Cross-country evidence suggests that credit channel is impaired to a great extent for banks with weak balance sheets. In fact, in this situation, there could be an attempt for evergreening of bad loans and higher lending to already distressed firms to delay its default resulting in resource misallocation and slowdown of growth (Acharya, 2017). Fainha and Robalo-Marques (2001) have found that bank lending channel is effective in the Portuguese economy, especially for less capitalized banks. However, bank size and liquidity level have not been significantly impacting this channel. On the contrary, in a similar study for Spanish banks, Hernando and Martinez-Page (2001) concluded that banks with tighter liquidity conditions may exhibit comparatively increased response than the highly liquid ones.
III. Some Stylised Facts
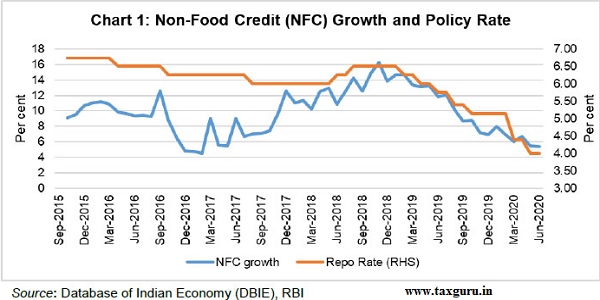
We now turn to the analysis of recent movements of key banking indicators in India. Growth of non-food bank credit (which constitutes more than 99 per cent of gross bank credit) and the policy repo rate – the monetary policy instrument in India – have moved in the same direction since June 2018. The credit growth moderated considerably between December 2018 and June 2020, even when the policy rate was reduced by the RBI (Chart 1).
At an aggregate level6, growth in key banking indicators such as credit and deposits7 has declined since September 2013. Credit growth of public and private sector banks was at 15.0 per cent and 17.7 per cent, respectively, in September 2013. However, thereafter credit growth of private sector and public sector banks diverged. Credit growth of private sector banks generally accelerated, with growth remaining more than 20 per cent between December 2017 and March 2019. whereas that of public sector banks (PSBs) decelerated to (-)0.01 per cent in December 2016 and remained below 10 per cent thereafter. Despite some acceleration thereafter, credit growth of PSBs remained at a low level such that in March 2019, credit growth of private sector banks was over twenty percentage points higher than that of PSBs (Chart 2a). More or less a similar pattern was observed in the case of bank deposits as the slowdown in credit growth of PSBs was also reflected in their deposit growth (Chart 2b). In the case of foreign banks, both credit and deposit growth rates have been volatile, especially from June 2016 onwards.

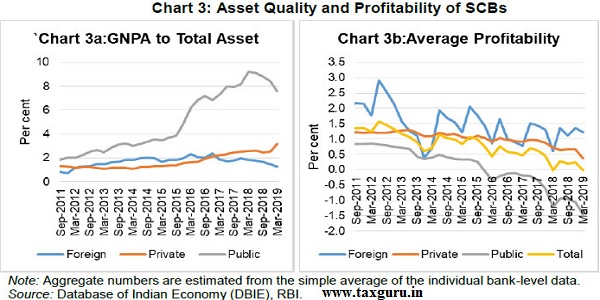
In the case of asset quality indicators, the GNPAs to total asset ratio remained low in respect of private and foreign bank groups, while it increased sharply in the case of PSBs, especially after the second half of 2015 immediately after the implementation of asset quality review (AQR) in July 2015 (Chart 3a). Before these measures were introduced in 2015, “…banks have resorted to restructuring of loans in many cases to postpone recognition of non-performance, or what we now call extend and pretend, rather than using it as a tool to preserve the economic value of the units as intended” (Vishwanathan, 2016). As PSBs account for nearly 70 per cent of total bank credit8 on an average, the poor asset quality was also manifested in the overall banking industry. Worsening asset quality resulted in a steady decline in the profitability of PSBs, which in turn, impacted profitability of the banking sector as a whole (Chart 3b).
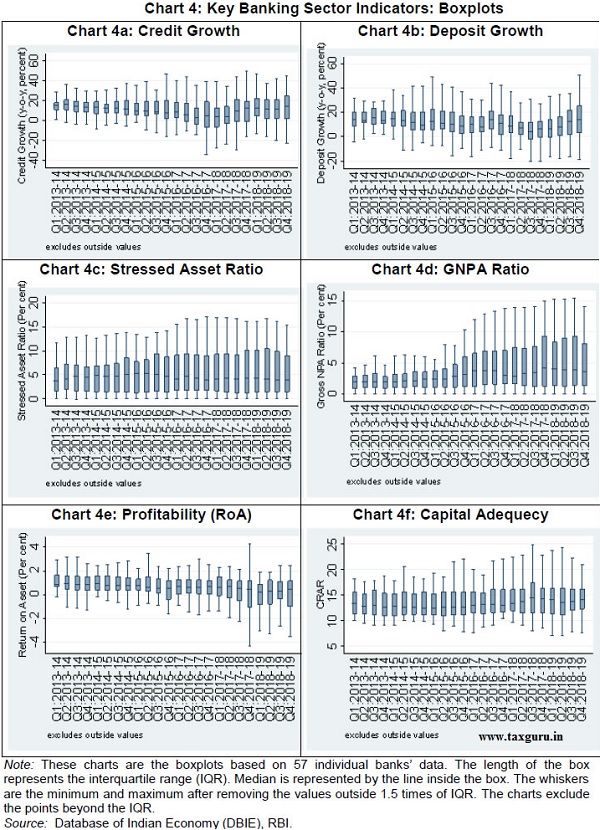
Aggregate trends often mask key movements taking place at a disaggregated level9. Hence, to gauge the impact at a bank level, the distribution of key banking sector indicators are plotted as box plots (Chart 4). Both credit growth and the deposit growth have remained highly volatile, especially from the second half of 2015. Credit and deposit growth of some banks were even negative. The GNPAs ratio remained lower and less volatile until the second half of 2015. However, “…until 2016 the restructured assets constituted more than 50 per cent of the stressed assets of all scheduled commercial banks masking the actual extent of deterioration of the loan portfolios” (Vishwanathan, 2016). Thereafter, the GNPAs ratio, especially for certain banks, surged following the withdrawal of regulatory forbearance and implementation of the asset quality review.
A sharp deterioration of the gross NPA ratio and a collapse in credit impacted the profitability of banks as measured by RoA. By Q1:2018-19, ROA of 43 out of 57 banks was less than one per cent. The median CRAR declined from 13.4 per cent in Q1:2013-14 to 12.4 per cent in Q1:2015-16, which subsequently increased to 14.1 per cent by Q4:2018-19, partly because of recapitalisation of public sector banks by the Government.
The variability in indicators such as credit and deposit growth has increased over time. We, therefore, also looked into the role of bank-specific characteristics while examining the determinants of credit growth and explored the factors that could have impeded the credit channel of monetary policy transmission.
IV. Methodology
Based on the literature survey and taking cues from the stylised facts, the following variables were identified as the potential determinants of credit growth in India. (i) Nominal GDP growth (real GDP growth and inflation) – studies are unanimous with regard to the positive relationship of nominal GDP with credit growth. Higher growth in nominal GDP increases the demand for credit. (ii) Deposit growth – again the impact is unambiguous and positive. A financial institution with a greater availability of funds will be in a better position to provide more credit to borrowers. (iii) Investment growth – in India, investments by banks include both investment in government securities as prescribed under the statutory obligations (statutory liquidity ratio or SLR) and voluntary investments held in government securities and bonds/debentures/shares of corporate bodies. To the extent banks invest in securities, lower resources would be available for extending as credit. Therefore, higher investments would likely to have a negative effect on credit growth. (iv) Interest rates – higher the interest rates, higher will be the cost of borrowing and hence, lower would be the demand for credit. (v) Asset quality – there are multiple channels through which the high level of NPAs impacts credit growth. NPAs reduce resources available to banks due to non-payment of instalments, thereby impacting the cash flow management. Basel III prudential guidelines also require banks to make capital for expanding their loan book. In addition, overall pessimism induced by psychological factors and a lack of confidence in an environment of growing impaired assets discourage banks from extending fresh loans or expanding existing facilities (Samantaraya, 2016). (vi) Other bank-specific characteristics like the size of the bank and capitalisation – the direction of impact on credit growth seems to be ambiguous, as in literature there is no unanimous explanation on their impact on credit growth.
Incorporating the above-mentioned variables, determinants of credit growth were estimated using equation (1)10.

Several bank-specific features have some commonalities with some of the identified regressors in (1). For example, bank profitability is highly correlated with asset quality – the deterioration in the asset quality leads to a decline in profitability. Hence, we introduced some bank-specific characteristics and their lags as instrumental variables (IVs), along with the lags of the other endogenous variables. This was to overcome the endogeneity bias in the regressors. The variables considered as IVs are profitability – measured by RoA; capital adequacy – proxied by capital to risk weighted assets ratio (CRAR); and size of the banks – represented by logarithm of total assets.
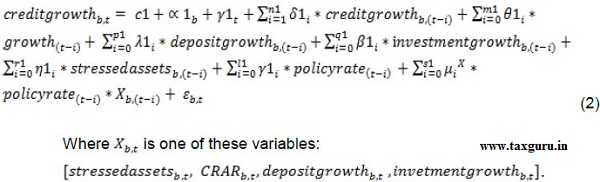
The impact of bank-specific characteristics on the credit channel in India is estimated using equation (2) by introducing the interaction term of policy rate with each of the characteristics in equation (1) separately. The identified characteristics are – asset quality, capital adequacy, deposit growth and investment growth. The introduction of the interaction terms will allow an examination of the variation in the strength of the credit channel caused by aforesaid bank- specific characteristics.
Equations (1) and (2) are estimated using a panel dataset spanning over the period from Q1:2013-14 to Q4:2018-19 covering 57 banks (including public sector, private sector and foreign banks). Data are obtained from the RBI’s Supervisory Framework (RBI-OSMOS). Seasonal adjustments for all variables (at a bank level for the bank-level variables) other than policy rate were carried out using X-12 ARIMA process. Equation (1) is also estimated separately for all bank groups – public sector banks (21 banks), private sector banks (19 banks) and foreign banks (17 banks) to capture the bank group’s specific characteristics.
Considering the endogeneity in the model, estimation was carried out using dynamic panel data regression technique, following Arellano-Bover (1995) and Blundell-Bond (1998) in generalised method of moments (GMM)11 framework. Specifically, we used the system GMM approach for estimating the equations. This methodology incorporates two IV equations – the original one and the transformed one – which significantly improves the efficiency (Roodman, 2009). This methodology is also appropriate when the dependent variable (credit growth in this case) is dynamic and the explanatory variables are not exogenous. The lags were chosen following a general to specific approach – dropping the lags which were insignificant. The following diagnostic tests were implemented for ensuring the robustness of the model estimates – (i) Sargan test for over identification; and (ii) Arellano-Bond test for first and second order residual auto correlation.
V. Results
The regression estimates of the equation (1) are presented below in Table 1.
The results show that the nominal GDP growth had a statistically significant positive impact on credit growth with a maximum of one quarter lag indicating that an increase in economic activity leads to an expansion in credit within one quarter. Deposit growth also had a statistically significant positive effect on the credit growth with a lag of zero to two quarters, suggesting that credit growth could suffer up to two quarters in a scenario in which banks are not able to mop up deposits. Investment growth, as expected, was related negatively to credit growth. The investment growth coefficient is statistically significant and the negative sign indicates that banks which allocate more funds for financing SLR and non-SLR investments reduce credit with a lag of up to two quarters. The coefficient of policy rate was negative and statistically significant. An increase (decrease) in policy rate by 100 basis points causes the credit to decline (increase) by 1.95 per cent with a lag of six quarters, validating the existence of a robust credit channel of monetary transmission in India. The stressed asset ratio impacts credit growth negatively, suggesting that banks with higher stressed assets are forced to curtail their credit growth.
| Table 1: Regression – Determinants of Credit Growth | ||||
| Dependent Variable: Credit Growth | All Banks | Public Sector Banks | Private Sector Banks | Foreign Banks |
| Credit Growth (-2) | 0.101*** (0.002) |
0.048 (0.412) |
0.208*** (0.001) |
0.061 (0.319) |
| Σ GDP Growth (0 to -1) | 1.048*** (0.006) |
0.479* (0.096) |
0.787** (0.011) |
2.168* (0.064) |
| Σ Deposit Growth (0 to -2) | 0.476*** (0.000) |
0.642*** (0.000) |
0.621*** (0.000) |
0.483*** (0.000) |
| Σ Investmenta Growth (0 to – 2) | -0.106*** (0.009) |
-0.158*** (0.000) |
-0.108** (0.018) |
-0.111 (0.218) |
| Policy Rate (-6) | -1.951* (0.093) |
-2.742*** (0.003) |
-2.170** (0.031) |
-0.901 (0.811) |
| Stressed Asset Ratio | -0.470** (0.016) |
-0.748*** (0.003) |
-0.807*** (0.006) |
-0.889 (0.401) |
| Constant | 8.812 (0.317) |
23.335*** (0.001) |
14.387* (0.054) |
-13.724 (0.612) |
| Diagnostics: | ||||
| N | 969 | 356 | 324 | 289 |
| Sarganb test (p-value) | (0.455) | (0.730) | (0.784) | (0.627) |
| AB test for AR(1) in first differences | -7.490 (0.000) |
-6.173 (0.000) |
-6.191 (0.000) |
-8.159 (0.000) |
| AB test for AR(2) in first differences | 0.497 (0.619) |
0.321 (0.749) |
0.313 (0.755) |
2.065 (0.039) |
| Note: Estimated using dynamic panel-data estimation, one-step system GMM method. The fixed effects are removed by taking first differences. GDP growth, deposit growth, investment growth, policy rate and stressed assets are treated as endogenous variables. Instruments for first differences equation are lags of the endogenous variables as well as contemporaneous and lagged values of capital adequacy ratio, return of assets and logarithm of total assets. Instruments for levels equation: lags of the differences in the endogenous variables as well as contemporaneous and lagged values of capital adequacy ratio, return of assets and logarithm of total assets. a Investment in bonds. b Sargan test check for whether the null hypothesis of over identifying restrictions are valid. p-values in parentheses; * p<0.10, ** p<0.05, *** p<0.010 based on non-robust standard errors. Source: Authors’ estimates. |
||||
To sum up the above analysis, the decline in credit growth post 2013 was mainly due to a surge in bad loans, accentuated by a slowdown in GDP. The slowdown in deposit and the surge in investment growth also added to the slowdown in credit growth. Accommodative monetary policy, however, helped cushion the slowdown in credit growth.
The disaggregated analysis at the bank group level – public sector banks, private banks and foreign banks – suggests that results are broadly in line with those at aggregate level except the following. First, in the short-run, the credit channel of monetary transmission was found to be stronger in respect to public sector banks than that of private sector banks. Second, the coefficient of nominal GDP growth of private sector banks was higher than that of public sector banks, suggesting that the behavior of private sector banks is more pro-cyclical than that by public sector banks. Third, in the case of foreign banks, only economic activity and deposit growth were found to be the drivers of credit growth; the credit channel coefficient was statistically insignificant.
The regression results were found to satisfy the diagnostic tests in all four regressions. The Sargan and difference-in-Sargan tests suggest that the instruments are valid. The Arellano-Bond test – both AR(1) and AR(2) – suggests that there was no autocorrelation in residuals.
Regression estimates from four different specifications are presented in Table 2. In the first regression (Reg1), the asset quality is allowed to interact with monetary policy. The interaction term (policy rate*stressed asset ratio) was found to be statistically significant and positive. The positive sign indicates that higher value of the stressed asset ratio blunts the role of the credit channel of monetary policy. In other words, the positive and statistically significant interaction term in Reg1 of Table 2 suggests that worsening of asset quality impedes the credit channel of monetary policy transmission. Similarly, in the case of second regression (Reg2) of Table 2, the interaction term (policy rate*CRAR) was negative and statistically significant suggesting that banks with higher capital are in a better position to transmit monetary policy impulses to the credit market. That is, the higher capital adequacy ratio enhances the efficacy of the credit channel of monetary policy. Thus, while the poor asset quality lessens the impact of changes in the policy rate on credit growth, the higher CRAR reinforces the credit channel of monetary policy.
In the third equation (Reg3) of Table 2, the interaction term (policy rate*deposit growth) was also found to be negative and statistically significant, indicating that during the period of higher deposit growth, the credit channel of monetary policy is stronger. However, in the fourth regression (Reg4) in Table 2, the interaction term (policy rate*investment growth) was insignificant, indicating that investment growth did not play any role in determining the strength of the credit channel of monetary policy transmission.
| Table 2: Monetary Policy and Banks’ Balance Sheet | ||||
| Dependent Variable: Credit Growth | Monetary Policy Inter-action with | |||
| Reg1: Asset Quality | Reg2: Capital Adequacy | Reg3: Deposit Growth | Reg4: Investment Growth | |
| Credit Growth (-2) | 0.105*** (0.002) |
0.098*** (0.004) |
0.114*** (0.001) |
0.104*** (0.002) |
| Σ GDP Growth (0 to -1) | 1.287*** (0.002) |
1.074*** (0.005) |
0.793** (0.040) |
0.892** (0.019) |
| Σ Deposit Growth (0 to -2) | 0.477*** (0.000) |
0.461*** (0.000) |
1.428** (0.013) |
0.475 (0.000) |
| Σ Investmenta Growth (0 to -2) | -0.107*** (0.008) |
-0.107*** (0.007) |
-0.087** (0.030) |
0.032 (0.946) |
| Policy Rate (-6) | -3.233** (0.022) |
-2.542** (0.040) |
-0.590 (0.648) |
-2.229* (0.068) |
| Stressed Asset Ratio | -4.099* (0.073) |
-0.751*** 0.000 |
-0.584*** (0.003) |
-0.535*** (0.006) |
| Σ Policy Rate*Stressed Asset Ratio (0 to -3) | 0.570* (0.098) |
— | — | — |
| Σ Policy Rate*CRAR (0 to -3) | — | -0.063*** (0.002) |
— | — |
| Σ Policy Rate*Deposit Growth (0 to -3) | — | — | -0.161* (0.062) |
— |
| Σ Policy Rate*Investment Growth (0 to -3) | — | — | — | -0.034 (0.640) |
| Constant | 14.981 (0.114) |
20.104** (0.033) |
3.570 (0.692) |
13.493 (0.131) |
| Diagnostics: | ||||
| N | 969 | 969 | 969 | 969 |
| Sarganb test (p-value) | (0.395) | (0.489) | (0.375) | (0.396) |
| AB test for AR(1) in first differences | -9.018 | -10.474 | -7.353 | -5.803 |
| (0.000) | (0.000) | (0.000) | (0.000) | |
| AB test for AR(2) in first differences | 0.824 | 0.705 | 0.436 | 0.478 |
| (0.410) | (0.481) | (0.663) | (0.632) | |
| Note: Estimated using dynamic panel-data estimation, one-step system GMM method. The fixed effects are removed by taking first differences. GDP growth, deposit growth, investment growth, policy rate and stressed assets are treated as endogenous variables. Instruments for first differences equation: lags of the endogenous variables as well as contemporaneous and lagged values of capital adequacy ratio, return of assets and logarithm of total assets. Instruments for levels equation: lags of the differences in the endogenous variables as well as contemporaneous and lagged values of capital adequacy ratio, return of assets and logarithm of total assets. a Investment in bonds b Sargan test check for whether the null hypothesis of over identifying restrictions are valid. p-values in parentheses; * p<0.10, ** p<0.05, *** p<0.010; based on non-robust standard errors. Source: Authors’ estimates. |
||||
VI. Conclusion
In a bank dominated financial system such as India, the credit channel plays a critical role in transmitting monetary policy impulses to the credit market and from thereon to the real economy. In India, however, credit growth has slowed down sharply in the recent period even as the RBI has reduced the policy rate significantly. A wide divergence has also been observed in credit growth of public and private sector banks, suggesting that apart from common factors, some idiosyncratic factors are also at play. In this context, this paper examined the main determinants of credit growth in India with a specific focus on the impact of bank-specific characteristics, especially the role of asset quality on the credit channel of monetary transmission.
The results of the paper suggest that the credit channel of monetary policy transmission is robust in India. Its efficacy, however, is impaired if there is a deterioration in asset quality but is reinforced by better capital position of banks. Controlling for asset quality, in the short-run, the credit channel of monetary transmission of public sector banks is stronger relative to that of private sector banks. The credit deceleration in India since 2013, in part, could be attributed to a gradual worsening of asset quality. Other factors contributing to the slowdown of credit growth include a slowdown in economic activity and deposits. However, the accommodative stance of monetary policy and reduction in the policy repo rate (starting from 2019) helped cushion the credit deceleration. In the absence of a sharp cut in the policy repo rate, the slowdown in credit growth would have been far more severe. The credit growth slowdown would have been bolstered to some extent, if banks had maintained higher levels of capital position. Therefore, for monetary policy actions to have their full impact on the credit channel, it is imperative that the asset quality concerns of banks are addressed and that their capital positions are strengthened.
———–
@ The authors are former Executive Director, Officer-in-Charge, Director and Assistant Adviser, respectively, in the Reserve Bank of India.
1 The views expressed in the paper are those of the authors and not necessarily of the institution to which they belong. Comments received from Shri Supriya Majumdar and Shri Jibin Jose and participants in an internal seminar under the DEPR (Department of Economic and Policy Research) Study Circle and anonymous referees are gratefully acknowledged. The usual disclaimer applies.
Corresponding Author: joicejohn@rbi.org.in
2 Pair-wise Granger causality test for India shows that effective policy rate Granger causes credit growth in India (Report of the Expert Committee to revise and strengthen the monetary policy framework, RBI, 2014).
3 Source: Report on Trend and Progress, RBI, Various issues.
4 GNPA and stressed asset ratio are defined as GNPA) as a percentage of gross advances and stressed asset (GNPA + restructured assets) as a percentage of gross advances respectively.
5 This dependency of the borrowers on the banks could be a consequence of credit market imperfections. For example, small sized firms typically possess less information about credit conditions compared to a relatively larger firm (Diamond, 1984). Empirical exercises have shown that small-sized firms, typically having limited access to external finances, would be much more impacted by policy tightening than larger ones (Gertler and Gilchirst, 1994; Oliner and Rudebusch, 1994).
6 Based on the time series data of 57 SCBs and aggregated using simple average.
7 A notable exception being a sharp increase in growth of deposits for two quarter after demonetization. In our sample, deposit growth increased from 7.7 per cent in September 2016 to 13.5 per cent in March 2017. However, the deposit growth declined sharply thereafter to below 3 per cent one year later during the quarter ended on March 31, 2018. Similar movement was discernible in the case of growth in total asset also.
8 PSBs had contributed more than 76 per cent of the total credit in 2011. It has steadily lost its share to around 64 per cent at the end of 2018. However, on average over the sample period, the share of PSBs was more than 70 per cent indicating their importance in the overall bank credit growth in India.
9 Based on the time series data of 57 SCBs used in this paper.
10 Since the key focus of the paper is to study the impact of changes in the policy interest rate on aggregate bank credit, we have used the policy rate (repo rate) in the level form.
11 The GMM estimates help overcome the problem of endogeneity bias. The endogeneity bias makes the parameter estimates inconsistent leading to faulty conclusions and inappropriate interpretations.
————-
References
Acharya, V. V. (2017). Monetary transmission in India: Why is it important and why hasn’t it worked well?, Speech delivered at the Inaugural Aveek Guha Memorial Lecture at Homi Bhabha Auditorium, Mumbai in Tata Institute of Fundamental Research (TIFR), November 16, 2017. https://www.rbi.org.in/Scripts/BS_SpeechesView.aspx?Id=1049.
Arellano, M., & Bover, O. (1995). Another look at the instrumental variable estimation of error-components models, Journal of Econometrics, 68(1), 2951.
Bernanke, B., & Blinder, A. S. (1992). The federal funds rate and the transmission of monetary policy. American Economic Review, 82(4), 901-21.
Bernanke, B. S., & Gertler, M. (1995). Inside the black box: the credit channel of monetary policy transmission. Journal of Economic perspectives, 9(4), 27-48.
Berrospide, J., & Edge, R. (2010). The Effects of Bank Capital on Lending: What Do We Know, and What Does it Mean? Finance and Economics Discussion Series, Divisions of Research & Statistics and Monetary Affairs, Federal Reserve Board, Washington, D.C.
Bhaumik, Sumon Kumar, Vinh Dang, and Ali M. Kutan. (2011). ‘;Implications of bank ownership for the credit channel of monetary policy transmission: Evidence from India.’; Journal of Banking & Finance 35.9: 2418-2428.
Blundell, R., & Bond, S. (1998). Initial conditions and moment restrictions in dynamic panel data models. Journal of econometrics, 87(1), 115-143.
Calza, A., Gartner, C., & Sousa, J. (2001). Modelling the demand for loans to the private sector in the euro area. ECB Working Paper No. 55, European Central Bank.
Chaudhuri, K., & Sensarma, R. (2008). NPA in Indian banking: magnitude, determinants and impact of recent policy initiatives. India Development Report, Indira Gandhi Institute of Development Research, 134-44.
Chen, G., & Wu, Y. (2014). Bank ownership and credit growth in emerging markets during and after the 2008–09 financial crisis—A cross-regional comparison. IMF Working Paper WP/14/171, International Monetary Fund, Washington D.C. https://doi.org/10.5089/9781484390993.001.
Cottarelli, C., Dell’ Ariccia, G., & Vladkova-Hollar, I. (2005). Early birds, late risers, and sleeping beauties: Bank credit growth to the private sector in Central and Eastern Europe and the Balkans. Journal of Banking and Finance, 29(1), 83-104. http://dx.doi.org/10.1016/j.jbankfin.2004.06.017
Cucinelli, D. (2015). The Impact of non-performing loans on bank lending behavior: Evidence from the Italian banking sector. Eurasian Journal of Business and Economics, 8, 59-71. https:/doi.org/10.17015/ejbe.2015.016.04
Diamond, D. W. (1984). Financial intermediation and delegated monitoring. The review of economic studies, 51(3), 393-414.
Égert, B., Backé, P., & Zumer, T. (2006). Credit growth in Central and Eastern Europe: New (over)shooting stars? ECB Working Paper No. 687, European Central Bank.
Farinha, L., & Robalo, M. C. (2001). The bank lending channel of monetary policy: Identification and estimation using Portuguese micro bank data. ECB Working Paper No. 102, European Central Bank.
Fernández de Lis, S., Martínez Pagés, J., & Saurina Salas, J. (2000). Credit growth, problem loans and credit risk provisioning in Spain. Banco de España. Servicio de Estudios.
Bernanke, B., Gertler, M., & Gilchrist, S. (1994). The financial accelerator and the flight to quality (No. w4789). National Bureau of Economic Research.
Gozgor, G. (2014). Determinants of domestic credit levels in emerging markets: The role of external factors. Emerging Markets Review, 18, 1-18. https:/doi.org/10.1016/j.ememar.2013.11.003
Guo, K., & Stepanyan, V. (2011). Determinants of Bank Credit in Emerging Market Economies. IMF Working Paper WP/11/51, International Monetary Fund, Washington D.C.
Hernando, I., & Martinez-Pages, J. (2001). Is there a bank lending channel of monetary policy in Spain? ECB Working Paper No. 99, European Central Bank.
Imrana, K., & Nishatb, M. (2013). Determinants of bank credit in Pakistan: A supply side approach. Economic Modelling, 35, 384-390. http://dx.doi.org/10.1016/j.econmod.2013.07.022
John, J., Mitra, A., Raj, J., & Rath, D. (2016). Asset quality and monetary transmission in India. Reserve Bank of India Occasional Papers, 37(1-2), 35-62.
Kashyap, A. K., & Stein, J. C. (1994). Monetary policy and bank lending in Monetary policy (pp. 221-261). The University of Chicago Press.
Kashyap, A. K., & Stein, J. C. (2000). What do a million observations on banks say about the transmission of monetary policy? American Economic Review, 90(3), 407-428.
Nag, A. K., & Das, A. (2002). Credit growth and response to capital requirements: Evidence from Indian public sector banks. Economic and Political Weekly, 3361-3368.
Oliner, S. D., & Rudebusch, G. D. (1994). Is there a broad credit channel for monetary policy? Board of Governors of the Federal Reserve System, Economic Activity Section Working Paper Series No. 146.
Patel, U. R., (2014). Report of the expert committee to revise and strengthen the monetary policy framework. Reserve Bank of India, Mumbai.
Peek, J., & Rosengren, E. S. (2010). The role of banks in the transmission of monetary policy (pp. 257-277). Oxford: Oxford University Press.
Pham, T. H. H. (2015). Determinants of bank lending. HAL Id: hal-01158241. Available at https://hal.archives-ouvertes.fr/hal-01158241
MPC, RBI (2017). Sixth Bi-monthly Monetary Policy Statement, 2016-17 Resolution of the Monetary Policy Committee (MPC), Reserve Bank of India released on February 08, 2017.
Roodman, D. (2009). How to do xtabond2: An introduction to difference and system GMM in Stata. The stata journal, 9(1), 86-136.
Samantaraya. (2016). Procyclical credit growth and bank NPAs in India, Economic and Political Weekly, Vol No 12, pp 112-119.
Sapriza, H., & Temesvary, J. (2019). How does the strength of monetary policy transmission depend on real economic activity? Finance and Economics Discussion Series Divisions of Research & Statistics and Monetary Affairs Federal Reserve Board, Washington, D.C.
Sarkar, Sanjukta. (2020). ‘;Testing the presence and efficacy of the bank lending channel in India: The role of ownership, economic period and size.’; Journal of Social and Management Sciences: 29.
Tan, T. B. P. (2012). Determinants of credit growth and interest margins in the Philippines and Asia. IMF Working Paper WP/12/123, International Monetary Fund, Washington D.C. http://dx.doi.org/10.5089/9781475503524.001
Thaker, H. M. T., Ee, T. S., Sin, C. F., & Man, W. H. (2013). The macroeconomic determinants of bank credit in Malaysia: An analysis via the error correction model (ECM). Skyline Business Journal, 9(1), 1-9.
Vishwanathan, N.S. (2016). “Asset quality of Indian banks: Way forward”, Speech delivered at the National Conference of ASSOCHAM on “Risk Management: Key to Asset Quality”, New Delhi), September 07, 2016. https://www.rbi.org.in/Scripts/BS_SpeechesView.aspx?Id=1023.

