The recent surge in the market prompts a critical question: What is fueling this rally? Is it the expansion of Price-to-Earnings (P/E) ratios or the growth in earnings themselves? By delving into data spanning two decades, we uncover the driving forces behind the market’s trajectory.
Nifty at 27000 (FY26)
| % | 1 | 5 | 10 | 15 | 20 |
| Nifty 50 | 26.65 | 14 | 12.65 | 13.19 | 13 |
| Nifty 500 | 37 | 17 | 14.63 | 15 | – |
| Nifty Small cap 250 | 65.4 | 26.04 | 20.13 | 17.74 | 16.73 |
| USD/INR | 1.49 | 3.5 | 3.19 | 3.47 | 3.15 |
| Gold | 11.3 | 11.25 | 5.53 | 5.98 | 11.05 |
| Dow | 13 | 7.09 | 8.67 | 7.27 | 6.76 |
| Nasdaq | 30.23 | 17.12 | 17.18 | 18.57 | 13.3 |
| Nikkei | 32.42 | 11.07 | 9.99 | 10.25 | 5.89 |
| Shanghai | -7 | -0.2 | 4.08 | 1.42 | 3.31 |
–
| NIFTY | 2018-19 | 2019-20 | 2020-21 | 2021-22 | 2022-23 | 2023-24 | FY26* | FY25* |
| EPS | 405 | 425 | 385 | 700 | 815 | 950 | 1278.32 | 1102 |
| P/E | 26.3958 | 27 | 31.825 | 25.925 | 20.9667 | 22.1167 | 21 | 20 |
| Price | 10690.3 | 11475 | 12252.6 | 18147.5 | 17087.8 | 21010.8 | 26844.7 | 22040 |
| EPS Growth | 5% | -9% | 82% | 16% | 17% | |||
| P/E Growth | 2% | 18% | -19% | -19% | 5% |
EPS * Assuming that earnings grow at 16% (Average of 5 years)
P/E * Assuming that P/E stays moderate to flat (Average 5 Years)
Let’s screen some data and see that if at all the rally which the market has experienced was due to P/E expansion if not Earnings expansion or both. What we can make out is the rally was majorly earning driven thanks to rejig and favourable environment due to Covid and not much of P/E expansion also noting that expansion to happen the economy has to grow at an even higher pace.
When compare to major DM, the rally was driven due to P/E expansion except Magnificent Seven stocks. And if at all in the near term if interest rates stabilizes (it will) we could see P/E re-rating as prices would be driven due to:
1) Lower interest rates
2) Favourable demand environment
3) Rosy future – Earning consistency
Risk factors:
1) Crude at 110
2) Geopolitical uncertainty
3) Policy continuity
4) Eco growth should be higher than expected
5) Major payments and projects getting delayed due to election leads to slower movement of the economy now
The Liquidity Influx – Institutional Control
| FY | SIP contribution |
| FY 2020-21 | 96,080.00 |
| FY 2021-22 | 1,24,566.00 |
| FY 2022-23 | 1,55,972.00 |
| FY 2023-24 | 1,99,219.00 |
–
| DII | FII | |
| FY21 | -1,32,389.13 | 2,01,377.26 |
| FY22 | 2,21,659.89 | -2,74,244.23 |
| FY23 | 2,55,236.11 | -1,98,639.42 |
| FY24 | 2,06,716.72 | -14,393.64 |
Valuation play

–
Indian Financial market and economy
- Nifty at 22000+ level
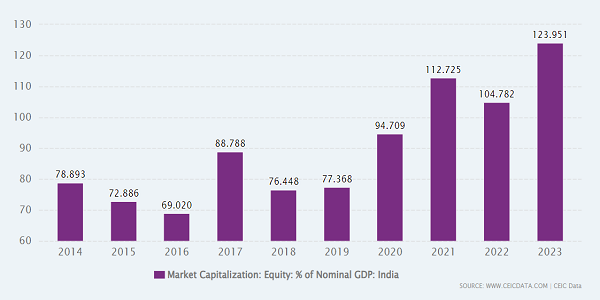
- Mutual fund AUM grew from ₹8.25 trillion as on March 31, 2014 to ₹53.40 trillion as on March 31, 2024
- The monthly gross SIP inflows that used to be Rs 8000 Cr in FY20 have now reached 19271 Cr in FY24
- GST Collection April @ 2.1 lac crore
- FPI holding of Indian equities hits decadal low even as fundamentals approach historical best – the lowest level in a decade at 16.2% from 20.5% and look at our Index and market levels
- The core, PMI both services and manufactures are on expansion phase
- Demat accounts as of Feb 2024 – 14.8 Cr
- In January 2024, the average daily turnover in the equity cash segment was at ₹1.15 lakh crore, up over 10 percent from December 2023
- Growing economy, subtle inflation, government polices focused more on supply side
- The policy pivot not following the western school methodology and more focus on maintaining the domestic strength and sovereignty
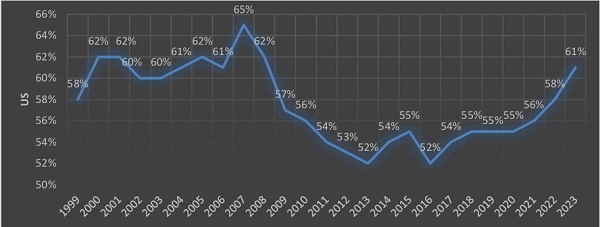
- The market would experience tremendous influx of liquidity as the household savings could touch ~8% Vs the household savings in the US surging from 19% to nearing double of that figure. the dowjones surged by a factor of ten during that period.
The data screams only one thing, the only risk at this current juncture is not staying invested.
What should investors do?
- Invest in Real Assets
- Optimal portfolio diversification – Depending upon one’s risk profile
- Invest across decadal theme – Will cover that in our next newsletter
Oneiromancy (FY26)
Given the low-interest rate environment and an influx of private capes, one could see P/E re-rating assuming a peak of 24x vs a 10-year average of 20.08. One could see the index trading at 30679.
Conclusion: In dissecting the market rally, it becomes evident that while P/E expansion has played a role, the primary driver has been the growth in earnings. Factors such as favorable economic conditions and COVID-induced shifts have propelled this earning-driven surge. Looking ahead, potential P/E re-rating, coupled with liquidity influx, signals optimism. For investors, diversification, thematic investments, and a focus on real assets remain prudent strategies in navigating the current market landscape.
*****
Disclaimer: This article provides general information existing at the time of preparation and we take no responsibility to update it with the subsequent changes in the law. The article is intended as a news update and Affluence Advisory neither assumes nor accepts any responsibility for any loss arising to any person acting or refraining from acting as a result of any material contained in this article. It is recommended that professional advice be taken based on specific facts and circumstances. This article does not substitute the need to refer to the original pronouncement


