Ratios are the measurement tools to analysis any company financial as well as non-financial growth. Ratio analysis gives a more accurate picture of a company. For comparison of company’s performance to similar company’s or industries to understand the position in the market.
1. Liquidity Ratios – To check the Short-Term Solvency
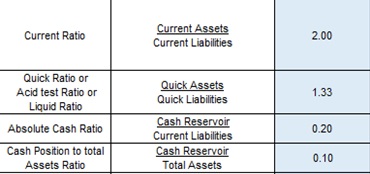
a) Current Ratio
Creditors consider this ration for evaluating a company’s credit status before short- term debts. It reflects the company’s ability to liquidate its assets for paying off its short-term liabilities. Current Ratio ideally should be 2 indicates ample liquidity.
b) Quick Ratio
It indicates the Company’s ability to repay its short-term liabilities and obligations with its liquid assets such as Cash, Bank, etc. Whether company will out of cash or not. A higher quick ratio is always better i.e. 1.33 standard Ratio
c) Absolute Cash Ratio
It measures a company’s liquidity to repay. Ideally cash ratio should be equal to or greater than 1 means enough cash to pay debts. Standard Ratio 0.20
d) Cash Position to Asset Ratio
It indicates how efficiently the business uses the assets to collect cash from sales and customers. The higher the better. Standard Ratio 0.10
2. Capital Structure Ratios – To ascertain Financing Techniques and verify the Long-Term Solvency
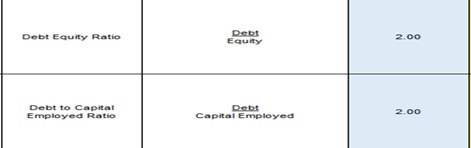
a) Debt Equity Ratio
It shows how the capital has been raised to run a business. Around 2 is generally considered to be good and varies industry to industry.
b) Debt to Capital Employed Ratio
A measurement of company’s financial leverage. Around 2 is consider standard ratio.
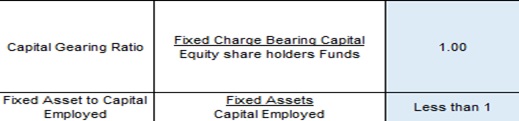
c) Capital Gearing Ratio
A measure of company’s financial risk and expresses the amount of a company’s debt in terms of its equity. Standard Ratio greater than 1.
d) Fixed Asset to Capital Employed Ratio
It indicates the extent to which the long-term funds are sunk in the fixed assets which are supplied by creditors and owner’s fund. Standard Ratio less than 1.
3. Coverage Ratios – To cover its obligations towards shareholders and lenders
a) Preference Dividend Coverage Ratio
A measure of a company’s ability to pay the required amount due to the owners of preference share capital. Standard Ratio is 3.
b) Equity Dividend Coverage Ratio
A measure of a company’s ability to pay the required amount due to the owners of equity share capital. Standard Ratio is 3.
c) Debt service Coverage Ratio
It measures company’s ability to repay loans, take on new financing and make dividend payments on time. Standard Ration is 3 times.
d) Interest coverage Ratio
A debt and profitability ratio used to determine how easily a company can pay interest on its outstanding debt.

4. Profitability Ratio – indicates the overall profitability
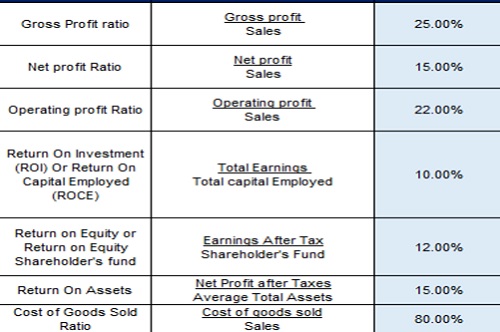
a) Gross Profit Ratio
Measure how profit company makes from sale of goods and services after deducting direct costs. Standard ratio should be 25 or as per industry standard.
b) Net Profit Ratio
It reveals the remaining profit after all costs and expenses deducted from sales. Compares after tax profit to net sales. Ideal ratio should be 15.
c) Operating Profit Ratio
It shows operating efficiency of management by comparing the total operating expense to net sales. Standard Ratio should be 22%.
d) Return on Investment / Return on Capital Employed
It calculates the benefit an investor will receive in relation to their investment cost. Standard ratio should be 10%.
e) Return on Equity / Return on Equity Shareholder’s Fund
It measures of financial performance calculated in relation to equity. The standard ratio should be 12%.
f) Return on Assets
It measures of financial performance of company which takes the use of assets into account. Ideally it should be 15%.
g) Cost of goods sold Ratio
It calculated to determine the direct cost required to generate a company’s revenue. Ideally it should be around 80%.
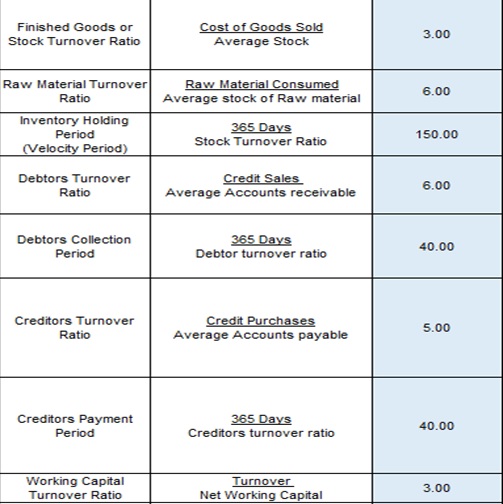
5. Activity Ratio – to determine the efficiency of the organization in utilizing its assets for generating revenue.
a) Stock Turnover Ratio
It measures how efficiently inventory is managed by the inventory manager. It should be preferably 3 in case of lower indicates maintaining excess stock or outdated or slow-moving stock.
b) Raw Material Turnover Ratio
It measures the rate at which a company’s inventory of raw materials is used and/or sold and replaced. Preferably it should be 6.
c) Inventory holding Ratio
It is the no. of times a company has sold and refilled its inventory over a specific period of time. Preferably it should be 150 days.
d) Debtors Turnover Ratio
It indicates the number of times average debtors have been converted into cash during a year. Preferably it should be 6.
e) Debtors Collection Period
its company’s average accounts receivable balance by its net credit sales for a specific period. Preferably it should be 40 days.
f) Creditors Turnover Ratio
A measure of how often a particular company pays off its debts to suppliers within a given period of time. Preferably it should be 5.
g) Creditors Payment Period
It measures the average time it takes you to pay your creditors. Preferably it should be 40 days.
h) Working Capital Turnover Ratio
It measures how efficiently a company using its working capital requirements to support revenue sales and growth. Preferably it should be 3.
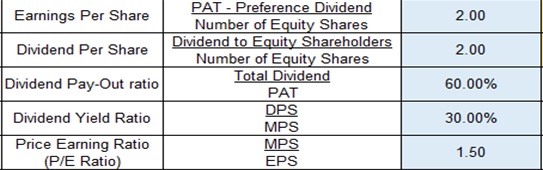
6. Financial Position Ratio – To gain meaningful information about a company.
a) Earnings per Share
It indicates how much money a company makes for each share of its stock. Ideally it should be 2.
b) Dividend per Share
It is the total amount of dividends attributed to each individual share outstanding of a company. Preferably it should be 2.
c) Dividend Payout Ratio
It measures the Net income that is distributed to shareholders in the form of dividends. Standard ratio 60%.
d) Dividend Yield Ratio
It measures the annual value of dividends received relative to the market value per share of a security. Standard ratio 30%.
e) Price Earnings Ratio (P/E Ratio)
It provides indication whether a stock at its current market price is expensive or cheap. It should be 1.5 as standard.

Author Bio