“Progress is impossible without change, and those who cannot change their minds cannot change anything”. – George Bernard Shaw
Introduction: Machine learning (ML) is the study of computer algorithms that improve automatically through experience and by the use of data.
1. It is seen as a part of artificial intelligence. Machine learning algorithms build a model based on sample data, known as “training data”, in order to make predictions or decisions without being explicitly programmed to do so.
2. Machine learning algorithms are used in a wide variety of applications, such as in medicine, email filtering, and computer vision, where it is difficult or unfeasible to develop conventional algorithms to perform the needed tasks.
So, now where do CA’s are found important in the Machine Learning. Since, now a days everything is the game of data. The more we are comfortable with the analysis of big data, the more efficiency it provides us in our assignment(s). There are copious techniques to frolic with the jumbled data, it reduces our work efforts and present the data in much shrewd manner.
There are various programming languages which are used by the Data Scientists. But, one which is considered as easy to learn is Python. Python was conceived in the late 1980s by Guido van Rossum at Centrum Wiskunde & Informatica (CWI) in the Netherlands. Machine Learning and data analysis with Python is much more effective and efficient than excel. Currently we are having hands on excel and many of us might have gain proficiency in that, but on the contrary excel might have some limitation regarding the data it can handle, the processing time to display the result.
Libraries and its Function
1. Data Analytics: As a CA we always focus on data analysis. Data analysis focuses on understanding the past: what happened and why it happened. Data Analysis is rooted in statistics, which has a pretty long history.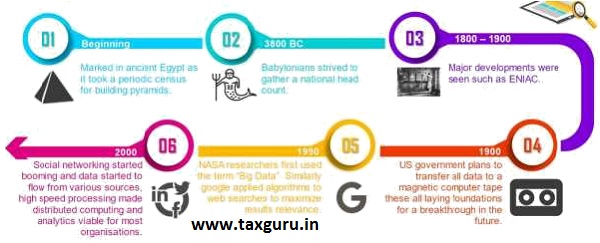
By the year 2018, more than 2.5 quintillion bytes of data were created every day and the digital world had been generating jaw-dropping amounts of data. It was the year when people used over 3.1 million gigabytes of internet data.
– Social Media Today
The rate at which we create information has been growing for years at a more-or-less predictable rate. As such, we can get a decent idea of how much data will exist in the world a few years from now. The relevant data stats agree that there should be around 175 zettabytes of data by 2025. It’s a number that’s hard to envision! But as you read on, you’ll get a better idea of its scope.
– Seagate UK
From the above diagram we can see that where does the need of analytics has arose from. Therefore, data analytics, focuses on why it happened and what may happen in the future based on the previous data. It is a multidisciplinary field. In this there is an extensive use of computer skills, statistics, mathematics and predictive models to gain valuable insights from data through analytics. Data analytics can be performed under various fields such as Portfolio Analytics, Risk Analytics, and Security Analytics.
In the assignments like System Audits, Forensic Audit & Accounting, and Fraud Detection; auditor is considered to be a blood hound and not a watch-dog as in the case of traditional audit practices. In that case, these types of machine learning languages and their data packs and data library lead us like a knight in shining armour. These languages can aid us finding the lacunas in the system in much effective manner.
Therefore, in today’s era when professional work is not only limited to traditional practice i.e., Tax Audits and Income Tax Returns, this data analytics technique may be very efficacious in our assignments.
2. Automation: Automation describes a wide range of technologies that reduce humanintervention in processes. Human intervention is reduced by predetermining decision criteria, subprocess relationships, and related actions — and embodying those predeterminations in machines.
As we have seen automation in every sector of the industry rather it would be manufacturing, assembling or any other unit, then why we as a CA are lacking in the process automation. We have been using automation of work with the help of software utilities we use in our offices. Then what next?
We may automate the process of arranging the data and analyzing the data. In our daily practice we prepare and arrange the data either manually or through a software like MS Excel, after this arrangement we see the results and compare according to our need. What if a code can help us to give an output like arranging the data and giving the output simultaneously?
Yes, it can be done in a single shot with programming language or coding language which will reduce the double efforts implied in current programming software
3. Data Mining: Machine learning and data mining often employ the same methods and overlap significantly, but while machine learning focuses on prediction, based on known properties learned from the training data, data mining focuses on the discovery of (previously) unknown properties in the data (this is the analysis step of knowledge discovery in databases). Data mining uses many machine learning methods, but with different goals; on the other hand, machine learning also employs data mining methods as “unsupervised learning” or as a preprocessing step to improve learner accuracy.
This data mining technique helps in finding anomaly the data set available with the auditor. Before initiating the data mining process, the data is preprocessed i.e., assembled for the purposeful use. Data mining can only uncover the patterns actually present in the data; therefore, the target dataset must be large enough so that patterns can be found within acceptable time limit.
The data mining through the pre-processing may help us is finding:
i. Anomaly Detection: Identification of unusual data record, that might be interesting or data errors that require further investigation. For ex: A Company hires a fresher data engineer with a salary of Rs. 60,000 p.m. whereas average salary for a fresher data engineer is Rs. 40,000 p.m. So, this may be treated as anomaly and it can be found out with the help of anomaly detection at pre-processing stage of data mining.
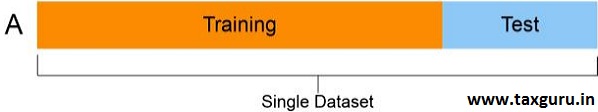
ii. Classification: Classification is the task of generalizing known structure to apply to new data. For example, an e-mail program might attempt to classify an e-mail as “legitimate” or as “spam”. This technique helps us to use the relevant data set for our test check. Unwanted data entries are segregated from these train set and new test set is prepared in which all the processing is done. Let us consider the example, if we have a data of around 200 employees, we can classify them into training and test set, through which we will evaluate that salary of Rs. 60,000 to a fresher employee is fair or not.
iii. Regression: Regression technique attempts to find a function that models thedata with the least error i.e., for estimating the relationships among data or datasets. This technique helps us to find out inconsistency in a data entry which may contradict to the whole dataset. Through regression technique we solve many real-life practical problems which we face in our assignments. For instance, in the example above; through regression technique we may find out that what should be the salary for a fresher data engineer and is there any variance in the salary offered to any person in the organization. If yes, we find out the reason of doing so.
iv. Summarization: Summarization is providing a more compact representation ofthe data set, including visualization and report generation. At this stage a data can also presented into graphical manner which may clearly depict the result/output as tested in the dataset.
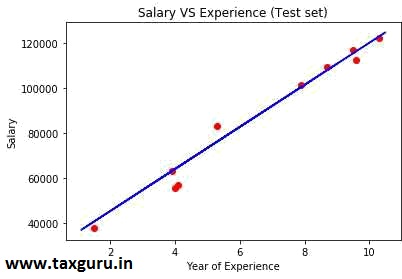
In the above graph we can observe that people having different year of experience have different salary and as experience increases salary also increases and it shows that for fresher salary is approx. Rs. 40,000 p.m. but in our example, we have considered that actual salary paid was Rs 60,000 p.m., therefore, this regression technique can provide the output in such a manner which is easy to interpret.
It was just a single example considered in this article, there may be ‘n’ number of events in which such coding languages can be used and as a professional we can form ‘n’ number of programs which can reduce the efforts and will efficiently improve the flow of the assignment.
Opportunities
As a Chartered Accountant, we cannot plump for fields like a software engineer, but there are numerous organization(s) which may prefer an IT aware CA over a conventional CA.
1. Machine Learning Engineer: A Machine Learning Engineer is an engineer that runsvarious machine learning experiments using programming languages such as Python, Java, Scala, etc. with the appropriate machine learning libraries. Some of the major skills required for this are Programming, Probability, and Statistics, Data Modeling, Machine Learning Algorithms, System Design, etc. A Machine Learning Engineer analyzes data to create various machine learning algorithms that run autonomously with minimal human supervision.
2. Data Scientist: Data science is an interdisciplinary field that uses scientific methods, processes, algorithms and systems to extract knowledge and insights from structured and unstructured data, and apply knowledge and actionable insights from data across a broad range of application domains. Data science is related to data mining, machine learning and big data. So, data scientists are those who are aware and handy of such methods and techniques of data mining, processing big data and machine learning. A Data Scientist uses advanced analytics technologies, including Machine Learning and Predictive Modeling to collect, analyze and interpret large amounts of data and produce actionable insights. These are then used to make business decisions by the company executives. Data Science Course teach the fundamentals of interpreting data.
There are other various other jobs/posts like NLP (Natural Language Processing) Scientist, Business Intelligence developer, Human-Centered Machine Learning Developer and many other jobs in this field, but as a CA we just have to be technologically aware, so that at least we can use methods and techniques of Data Scientist or Machine Learning Engineer.
Apart from this coding stuffs, there is another technology known as BI (Business Intelligence), and there are software(s) which extricate the professional arduous, and in a manner relieve the workload of a CA. Through BI we can perform the above techniques like data analytics and data mining with a user-friendly interface. BI technologies provide historical, current, and predictive views of business operations. Common functions of business intelligence technologies include reporting, online analytical processing, analytics, dashboard development, data mining, process mining, complex event processing, business performance management, benchmarking, text mining, predictive analytics, and prescriptive analytics. Software which can be in focus in the coming years are:
1. Microsoft Power BI:

Power BI is a business analytics service by Microsoft. It aims to provide interactive visualizations and business intelligence capabilities with an interface simple enough for end users to create their own reports and dashboards. It is part of the Microsoft Power Platform. With power BI, we can just prepare a graphical representation in some seconds like bar charts, tree maps, pie charts, matrix, map, and many other such representation. This software can be a great substitute of Excel Pivot Tables and Data Charts.
2. Tableau (pronounced as Tab-LOH) Software:

It is an American interactive data visualization software company focused on business intelligence. Tableau has a mapping functionality, and is able to plot latitude and longitude coordinates. The built-in geo-coding allows for administrative places (country, state/province, county/district, postal codes) to be mapped automatically.
Tableau vs Microsoft Power BI
1. Tableau is little difficult from Microsoft’s Power BI in terms of learning of interface; and
2. Tableau is used by analysts who are experienced users whereas Power BI can be used by naïve and experienced.
3. Tableau platform is known for its data visualization functionalities whereas Power BI offers numerous data points to offer data visualization.
4. Tableau can handle a huge volume of data with better performance while Power BI can handle limited volume of data.
5. Tableau is suitable for medium and large type of organization whereas Power BI is suitable for all types including small organizations.
Conclusion
“Growth is painful, Change is painful. But nothing is as painful as staying stuck somewhere you don’t belong.” This quote by N.R. Narayana Murthy, sum up my article. In any profession and/or business to grow we have to change. So, in today’s emerging world it is imperative to change methods and techniques which are not in line with the growth/progress which the world is making.
Now a days, schools are also introducing coding languages in their curriculum. To retain our profession indisputably at top, it is need of the hour that we also change our methods and techniques for various assignments we take. No one can grow or succeed in life until and unless, one is ready to change for the good.
References:
1. Wikipedia
2. Article on Can a Chartered Accountants become Data Scientistpublished on Analytics India Mag
3. ICAI Learning Portal, Self-Paced course on Applying Analytics for Finance Professional.
4. Article on How much data is created every day; By Branka Vuleta published on Seed Scientific
5. Article on Top Career Paths in Machine Learningpublished on Geeks for Geeks
6. Article on Top 10 Alternative to Power BI: Overview of Business Intelligence Platformspublished on Finances Online.
7. Article on Tableau vs Power BI: Key Differences published on Guru99
*****
About the Author: A Chartered Accountant by qualification and teacher, trainer & mentor by Passion. I have completed my CA in May 2017 and I am practicing chartered accountant in jodhpur. I have also completed DISA (ICAI) certification. I have done my graduation in B. Com Accounting Honors. Apart from profession, I am passionate about personality development classes and I conduct seminars in various schools and colleges.
E-mail id: mayank.mandora@gmail.com
I do hereby confirm that all the information in this article is originally written and/or compiled by me from various sources and it has not been published/broadcasted/hosted elsewhere including any website.

Author Bio