Study – Analysis of Profit and Loss of Individual Traders dealing in Equity F&O Segment – Jan 25, 2023
Research : Research Papers/articles
I. Objective of the Study
To analyze the trading by individual investors1 with regard to net profit/ loss2 incurred by them in the equity F&O segment for the period FY19 and FY22 only. The periods of study have been suitably selected keeping in view the influx of individual investors in the last three years, so as to comparatively analyze the trends before and after Covid-19 outbreak.
II. Executive Summary
Individual Client Level – Across All Products in Equity F&O Segment
Client Participation
- Total number of unique individual traders who traded through sample of top 10 brokers3 in equity F&O segment was 45.2 lakhs during FY22, up from 7.1 lakhs during FY19 (significant increase by over 500% in FY22 as compared to FY19), of which 88% were active traders4.
- During FY22, Individual traders belonging to age group 30-40 years had the highest share in participation (39%) across all age groups. For younger individual traders (2030 years), the percentage share of participation went up significantly from 11% during FY19 to 36% during FY22.
- The trading by individual traders in equity F&O segment were dominated by males (>80%) during both the years.
Loss Makers (Read Note-5)
- 89% of the individual traders (i.e. 9 out of 10 individual traders) in equity F&O segment incurred losses, with an average loss of Rs. 1.1 lakh during FY22, whereas, 90% of the active traders incurred average losses of Rs. 1.25 lakh during the same period.
- For the group of active traders (excluding outliers7), on average, loss makers registered net trading loss close to ₹ 50,000 in FY22.
- For the group of active traders (excluding outliers), the average loss of a loss maker was over 15 times the average profit by a profit maker during FY22.
Profit Makers (Read Note-8)
- During FY22, 11% of individual traders in equity F&O segment made profit with an average profit of Rs. 1.5 lakhs. The percentage went down marginally to 10% for active traders, though the average profit made by them went up to Rs. 1.9 lakh during the same period.
- For the group of active traders (excluding outliers), only 6% of individual traders in equity F&O segment made profit with an average profit of nearly Rs. 3,400 in FY22.
- The top 1 percent and top 5 percent active profit makers accounted for nearly 51% and 75% of the total net profit earned by all active profit makers, respectively.
Product wise Analysis
Client Participation
- No. of individual traders in index options and stock options went up by nearly 8 and 5 times, respectively, in last 3 years.
- Among all the unique individual traders who traded in equity F&O segment, 98% traded in options while 11% traded in futures during FY22 as compared to 89% and 43%, respectively, during FY19.
- During FY22, the share of young individual traders’ (20-30 years) participation in equity F&O segment, especially in index options and stock options, went up beyond 30% each from nearly 11% in FY19.
Loss Makers
- During FY22, 89% of the individuals who traded in index options, 82% of the individuals who traded in the stock options incurred average loss of Rs. 0.77 lakh and Rs. 0.66 lakh, respectively. The percentage of loss makers were 74% and 67% for index futures and stock futures with an average loss of Rs. 0.96 lakh and Rs. 2.1 lakh respectively.
- Youngest age group (<20 years), which accounted for around 1% share in participation, witnessed the highest average profit by profit makers as well as highest average loss by loss makers in futures segment as compared to all other age groups in FY22.
Profit Makers
- During FY22, the average profit earned by profit makers was highest in stock futures (Rs. 2.4 lakh), followed by index options (Rs. 0.92 lakh).
- During FY22, the average loss incurred by female loss makers as well as average profit made by female profit makers was higher than their male counterparts in all product categories, however, females had less than 20% share in participation.
Transaction Cost (TC)9
Across All Products
- During FY22, over and above the net trading losses incurred, loss makers expended an additional 28% of net trading losses as transaction costs (for the group of active traders excluding outliers) (, reflecting frequent trading. For non-active traders who made losses, the percentage was significantly low at 8%.
- Even those making net trading profits, incurred between 15% to 50%10 of such profits as transaction cost. However, the percentage was significantly low at 6% for non-active traders who made profit.
Product Wise TC11
- During FY22, the TC as percentage of net trading profit, declined across all product categories over FY19.
- During FY22, TC as percentage of net trading profit, was highest for index options (21%), followed by index futures (17%), whereas, it was comparatively lower for stock futures (11%) and stock options (8%).
Attribute wise TC11
- During FY22, a declining trend in TC as percentage of net trading profit, was seen for profit makers belonging to age groups >30 years (range of 25% to 26%) as compared to FY19 where the range was 27% to 31%.
- Male profit makers spent higher TC as percentage of net trading profit, than female profit makers in both the years.
Note: Details on data collection, methodology, data analysis and observations are provided in the subsequent sections.
III. Data Collection
For the study, individual client-wise (which includes HUF and NRIs but excludes Proprietary traders, institutions, partnership firms etc.) data of realized net trading profit /loss incurred during FY19 and FY22 has been collected from the top 10 brokers (based on individual traders’ turnover for the period FY22) in equity F&O segment of NSE. These top 10 brokers account for nearly 50 percent and 67 percent of the individual client level turnover in NSE equity F&O segment during FY19 and FY22, respectively.
IV. Methodology
In order to analyse the net profit/ loss12 of individual traders dealing in equity F&O segment, data has been collated from top 10 brokers with respect to realized net trading profit/loss, transaction cost, number of transactions carried out during the analysis period, various demographic parameters which includes age, gender, and city. Further, most of the data fields have been divided into sub-categories as mentioned in the Table 1 below, in order to have a holistic as well as an in-depth view of the P&L of individual traders across different categories.
Table 1: Description of Data fields
| Sl. No. | Data Fields/ Parameters |
Sub-category |
| 1 | Product Category | Index Options, Stock Options, Index Futures, Stock Futures |
| 2 | Age | <20, 20-30, 30-40, 40-50, 50-60, >60 (years) |
| 3 | Gender | Male/ Female |
| 4 | City | Tier I, Tier II, Tier III* |
* top 5 cities each from Tier I, Tier II, Tier III (a total of 15 cities) respectively were selected based on turnover in cash market during FY22; Further, a pin code mapping has been done for these 15 cities as per the information available in https://data.gov.in/ in order to maintain consistency across all the brokers. Data pertaining to all cities except these 15 cities have been clubbed under category ‘others’
- Sample Brokers: Top 10 brokers (brokers were identified on the basis of largest percentage share of individual traders’ turnover in equity F&O segment of NSE during FY22)
- Client-set: Individual Clients (which includes HUF and NRIs; excludes Proprietary traders, institutions, partnership firms etc.)
- Period: FY 2018-19 and FY 2021-22
- Segment: Equity F&O Segment
- Variables: Product category, Age, Gender, City, net trading Profit/Loss, Transaction cost
- For computation of profit/loss- realized profit/loss during the period is considered.
- For clarity w.r.t cases where 1 leg of transaction falls under the study period, while, other falls outside, explanation is given as under-
- Example 1: Period: FY 2018-19; Consider Contract-A with expiry in April 2018. Contract- A purchased & sold during March 2018 – will not be considered Contract- A purchased during March 2018, sold during April 2018/ settled on expiry – will be considered.
- Example 2: Period: FY2018-19; Consider Contract-B with expiry in April 2019. Contract- B purchased & sold during March 2019 – will be considered
Contract- B purchased during March 2019, sold during April 2019/ settled on expiry – will not be considered.
- Contracts resulting in physical delivery of stocks are excluded.
- For PIN Codes correspondence address is considered.
- Active Traders- Based on distribution of number of trades by individual traders in FY19 and FY22, active traders are defined as individual traders who had traded more than 5 times during a year.
- Outliers: Individual traders belonging to top 5 and bottom 5 percentile of the P&L distribution during a year.
V. Data Analysis and Observations
A. Across All Products (Individual Client Level)
A.1. Individual Traders’ Participation
Table A.1.1: Individual Traders’ Participation in Equity F&O Segment
| All Individual Traders |
Active Individual Traders |
Non-active Individual Traders | Active Trimmed Individual Traders |
||||||||
| FY19 | FY22 | FY19 | FY22 | FY19 | FY22 | FY19 | FY22 | ||||
| Total number of individual traders (sample) | 7,06,757 | 45,24,841 | 6,17,652 | 39,76,419 | 89,105 | 5,48,422 | 5,55,886 | 35,78,777 | |||
| % of total | 100% | 100% | 87% | 88% | 13% | 12% | 79% | 79% | |||
| % of Loss makers during the year | 85% | 89% | 87% | 90% | 76% | 83% | 91% | 94% | |||
| % of Profit makers during the year | 15% | 11% | 13% | 10% | 24% | 17% | 9% | 6% | |||
Note:
Active Individual traders: Individual traders who traded in equity F&O segment more than 5 times in a year Active Trimmed distribution excludes outliers from the group of active individual traders i.e. trimming of top 5 and bottom 5 percentile from the P&L distribution of all active individual traders.
Chart A.1.1: Percentage of Loss Makers

Observations:
- Total number of unique individual traders in the sample who traded in equity F&O segment was 45.2 lakhs during FY22, up from 7.1 lakhs during FY19 (significant increase by over 500% in FY22 as compared to FY19), of which 88% were active traders.
- 89% of the individual traders (i.e. 9 out of 10 individual traders) in equity F&O segment incurred losses during FY22, up from 87% in FY19. The percentage went up to 90% for active traders and further to 94% on excluding the outliers from active individual traders’ group (active trimmed) during FY22.
- The percentage of loss makers was marginally lower at 83% for non-active individual traders during FY22, though as compared to FY19, it went up from 76%.

A.2. Profit/ Loss made by Individual Traders
Table A.2.1: Summary Statistics of P&L of Individual Traders in Equity F&O Segment
| All Individual Traders |
Active Individual Traders |
Non-active Individual Traders |
||||||
| FY19 | FY22 | FY19 | FY22 | FY19 | FY22 | |||
| Average P&L | -1,26,909 | -82,536 | -1,44,194 | -93,357 | -7,096 | -4,075 | ||
| Median P&L | -21,644 | -15,872 | -30,577 | -21,769 | -1,117 | -663 | ||
| 25 percentile P&L | -96,557 | -66,373 | -1,17,602 | -80,221 | -4,786 | -2,909 | ||
| % of individual traders made loss | 85% | 89% | 87% | 90% | 76% | 83% | ||
| % of individual traders made profit | 15% | 11% | 13% | 10% | 24% | 17% | ||
| Average profit made by profit makers | 1,46,791 | 1,51,997 | 1,81,919 | 1,86,399 | 10,927 | 6,221 | ||
| Average loss made by loss makers | -1,73,646 | -1,11,216 | -1,94,020 | -1,24,528 | -12,730 | -6,217 | ||
| Average net trading profit made by profit makers | 1,75,332 | 1,78,702 | 2,17,674 | 2,19,308 | 11,570 | 6,641 | ||
| Average net trading loss made by loss makers | -1,38,958 | -90,512 | -1,55,019 | -1,01,260 | -12,098 | -5,737 | ||
Note: All Values are in Rs.
Observations:
- Individual traders in equity F&O segment incurred an average P&L of (-) Rs. 82,500 during FY22, down from average P&L of (-) Rs. 1.3 lakhs during FY19.
- The average P&L was even worse for active individual traders amounting (-) Rs. 1.4 lakhs and (-) Rs. 93,000 during FY19 and FY22 respectively. However, the magnitude of P&L was significantly less for non-active individual traders during the same period.
- 89% of the individual traders (i.e. 9 out of 10 individual traders) in equity F&O segment incurred losses, with an average loss by loss makers of Rs. 1.1 lakh during FY22. Whereas, 90% of the active traders incurred losses with an average loss by loss makers at Rs. 1.25 lakh during the same period.
- During FY22, 11% of individual traders in equity F&O segment made profit with an average profit of Rs. 1.5 lakhs. The percentage of profit makers declined marginally to 10% for active traders, though the average profit made by them went up to Rs. 1.9 lakh.
From the distribution of P&L of all individual traders, it is observed that the average profit/loss incurred by active as well as non-active individual traders during both the years was significantly below the 25th percentile of the entire distribution, indicating significant skewness in the below 25th percentile. Therefore, it is relevant to look into the trimmed distribution of P&L of active individual traders (excluding top & bottom 5 percentile each) in order to analyze the P&L trends.
Chart A.2.1: Distribution of P&L of Individual Traders (Active Trimmed)
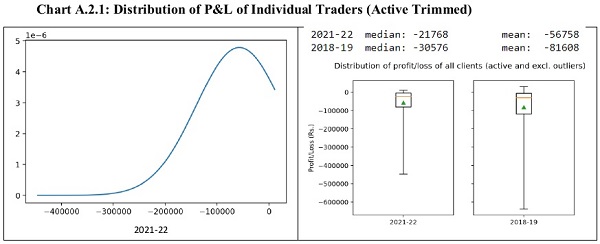
Table A.2.2: Summary Statistics of P&L of Active Individual Traders (excluding Outliers)
| Active Trimmed | ||
| FY19 | FY22 | |
| Average P&L | -81,608 | -56,758 |
| Median P&L | -30,576 | -21,768 |
| 25th percentile P&L | -1,01,563 | -69,489 |
| % of individual traders made loss | 91% | 94% |
| % of individual traders made profit | 9% | 6% |
| Average profit made by profit makers | 8,347 | 3,365 |
| Average loss made by loss makers | -90,691 | -60,314 |
| Average net trading profit made by profit makers | 15,989 | 7,030 |
| Average net trading loss made by loss makers | -68,469 | -46,969 |
Note: All Values are in Rs.
Observations:
- On average, loss makers registered net trading loss close to ₹ 50,000 in FY22. The average net loss of a loss maker was over 15 times the net profit made by a profit maker (for the group of active traders excluding outliers .i.e. active trimmed).
- For the group of active traders (excluding outliers), 6% of individual traders in equity F&O segment made profit with an average profit of Rs. 3,365 in FY22.
- The average loss made by loss makers belonging to active trimmed cohort went down to Rs. 60,314 during FY22 from Rs. 90,691 in FY19. Similarly, for profit makers, the average profit went down to Rs. 3,365 from Rs. 8,347 during the same period.
- The top 1 percent and top 5 percent active profit makers accounted for nearly 51% and 75% of the total net profit earned by all active profit makers, respectively.
A.3. Attribute wise Individual Traders’ participation and P&L made by Individual Traders
A.3.1. Age Group wise Analysis
Chart A.3.1.1: Age-group wise Client Participation
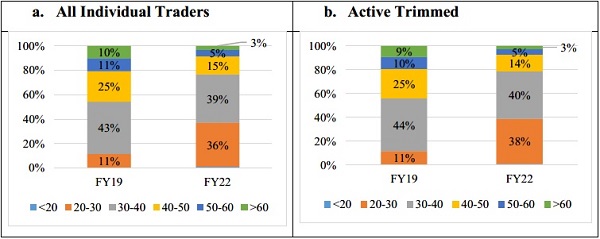
Note: Individual traders whose age is not available in sample dataset are not illustrated in above chart. Therefore, sum total of age-group wise percentage share may not add to 100 in some cases.
Observations:
- During FY22, individual traders belonging to age group 30-40 years had the highest share in participation (39%) across all age groups. (Chart A.3.1.1.a)
- For younger individual traders (20-30 years), the percentage share of participation went up significantly from 11% during FY19 to 36% during FY22. (Chart A.3.1.1.a)
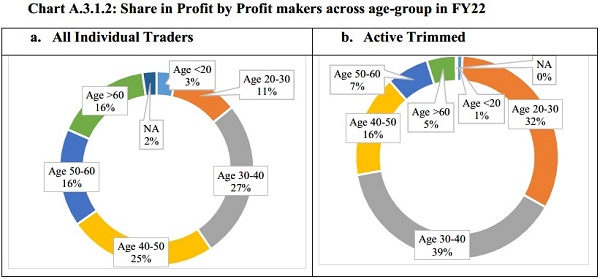
Chart A.3.1.2: Share in Profit by Profit makers across age-group in FY22
Observations:
- The share in profit by profit makers belonging to different age groups varies significantly for all individual traders as well as for individual traders belonging to the cohort of active trimmed.
- The share in profit by profit makers belonging to age group 20-40 years went up significantly to 71% for active trimmed cohort as compared to 38% for all individual traders.
- The individual traders belonging to age group 30-40 years accounted for the highest share (39%) in profit earned by all profit makers in FY22 (active trimmed)
Table A.3.1.1: Average P&L across age groups
| Age groups | Average P&L |
Average profit made by profit makers |
Average loss realized by loss makers |
Average P&L |
Average profit made by profit makers |
Average loss realized by loss makers |
| FY19 | FY22 | |||||
| All Individual Traders | ||||||
| <20 | -4,11,964 | 11,26,282 | -10,42,881 | -9,257 | 4,91,825 | -65,780 |
| 20-30 | -59,835 | 60,453 | -77,387 | -48,741 | 58,283 | -58,735 |
| 30-40 | -95,261 | 85,819 | -1,21,342 | -93,702 | 1,07,378 | -1,16,821 |
| 40-50 | -1,50,382 | 1,62,157 | -2,06,138 | -1,21,895 | 2,06,558 | -1,72,651 |
| 50-60 | -2,08,134 | 1,81,194 | -2,90,151 | -1,20,892 | 2,99,920 | -2,08,661 |
| >60 | -1,79,994 | 2,51,569 | -2,88,478 | -1,10,214 | 3,75,255 | -2,44,970 |
| Active Trimmed Distribution | ||||||
| <20 | -1,26,541 | 10,604 | -1,46,716 | -27,161 | 2,882 | -28,864 |
| 20-30 | -49,575 | 6,944 | -55,278 | -40,799 | 3,019 | -43,266 |
| 30-40 | -73,753 | 7,790 | -81,197 | -62,994 | 3,415 | -66,780 |
| 40-50 | -94,367 | 8,856 | -1,04,778 | -73,001 | 3,721 | -77,795 |
| 50-60 | -99,937 | 9,198 | -1,12,310 | -75,322 | 3,834 | -81,301 |
| >60 | -1,02,662 | 9,593 | -1,17,712 | -82,397 | 4,124 | -89,806 |
Note: Values are in Rs.
Observations:
- The average profit earned by profit makers belonging to the youngest age group (with below 1% share in participation) was highest as compared to all other age groups during both FY19 and FY22.
- During FY22, the average loss made by loss makers was significantly low for the younger group (<30 years) of individual traders, whereas for senior citizens, it was highest.
A.3.2. Gender wise Analysis
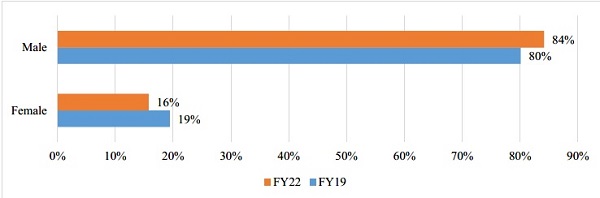
Chart A.3.2.1: Gender wise Client Participation (All Individual Traders)
Observations:
- The trading by individual traders in equity F&O segment were dominated by males (>80%) during both the years.
- The percentage share for male individual traders went up to 84% during FY22 from 80% in FY19.
Chart A.3.2.2: Share in Profit by Profit makers across Gender group in FY22

Observations:
- During FY22, females had nearly 16% share in participation in equity F&O trading, however, the share in profit by female profit makers was 28%.
- Within the group of active trimmed individual traders, the share in profit by female profit makers stood at 21% during FY22.
Table A.3.2.1: Average P&L across gender group
| Age groups | Average P&L |
Average profit made by profit makers |
Average loss realized by loss makers |
Average P&L |
Average profit made by profit makers |
Average loss realized by loss makers |
| FY19 | FY22 | |||||
| All Individual Traders | ||||||
| Female | -1,24,186 | 1,62,524 | -1,86,809 | -79,480 | 1,88,196 | -1,29,421 |
| Male | -1,25,631 | 1,30,590 | -1,66,330 | -83,651 | 1,32,834 | -1,07,594 |
| Active Trimmed Distribution | ||||||
| Female | -88,058 | 9,116 | -99,882 | -62,634 | 3,707 | -67,673 |
| Male | -79,863 | 8,107 | -88,317 | -55,688 | 3,284 | -59,002 |
Note: Values are in Rs.
Observations:
- The average profit earned by female profit makers as well as average loss incurred by female loss makers were more than their male counterparts for both FY19 and FY22.
- The average loss made by female loss makers was Rs. 1.3 lakhs during FY22, down from an average loss of Rs. 1.9 lakhs during FY19. Similarly, average loss made by male loss makers was Rs. 1.1 lakhs during FY22, down from Rs. 1.7 lakhs during FY19.
A.3.3. City Group wise Analysis
Chart A.3.3.1: City Group wise Client Participation (All Individual Traders)
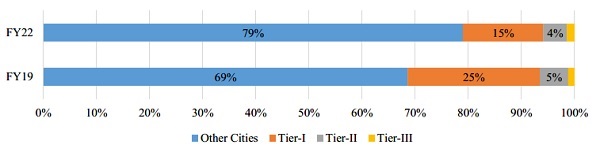
Observations:
- During FY22, the share of individual traders from Tier-I cities went down to 15% from 25%.
Chart A.3.3.2: Share in Profit by Profit makers across City Groups in FY22
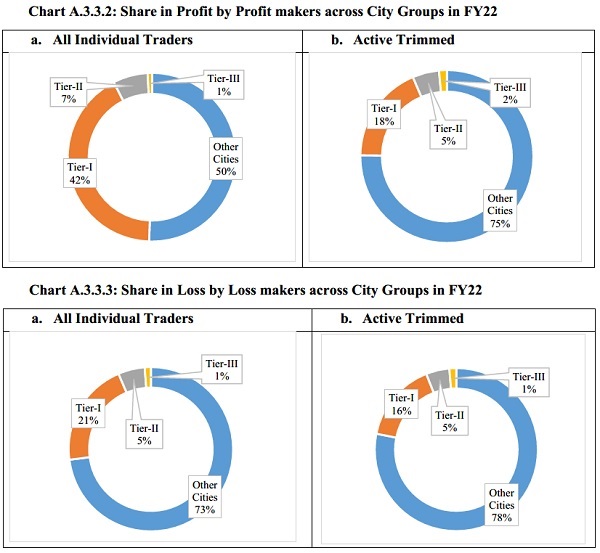
Observations:
- During FY22, the share in profit by profit makers from Tier-I cities was 42% for group of all individual traders as compared to 18% for a group of profit makers in active trimmed cohort. This indicates the concentration of top profit makers (outliers) in Tier-I cities.
- Similar trend was observed for loss makers from Tier-I cities.
Table A.3.3.1: Average P&L across City Groups
| City groups | Average P&L |
Average profit made by profit makers |
Average loss realized by loss makers |
Average P&L |
Average profit made by profit makers |
Average loss realized by loss makers |
| FY19 | FY22 | |||||
| All Individual Traders | ||||||
| Tier-I | -1,59,444 | 2,53,236 | -2,45,745 | -88,925 | 3,06,174 | -1,58,516 |
| Tier-II | -1,60,665 | 1,53,615 | -2,23,978 | -91,650 | 1,86,108 | -1,34,140 |
| Tier-III | -98,395 | 81,712 | -1,28,667 | -75,412 | 92,215 | -95,658 |
| Other Cities | -1,12,964 | 97,611 | -1,45,649 | -80,921 | 1,06,215 | -1,01,674 |
| Active Trimmed Distribution | ||||||
| Tier-I | -90,562 | 8,895 | -1,01,888 | -63,409 | 3,672 | -68,159 |
| Tier-II | -86,558 | 8,882 | -97,495 | -61,228 | 3,555 | -65,449 |
| Tier-III | -72,861 | 7,198 | -80,987 | -55,524 | 3,389 | -59,121 |
| Other Cities | -78,352 | 8,104 | -86,623 | -55,363 | 3,286 | -58,691 |
Note: Values are in Rs.
Observations:
- During both FY19 and FY22, the highest average profit made by profit makers as well as highest average loss incurred by loss makers was from Tier-I cities.
B. Product wise Analysis
B.1. Product wise Individual Traders’ Participation
Observations:
- It has been observed that among all the unique individual traders who traded in equity F&O segment, 98% traded in options, while 11% traded in futures during FY22 as compared to 89% and 43% respectively, during FY19.
Table B.1.1: Product wise Distribution of Client Participation
| FY19 | FY22 | |||||||
| Product Category |
Total Client |
% share |
% of profit maker |
% of loss maker |
Total Client |
% share |
% of profit maker |
% of loss maker |
| All Individual Traders | ||||||||
| Index Futures | 1,66,272 | 12% | 21% | 79% | 3,26,694 | 5% | 26% | 74% |
| Index Options | 5,34,837 | 39% | 17% | 83% | 42,43,475 | 61% | 11% | 89% |
| Stock Futures | 2,51,863 | 18% | 20% | 80% | 3,41,742 | 5% | 33% | 67% |
| Stock Options | 4,26,828 | 31% | 19% | 81% | 20,84,545 | 30% | 18% | 82% |
| Active Trimmed Distribution | ||||||||
| Index Futures | 1,02,536 | 12% | 12% | 83% | 1,92,802 | 4% | 21% | 79% |
| Index Options | 3,47,476 | 39% | 15% | 85% | 32,97,732 | 63% | 8% | 92% |
| Stock Futures | 1,51,829 | 17% | 15% | 85% | 1,75,818 | 3% | 24% | 76% |
| Stock Options | 2,80,096 | 32% | 16% | 84% | 15,97,166 | 30% | 15% | 85% |
Note: Total clients in above table do not reflect unique set of clients as a client may have traded in multiple products.
Observations:
- of individual traders in index options and stock options went up by nearly 8 and 5 times respectively in FY22 as compared to FY19.
- In all product categories, percentage of individual traders who had incurred losses were significantly higher than percentage of individual traders who had earned profit during both the years.
- During FY22, 89% and 82% of the individual traders who traded in index options and stock options respectively, incurred losses. The percentage was even higher at 92% and 85% respectively, for individual traders belonging to active trimmed distribution.
- Further, 74% and 67% of the individual traders who traded in index futures and stock futures respectively lost money during FY22, down from 79% and 80% respectively during FY19.
- Percentage of loss makers who traded in index options and stock options went up during FY22 over FY19.
B.2. Product-wise P&L made by Individual Traders
Chart B.2.1: Distribution of Net Trading P&L of All Individual Traders
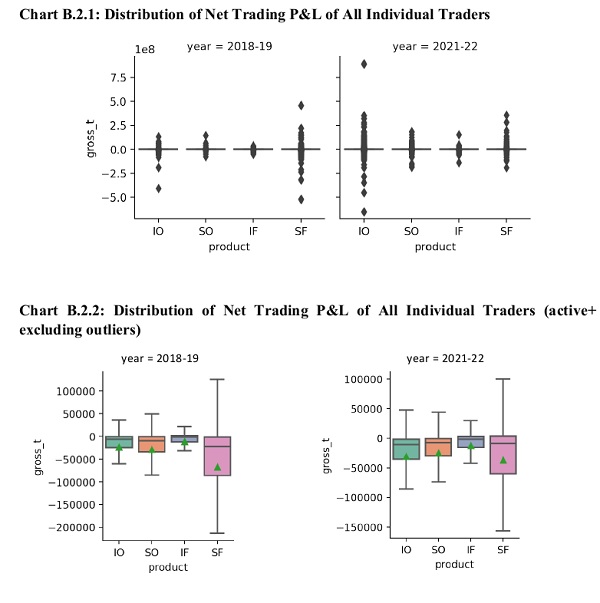 Table B.2.1: Product-wise Net P&L of Individual Traders
| Product Category |
Average P&L
(All Individual Traders) |
Average P&L (Active Individual Traders) |
Average P&L (Active Trimmed) |
|||
| FY19 | FY22 | FY19 | FY22 | FY19 | FY22 | |
| All Individual Traders | ||||||
| Index Futures | -46,755 | -53,267 | -46,632 | -53,955 | -25,748 | -28,541 |
| Index Options | -50,068 | -58,058 | -53,830 | -64,136 | -32,556 | -39,553 |
| Stock Futures | -1,54,292 | -59,007 | -1,57,534 | -64,940 | -86,342 | -50,550 |
| Stock Options | -38,144 | -42,947 | -40,395 | -44,513 | -33,515 | -30,466 |
–
| Profit Makers | ||||||
| Index Futures | 45,152 | 66,244 | 45,130 | 67,112 | 14,086 | 21,889 |
| Index Options | 56,515 | 92,321 | 61,666 | 1,05,812 | 13,689 | 11,450 |
| Stock Futures | 1,91,367 | 2,40,705 | 1,90,662 | 2,24,782 | 35,871 | 45,450 |
| Stock Options | 55,002 | 63,388 | 59,263 | 64,490 | 18,966 | 13,862 |
| Loss Makers | ||||||
| Index Futures | -71,178 | -96,338 | -68,441 | -95,263 | -34,050 | -42,262 |
| Index Options | -72,192 | -77,230 | -76,910 | -84,427 | -40,625 | -43,975 |
| Stock Futures | -2,42,565 | -2,08,977 | -2,38,660 | -2,03,514 | -1,07,494 | -81,464 |
| Stock Options | -59,916 | -66,217 | -62,699 | -67,542 | -43,503 | -38,050 |
Values in Rs.
Observations:
- During FY22, the average loss incurred by loss makers in stock futures was Rs. 2.1 lakh, highest across all products, followed by an average loss of Rs. 0.96 lakh in index futures.
- Further, the average loss made by loss makers in index options and stock options were Rs. 0.77 lakh and Rs. 0.66 lakh, respectively during FY22.
- The average profit earned by profit makers was highest in stock futures (Rs. 2.4 lakh), followed by index options (Rs. 0.92 lakh).
- During FY22, 11% of the individual traders in index options made profit, down from 17% in FY19, however, the average profit made by profit makers went up by 63% during FY22 over FY19.
B.3. Attribute wise Individual Traders’ participation and P&L made by Individual Traders
- The observations pertaining to product wise analysis across various attributes (age, gender, city) have been provided in this sub-section for the cohort of active trimmed distribution. However, major observations, if any, observed for all individual traders’ group, have also been highlighted.
B.3.1. Age Group wise Analysis
Chart B.3.1.1: Product wise Client Participation across age-groups (Active trimmed)

Observations:
- During FY22, the share of young individual traders’ (20-30 years) participation in equity F&O segment, especially in index options and stock options, went up beyond 30% each from nearly 11% in FY19.
- The percentage share of participation for youngest group of individual traders (<20 years) went up marginally for all product categories during FY22 over FY19. In index options, the percentage share went up to 1.1% from 0.2% during the same period.
Chart B.3.1.2: Age wise Distribution of Profit makers /Loss makers in FY22 (Active trimmed)

Chart B.3.1.3: Share in Profit/ Loss by Profit/ Loss makers across age-group in FY22 (Active trimmed)
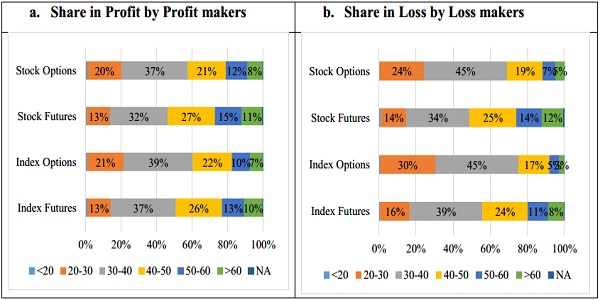
Observations:
- During FY22, 34% of the profit makers traded in index options belonged to age group 20-30 years; however, they accounted for only 21% of the total net profit earned by all profit makers, whereas 26% of the profit makers were from age group >40 years, who accounted for 39% of the total net profit earned by all profit makers. Similar trend has been observed in stock options.
Table B.3.1.1: Average Profit/ Loss across age-groups in FY22 (All Individual Traders)
| Product Category |
Age Groups |
|||||
| <20 | 20-30 | 30-40 | 40-50 | 50-60 | >60 | |
| All Individual Traders | ||||||
| Index Futures | -1,36,752 | -35,954 | -45,522 | -58,217 | -74,648 | -72,863 |
| Index Options | 6,295 | -37,003 | -67,921 | -83,574 | -73,497 | -64,244 |
| Stock Futures | -63,003 | -42,435 | -55,513 | -67,135 | -79,124 | -77,435 |
| Stock Options | -21,193 | -27,374 | -46,391 | -58,304 | -57,110 | -41,288 |
| Profit Makers | ||||||
| Index Futures | 1,66,358 | 39,165 | 52,361 | 78,219 | 82,997 | 90,111 |
| Index Options | 3,82,805 | 42,234 | 74,902 | 1,27,101 | 1,81,206 | 1,94,700 |
| Stock Futures | 5,37,481 | 1,35,969 | 1,54,147 | 2,58,927 | 3,26,029 | 3,88,327 |
| Stock Options | 1,37,442 | 25,613 | 44,438 | 85,355 | 1,25,191 | 1,87,579 |
| Loss Makers | ||||||
| Index Futures | -3,17,644 | -58,383 | -77,465 | -1,11,562 | -1,42,043 | -1,47,556 |
| Index Options | -33,728 | -44,974 | -85,569 | -1,17,008 | -1,26,308 | -1,34,524 |
| Stock Futures | -4,82,775 | -1,24,872 | -1,51,336 | -2,35,757 | -3,03,115 | -3,46,546 |
| Stock Options | -70,601 | -37,819 | -64,526 | -93,164 | -1,11,408 | -1,23,092 |
Note: Values are in Rs.
Observations:
- Only the youngest group of individual traders (<20 years) made an average profit in index options during both the years i.e. FY19 and FY22, whereas individual traders from all other age groups incurred average losses during both the year.
- Further, the average profit earned by the youngest profit makers was significantly higher than other age groups with average profit of Rs. 5.4 lakh in stock futures followed by an average profit of Rs. 3.8 lakh in index options and Rs. 1.7 lakh in index futures during FY22.
Table B.3.1.2: Average Profit/ Loss across age-groups in FY22 (Active trimmed)
| Product Category |
Age Groups | |||||
| <20 | 20-30 | 30-40 | 40-50 | 50-60 | >60 | |
| All Individual Traders | ||||||
| Index Futures | -29,889 | -23,495 | -27,716 | -31,294 | -32,208 | -33,670 |
| Index Options | -19,373 | -30,669 | -44,542 | -48,655 | -46,598 | -45,953 |
| Stock Futures | -74,523 | -40,299 | -44,899 | -54,599 | -61,874 | -68,100 |
| Stock Options | -16,979 | -22,408 | -32,553 | -37,387 | -37,716 | -42,315 |
| Profit Makers | ||||||
| Index Futures | 30,367 | 16,405 | 20,612 | 24,187 | 25,545 | 27,308 |
| Index Options | 9,927 | 7,071 | 11,330 | 16,004 | 18,753 | 20,086 |
| Stock Futures | 55,311 | 34,162 | 38,425 | 51,727 | 61,719 | 59,001 |
| Stock Options | 15,479 | 8,378 | 12,743 | 18,450 | 26,721 | 29,298 |
| Loss Makers | ||||||
| Index Futures | -54,584 | -32,681 | -40,175 | -47,741 | -50,430 | -54,037 |
| Index Options | -21,477 | -33,480 | -49,307 | -55,270 | -55,007 | -56,669 |
| Stock Futures | -1,12,178 | -63,484 | -71,500 | -89,449 | -1,02,949 | -1,10,128 |
| Stock Options | -24,304 | -27,588 | -39,862 | -47,393 | -50,919 | -58,359 |
Values in Rs.
Observations:
- Youngest age group (<20 years), which accounted for around 1% share in participation, witnessed the highest average loss in futures segment as compared to all other age groups in FY22.
- Loss makers belonging to the youngest age group incurred lowest average loss in index options in FY22.
B.3.2. Gender wise Analysis
Chart B.3.2.1: Product wise Client Participation across Gender group (Active trimmed)

Observations:
- During FY22, the female participation in stock futures and index futures went up to 27% and 24% respectively, up from 22% and 22% as compared to FY19.
- However, in options segment, the percentage share in participation by female traders went down during FY22 over FY19.
Chart B.3.2.2: Gender wise Distribution of Profit makers /Loss makers in FY22 (Active trimmed)

Observations:
- In line with high share in participation, the percentage share in profit by male profit makers as well as percentage share in loss by male loss makers dominate the equity F&O segment for all product categories.
Table B.3.2.1: Average profit/ Loss across Gender in FY22 (Active trimmed)
| Product Category |
Female | Male | Female | Male | Female | Male |
| All Individual Traders | Profit Makers | Loss Makers | ||||
| Index Futures | -29,501 | -28,213 | 23,668 | 21,198 | -46,168 | -41,028 |
| Index Options | -38,963 | -39,650 | 14,462 | 10,681 | -45,509 | -43,717 |
| Stock Futures | -56,501 | -48,285 | 50,646 | 43,453 | -91,733 | -77,589 |
| Stock Options | -33,927 | -29,767 | 18,448 | 12,731 | -44,328 | -36,805 |
Values in Rs.
Observations:
- During FY22, the average loss incurred by female loss makers as well as average profit made by female profit makers was higher than their male counterparts in all product categories, however, females had less than 20% share in participation.
B.3.3 City Group wise Analysis
Chart B.3.3.1: Product wise Client Participation across city groups (Active trimmed)

Observations:
- During FY22, the individual traders’ participation in other than Tier-I, Tier-II and Tier-III group, went up as compared to FY19, especially in index options.
Chart B.3.3.2: City Group wise Distribution of Profit makers /Loss makers in FY22 (Active trimmed)

Observations:
- In line with high share in participation, the percentage share in profit by profit makers as well as percentage share in loss by loss makers belonging to ‘other cities’ was highest for all product categories.
Table B.3.3.1: Average profit/ Loss across city groups in FY22 (Active trimmed)
| Product Category | City Groups | |||
| Tier-I | Tier-II | Tier-III | Others | |
| All Individual traders | ||||
| Index Futures | -31,918 | -29,630 | -27,692 | -27,487 |
| Index Options | -40,234 | -39,897 | -38,196 | -39,444 |
| Stock Futures | -55,319 | -58,624 | -53,656 | -48,184 |
| Stock Options | -34,153 | -33,385 | -28,514 | -29,613 |
| Profit Makers | ||||
| Index Futures | 26,277 | 22,966 | 17,547 | 20,460 |
| Index Options | 16,883 | 14,059 | 10,247 | 10,086 |
| Stock Futures | 66,179 | 44,740 | 32,613 | 38,574 |
| Stock Options | 20,675 | 16,747 | 12,098 | 12,256 |
| Loss Makers | ||||
| Index Futures | -49,224 | -46,275 | -41,276 | -40,010 |
| Index Options | -46,660 | -45,302 | -42,575 | -43,492 |
| Stock Futures | -95,453 | -90,870 | -82,517 | -75,936 |
| Stock Options | -44,376 | -42,563 | -35,616 | -36,620 |
Values in Rs.
Observations:
- During FY22, the average profit made by profit makers as well as average loss made by loss makers was highest for Tier-I cities followed by Tier-II cities and Tier-III cities, respectively, for all the four product categories.
Chart B.3.3.3: Average P&L across city groups in FY22 (Active trimmed)
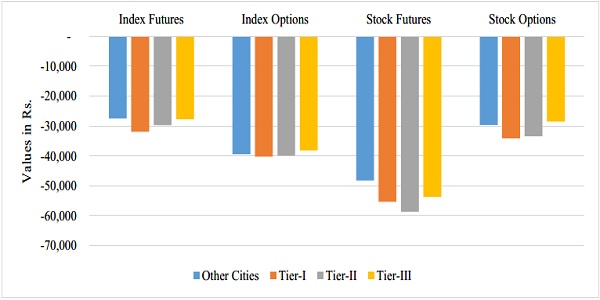
Table B.3.3.2: Average profit/ Loss across major Tier-I cities in FY22 (Active trimmed)
| Product Category |
Ahmedabad | Bengaluru | Kolkata | Mumbai | New Delhi |
| All Individual traders | |||||
| Index Futures | -28,420 | -35,496 | -32,397 | -31,963 | -30,103 |
| Index Options | -38,393 | -48,810 | -38,325 | -37,153 | -40,331 |
| Stock Futures | -56,071 | -53,315 | -45,911 | -56,838 | -56,978 |
| Stock Options | -32,310 | -37,913 | -36,024 | -32,302 | -34,918 |
| Profit Makers | |||||
| Index Futures | 20,700 | 27,374 | 29,152 | 25,549 | 28,283 |
| Index Options | 13,956 | 18,431 | 23,226 | 14,839 | 18,950 |
| Stock Futures | 61,027 | 46,255 | 1,46,835 | 72,307 | 52,892 |
| Stock Options | 15,437 | 20,528 | 29,182 | 20,243 | 22,430 |
| Loss Makers | |||||
| Index Futures | -45,602 | -51,456 | -51,762 | -49,746 | -47,328 |
| Index Options | -43,929 | -56,715 | -46,478 | -42,887 | -46,999 |
| Stock Futures | -94,339 | -82,822 | -1,10,269 | -1,00,906 | -94,654 |
| Stock Options | -40,788 | -48,493 | -50,136 | -42,080 | -45,833 |
Values in Rs.
Table B.3.3.3: Average profit/ Loss across major Tier-II cities in FY22 (Active trimmed)
| Product Category |
Ghaziabad | Gurgaon | Indore | Jaipur | Vadodara |
| All Individual traders | |||||
| Index Futures | -32,618 | -28,293 | -28,525 | -28,985 | -28,547 |
| Index Options | -41,504 | -46,189 | -35,701 | -39,964 | -37,079 |
| Stock Futures | -60,741 | -60,311 | -45,902 | -57,601 | -64,971 |
| Stock Options | -37,767 | -36,417 | -28,764 | -32,947 | -30,937 |
| Profit Makers | |||||
| Index Futures | 23,789 | 26,705 | 18,390 | 24,245 | 18,996 |
| Index Options | 17,727 | 14,540 | 9,762 | 13,993 | 13,521 |
| Stock Futures | 47,999 | 45,404 | 37,791 | 47,708 | 40,309 |
| Stock Options | 19,797 | 21,505 | 10,543 | 16,973 | 14,571 |
| Loss Makers | |||||
| Index Futures | -50,244 | -46,199 | -43,319 | -46,028 | -43,132 |
| Index Options | -48,215 | -52,474 | -39,616 | -45,319 | -42,167 |
| Stock Futures | -93,909 | -94,375 | -75,526 | -89,149 | -95,866 |
| Stock Options | -48,475 | -47,432 | -35,729 | -42,404 | -38,761 |
Values in Rs.
Observations:
- During FY22, average profit by profit makers was highest for Kolkata across all the products.
- Witnessing similar trend, average loss by loss makers was highest for Kolkata across all the products except index options.
C. Transaction Cost (TC)
- Aggregate transaction cost includes brokerage, clearing fees, exchange fees, SEBI turnover fees, STT, GST etc.
- The findings are based on ‘transaction cost as % of net trading profit/ loss’ to analyse additional cost incurred by traders on top of their net trading profit/ losses.
- Since aggregate transaction cost is generally directly proportional to the number of trades executed by a trader, higher transaction cost indicates frequent trading.
C.1. Transaction Cost across all Products
Chart C.1.1: Transaction Cost as % of Net Trading Profit/ Loss earned by Profit/ Loss makers
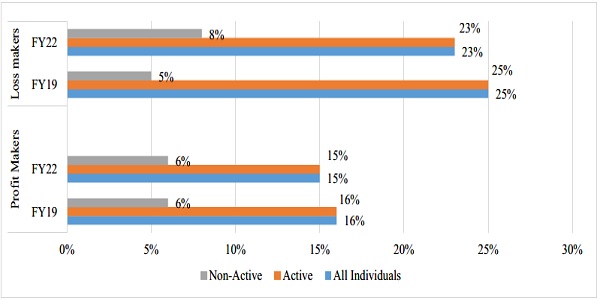
Table C.1.1: Transaction Cost spent by Profit/ Loss Makers
| All Individual Traders |
Active Individual Traders |
Non-active Individual Traders | Active Trimmed Individual Traders |
|||||
| FY19 | FY22 | FY19 | FY22 | FY19 | FY22 | FY19 | FY22 | |
| Profit Makers | ||||||||
| TC as % of total net trading profit made by profit makers | 16% | 15% | 16% | 15% | 6% | 6% | 48% | 52% |
| Loss Makers | ||||||||
| TC as % of total net trading loss made by loss makers | 25% | 23% | 25% | 23% | 5% | 8% | 32% | 28% |
Observations:
- During FY22, over and above the net trading losses incurred, loss makers expended an additional 28% of net trading losses as transaction costs (for the group of active traders excluding outliers), reflecting frequent trading. For non-active traders who made losses, the percentage was significantly low at 8%.
- Even those making net trading profits, incurred between 15% to 50% of such profits as transaction cost. However, the percentage was significantly low at 6% for non-active traders who made profit.
Table C.1.2: Transaction Cost spent by Active Profit makers
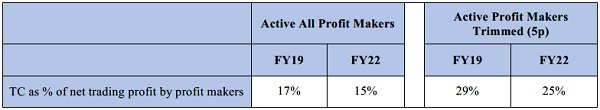
Observations:
- Profit makers spent lower transaction cost in FY22 as compared to FY19.
- Transaction cost as percentage of net trading profit incurred by the profit makers declined to 25% in FY22 as compared to 29% in FY19. (active trimmed 5p)
C.2. Product Wise Transaction Cost
The observations pertaining to product wise analysis of transaction cost have been provided in this sub-section, for the cohort of active profit makers, excluding outliers (top 5 percentile).
Chart C.2.1: Product-wise Transaction Cost for Active Profit Makers (Trimmed-5p)
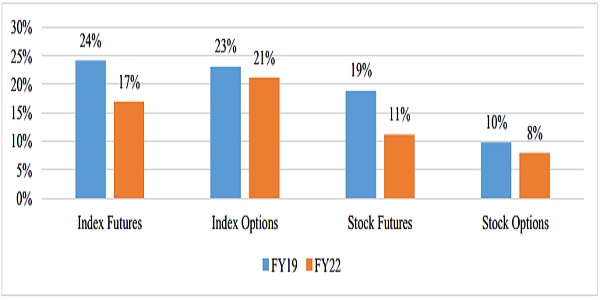
Observations:
- During FY22, the TC as percentage of net trading profit, declined across all product categories over FY19.
- During FY22, TC as percentage of net trading profit was highest for index options (21%), followed by index futures (17%), whereas, it was comparatively lower for stock futures (11%) and stock options (8%).
C.3. Attribute wise Transaction Cost
The observations pertaining to attribute wise analysis of transaction cost have been provided in this sub-section, for the cohort of active profit makers, excluding outliers (top 5 percentile).
C.3.1. Age Group wise Transaction Cost
Chart C.3.1.1: Age-Group wise Transaction Cost for Active Profit Makers (Trimmed-5p)
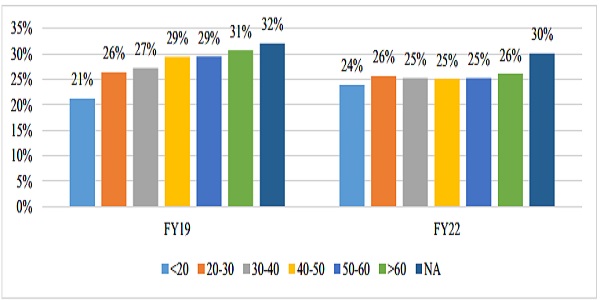
Observations:
- During FY22, a declining trend in TC as percentage of net trading profit, was seen for profit makers belonging to age groups >30 years (range of 25% to 26%) as compared to FY19 where the range was 27% to 31%.
- Youngest group of profit makers spent the lowest TC as percentage of net trading profit during both the years.
C.3.2. Gender wise Transaction Cost
Chart C.3.2.1: Gender-wise Transaction Cost for Active Profit Makers (Trimmed-5p)

Observations:
- Male profit makers spent higher TC as percentage of net trading profit, than female profit makers in both the years.
C.3.3 City Group wise Transaction Cost
Chart C.3.3.1: City group-wise Transaction Cost for Active Profit Makers (Trimmed-5p)
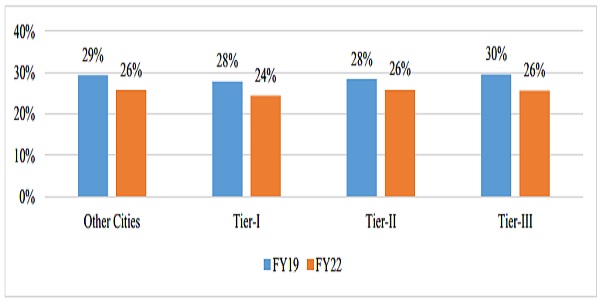
Observations:
- During FY22, profit makers from Tier-I cities spent lowest TC as percentage of net trading profit (24%), as compared to Tier-II, Tier-III and other city groups.
- The TC as percentage of net trading profit, went down across all city groups during FY22 over FY19.
D. Correlation of Portfolio Net Trading P&L13 and Net Trading P&L incurred in Equity F&O segment by Individual Traders
- On a sample of 36.7 lakh individual traders in equity F&O segment during FY22 (and 4.9 lakh individual traders in FY19), the correlation between Portfolio net trading P&L and net trading P&L made in equity F&O segment, stood at 0.84 and 0.80 in FY19 and FY22, respectively.
- Correlation between net trading P&L incurred by individual traders in equity F&O segment and cash segment was 0.06 and -0.07 in FY19 and FY22, respectively.
Chart D.1: Distribution of Portfolio Net Trading P&L and Net Trading P&L incurred in Equity F&O segment by Individual Traders

******
Notes:-
1 Individual investor includes HUF and NRIs (excludes Proprietary traders, institutions, partnership firms etc.)
2 Net Profit/Loss is Net trading profit/loss realized – Cost of Transactions during the year; Net Profit/ Loss (P&L) has been calculated as P&L realized by an individual trader during a year based on contracts bought/ sold/ expired during the year.
3 Findings are based on data collected from top 10 brokers accounting for around 67 per cent of the overall individual client turnover in the equity F&O segment during FY22, where the brokers were identified on the basis of largest percentage share of individual investors’ turnover in equity F&O segment.
4 Active traders are individual traders who traded in equity F&O segment more than 5 times during a year
5 Individual traders who made net losses during the specific time period
6 Unless otherwise specified, profit/ loss mentioned in this study indicates net profit/ net loss
7 Outliers: Individual traders belonging to top5 and bottom 5 percentile of the corresponding P&L distribution
8 Individual traders who made net profit during the specific time period
9 Aggregate transaction cost includes Brokerage, Clearing Fee, Exchange Fee, SEBI Turnover Fee, STT, GST etc. Since aggregate transaction cost is generally directly proportional to the number of trades executed by a trader, higher transaction cost indicates frequent trading.
10 For the group of active traders excluding outliers
11 All the figures are pertaining to group of active profit makers, excluding outliers (top 5 percentile)
12 Net Profit/Loss: Net trading P/L – Transaction Cost
13 Portfolio net trading P&L : Net trading P&L made by individual traders from trading in both equity F&O segment and cash segment


